Huánuco Airbnb Market Analysis 2026: Short Term Rental Data & Vacation Rental Statistics in Huánuco, Peru
Is Airbnb profitable in Huánuco in 2026? Explore comprehensive Airbnb analytics for Huánuco, Huánuco, Peru to uncover income potential. This 2026 STR market report for Huánuco, based on AirROI data from February 2025 to January 2026, reveals key trends in the niche market of 38 active listings.
Whether you're considering an Airbnb investment in Huánuco, optimizing your existing vacation rental, or exploring rental arbitrage opportunities, understanding the Huánuco Airbnb data is crucial. Leveraging the low regulation environment is key to maximizing your short term rental income potential. Let's dive into the specifics.
Key Huánuco Airbnb Performance Metrics Overview
Monthly Airbnb Revenue Variations & Income Potential in Huánuco (2026)
Understanding the monthly revenue variations for Airbnb listings in Huánuco is key to maximizing your short term rental income potential. Seasonality significantly impacts earnings. Our analysis, based on data from the past 12 months, shows that the peak revenue month for STRs in Huánuco is typically June, while September often presents the lowest earnings, highlighting opportunities for strategic pricing adjustments during shoulder and low seasons. Explore the typical Airbnb income in Huánuco across different performance tiers:
- Best-in-class properties (Top 10%) achieve $567+ monthly, often utilizing dynamic pricing and superior guest experiences.
- Strong performing properties (Top 25%) earn $372 or more, indicating effective management and desirable locations/amenities.
- Typical properties (Median) generate around $179 per month, representing the average market performance.
- Entry-level properties (Bottom 25%) see earnings around $86, often with potential for optimization.
Average Monthly Airbnb Earnings Trend in Huánuco
Huánuco Airbnb Occupancy Rate Trends (2026)
Maximize your bookings by understanding the Huánuco STR occupancy trends. Seasonal demand shifts significantly influence how often properties are booked. Typically, Junesees the highest demand (peak season occupancy), while September experiences the lowest (low season). Effective strategies, like adjusting minimum stays or offering promotions, can boost occupancy during slower periods. Here's how different property tiers perform in Huánuco:
- Best-in-class properties (Top 10%) achieve 61%+ occupancy, indicating high desirability and potentially optimized availability.
- Strong performing properties (Top 25%) maintain 41% or higher occupancy, suggesting good market fit and guest satisfaction.
- Typical properties (Median) have an occupancy rate around 21%.
- Entry-level properties (Bottom 25%) average 10% occupancy, potentially facing higher vacancy.
Average Monthly Occupancy Rate Trend in Huánuco
Average Daily Rate (ADR) Airbnb Trends in Huánuco (2026)
Effective short term rental pricing strategy in Huánuco involves understanding monthly ADR fluctuations. The Average Daily Rate (ADR) for Airbnb in Huánuco typically peaks in December and dips lowest during March. Leveraging Airbnb dynamic pricing tools or strategies based on this seasonality can significantly boost revenue. Here's a look at the typical nightly rates achieved:
- Best-in-class properties (Top 10%) command rates of $47+ per night, often due to premium features or locations.
- Strong performing properties (Top 25%) achieve nightly rates of $36 or more.
- Typical properties (Median) charge around $28 per night.
- Entry-level properties (Bottom 25%) earn around $19 per night.
Average Daily Rate (ADR) Trend by Month in Huánuco
Get Live Huánuco Market Intelligence 👇

Explore Real-time Analytics
Airbnb Seasonality Analysis & Trends in Huánuco (2026)
Peak Season (June, May, January)
- Revenue averages $313 per month
- Occupancy rates average 30.3%
- Daily rates average $30
Shoulder Season
- Revenue averages $260 per month
- Occupancy maintains around 28.6%
- Daily rates hold near $29
Low Season (March, September, December)
- Revenue drops to average $218 per month
- Occupancy decreases to average 23.7%
- Daily rates adjust to average $30
Seasonality Insights for Huánuco
- The Airbnb seasonality in Huánuco shows moderate seasonality with distinct peak and low periods. While the sections above show seasonal averages, it's also insightful to look at the extremes:
- During the high season, the absolute peak month showcases Huánuco's highest earning potential, with monthly revenues capable of climbing to $337, occupancy reaching a high of 33.3%, and ADRs peaking at $33.
- Conversely, the slowest single month of the year, typically falling within the low season, marks the market's lowest point. In this month, revenue might dip to $184, occupancy could drop to 19.6%, and ADRs may adjust down to $27.
- Understanding both the seasonal averages and these monthly peaks and troughs in revenue, occupancy, and ADR is crucial for maximizing your Airbnb profit potential in Huánuco.
Seasonal Strategies for Maximizing Profit
- Peak Season: Maximize revenue through premium pricing and potentially longer minimum stays. Ensure high availability.
- Low Season: Offer competitive pricing, special promotions (e.g., extended stay discounts), and flexible cancellation policies. Target off-season travelers like remote workers or budget-conscious guests.
- Shoulder Seasons: Implement dynamic pricing that balances peak and low rates. Target weekend travelers or specific events. Offer slightly more flexible terms than peak season.
- Regularly analyze your own performance against these Huánuco seasonality benchmarks and adjust your pricing and availability strategy accordingly.
Best Areas for Airbnb Investment in Huánuco (2026)
Exploring the top neighborhoods for short-term rentals in Huánuco? This section highlights key areas, outlining why they are attractive for hosts and guests, along with notable local attractions. Consider these locations based on your target guest profile and investment strategy.
| Neighborhood / Area | Why Host Here? (Target Guests & Appeal) | Key Attractions & Landmarks |
|---|---|---|
| Centro Histórico | The historical center of Huánuco, filled with colonial architecture and vibrant local culture. Ideal for guests interested in history and local life, with many restaurants and shops nearby. | Plaza de Armas, Iglesia de San Francisco, Museo Regional Huánuco, Casa de la Cultura, Mercado Modelo |
| Pampa de la Luna | A residential area that's becoming popular for its proximity to natural attractions and scenic views. Great for nature lovers and those looking for a relaxing retreat. | Laguna de Ahuac, Cerro de La Paz, Parque Ecológico, Hiking trails |
| Tingo María | A nearby town known for its lush landscapes and biodiversity, perfect for adventurous guests and eco-tourism. Offers opportunities for exploring natural parks and waterfalls. | Parque Nacional Tingo María, Cueva de Las Lechuzas, Catarata de Santa Carmen, Eco-tourism activities |
| Huamalíes | Known for its beautiful landscapes and traditional Andean culture. Attracts guests interested in cultural immersion and natural beauty. | Laguna de Pucacocha, Cañón de Cotahuasi, Andean markets, Local festivals |
| Yanahuanca | A quaint town that serves as a gateway to beautiful mountainous regions. Offers a peaceful atmosphere and opportunities for outdoor activities. | Cerro de Yanahuanca, Cascada de Moya, local artisan crafts, mountain hiking |
| Churubamba | A small district attracting visitors for its tranquility and beautiful views of the surrounding hills. Ideal for a quiet getaway. | Mirador de Churubamba, local farms, cultural experiences |
| Cochabamba | Known for its agricultural produce and traditional lifestyle. It's gaining popularity for those looking to experience rustic living. | Local markets, traditional festivals, cultural workshops |
| Santa María del Valle | A scenic area close to Huánuco featuring picturesque landscapes and a warm community. Great for family-oriented guests and those looking to escape the city. | Valle del Huallaga, cultural heritage sites, nature reserves |
Understanding Airbnb License Requirements & STR Laws in Huánuco (2026)
While Huánuco, Huánuco, Peru currently shows low STR regulations, specific Airbnb license requirements might still exist or change. Always verify the latest short term rental regulations and Airbnb license requirements directly with local government authorities for Huánuco to ensure full compliance before hosting.
(Source: AirROI data, 2026, finding no licensed listings among those analyzed)
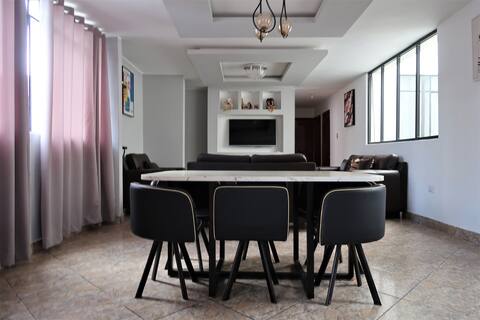
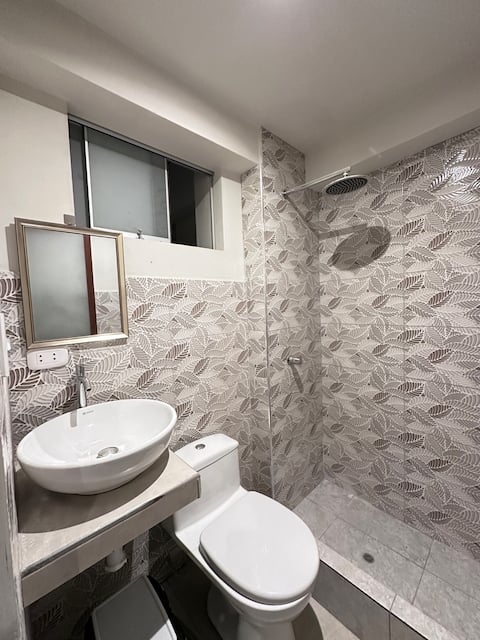
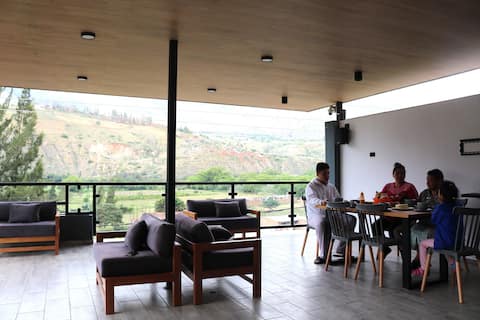
Top Performing Airbnb Properties in Huánuco (2026)
Benchmark your potential! Explore examples of top-performing Airbnb properties in Huánucobased on Trailing Twelve Month (TTM) revenue. Analyze their characteristics, revenue, occupancy rate, and ADR to understand what drives success in this market.

brand new apartment for rent
Entire Place • 3 bedrooms
Terrace Jacuzzi Centro Huanuco Apartment
Entire Place • 2 bedrooms

Lovely place in downtown Huánuco
Entire Place • 2 bedrooms

Modern Apartment 5min from Plaza-Wifi 1,000Mbps + Netflix
Entire Place • 1 bedroom
Apartment 3 minutes from Plaza Huánuco and 1 block from Open Plaza
Entire Place • 1 bedroom
modern apartment for rent
Entire Place • 2 bedrooms
Note: Performance varies based on location, size, amenities, seasonality, and management quality. Data reflects the past 12 months.
Top Performing Airbnb Hosts in Huánuco (2026)
Learn from the best! This table showcases top-performing Airbnb hosts in Huánuco based on the number of properties managed and estimated total revenue over the past year. Analyze their scale and performance metrics.
| Host Name | Properties | Grossing Revenue | Stay Reviews | Avg Rating |
|---|---|---|---|---|
| Luis | 7 | $13,830 | 140 | 4.99/5.0 |
| Jhon Kalamaro | 3 | $7,993 | 63 | 4.74/5.0 |
| Leninger | 2 | $7,473 | 67 | 4.86/5.0 |
| Braulio | 2 | $5,008 | 50 | 4.85/5.0 |
| Marco | 1 | $4,407 | 19 | 4.84/5.0 |
| Nilton | 2 | $3,688 | 117 | 4.85/5.0 |
| Ximena | 1 | $2,481 | 4 | 5.00/5.0 |
| Ivan | 1 | $2,325 | 11 | 4.73/5.0 |
| Domin | 2 | $2,028 | 41 | 4.97/5.0 |
| Amanda | 1 | $1,831 | 21 | 4.90/5.0 |
Analyzing the strategies of top hosts, such as their property selection, pricing, and guest communication, can offer valuable lessons for optimizing your own Airbnb operations in Huánuco.
Dive Deeper: Advanced Huánuco STR Market Data (2026)
Ready to unlock more insights? AirROI provides access to advanced metrics and comprehensive Airbnb data for Huánuco. Explore detailed analytics beyond this report to refine your investment strategy, optimize pricing, and maximize your vacation rental profits.
Explore Advanced MetricsHuánuco Short-Term Rental Market Composition (2026): Property & Room Types
Room Type Distribution
Property Type Distribution
Market Composition Insights for Huánuco
- The Huánuco Airbnb market composition is heavily skewed towards Entire Home/Apt listings, which make up 76.3% of the 38 active rentals. This indicates strong guest preference for privacy and space.
- Looking at the property type distribution in Huánuco, Apartment/Condo properties are the most common (71.1%), reflecting the local real estate landscape.
- Houses represent a significant 21.1% portion, catering likely to families or larger groups.
- The presence of 7.9% Hotel/Boutique listings indicates integration with traditional hospitality.
Huánuco Airbnb Room Capacity Analysis (2026): Bedroom Distribution
Distribution of Listings by Number of Bedrooms
Room Capacity Insights for Huánuco
- The dominant room capacity in Huánuco is 2 bedrooms listings, making up 44.7% of the market. This suggests a strong demand for properties suitable for couples or solo travelers.
- Together, 2 bedrooms and 1 bedroom properties represent 65.8% of the active Airbnb listings in Huánuco, indicating a high concentration in these sizes.
- A significant 21.1% of listings offer 3+ bedrooms, catering to larger groups and families seeking more space in Huánuco.
Huánuco Vacation Rental Guest Capacity Trends (2026)
Distribution of Listings by Guest Capacity
Guest Capacity Insights for Huánuco
- The most common guest capacity trend in Huánuco vacation rentals is listings accommodating 4 guests (39.5%). This suggests the primary traveler segment is likely small families or groups.
- Properties designed for 4 guests and 5 guests dominate the Huánuco STR market, accounting for 57.9% of listings.
- On average, properties in Huánuco are equipped to host 3.4 guests.
Huánuco Airbnb Booking Patterns (2026): Available vs. Booked Days
Available Days Distribution
Booked Days Distribution
Booking Pattern Insights for Huánuco
- The most common availability pattern in Huánuco falls within the 271-366 days range, representing 81.6% of listings. This suggests many properties have significant open periods on their calendars.
- Approximately 100.0% of listings show high availability (181+ days open annually), indicating potential for increased bookings or specific owner usage patterns.
- For booked days, the 1-30 days range is most frequent in Huánuco (47.4%), reflecting common guest stay durations or potential owner blocking patterns.
Huánuco Airbnb Minimum Stay Requirements Analysis
Distribution of Listings by Minimum Night Requirement
1 Night
19 listings
50% of total
2 Nights
10 listings
26.3% of total
3 Nights
1 listings
2.6% of total
7-29 Nights
2 listings
5.3% of total
30+ Nights
6 listings
15.8% of total
Key Insights
- The most prevalent minimum stay requirement in Huánuco is 1 Night, adopted by 50% of listings. This highlights the market's preference for shorter, flexible bookings.
- A strong majority (76.3%) of the Huánuco Airbnb data shows acceptance of very short stays (1-2 nights), indicating a dynamic, high-turnover market.
- A significant segment (15.8%) caters to monthly stays (30+ nights) in Huánuco, pointing to opportunities in the extended-stay market.
Recommendations
- Align with the market by considering a 1 Night minimum stay, as 50% of Huánuco hosts use this setting.
- Explore offering discounts for stays of 30+ nights to attract the 15.8% of the market seeking extended stays.
- Adjust minimum nights based on seasonality – potentially shorter during low season and longer during peak demand periods in Huánuco.
Huánuco Airbnb Cancellation Policy Trends Analysis (2026)
Limited
1 listings
2.6% of total
Flexible
29 listings
76.3% of total
Moderate
3 listings
7.9% of total
Firm
3 listings
7.9% of total
Strict
2 listings
5.3% of total
Cancellation Policy Insights for Huánuco
- The prevailing Airbnb cancellation policy trend in Huánuco is Flexible, used by 76.3% of listings.
- The market strongly favors guest-friendly terms, with 84.2% of listings offering Flexible or Moderate policies. This suggests guests in Huánuco may expect booking flexibility.
- Strict cancellation policies are quite rare (5.3%), potentially making listings with this policy less competitive unless justified by high demand or property type.
Recommendations for Hosts
- Consider adopting a Flexible policy to align with the 76.3% market standard in Huánuco.
- Given the high prevalence of Flexible policies (76.3%), offering this can enhance booking appeal, especially during shoulder seasons.
- Using a Strict policy might deter some guests, as only 5.3% of listings use it. Evaluate if potential revenue protection outweighs possible lower booking rates.
- Regularly review your cancellation policy against competitors and market demand shifts in Huánuco.
Huánuco STR Booking Lead Time Analysis (2026)
Average Booking Lead Time by Month
Booking Lead Time Insights for Huánuco
- The overall average booking lead time for vacation rentals in Huánuco is 10 days.
- Guests book furthest in advance for stays during August (average 17 days), likely coinciding with peak travel demand or local events.
- The shortest booking windows occur for stays in March (average 3 days), indicating more last-minute travel plans during this time.
- Seasonally, Summer (12 days avg.) sees the longest lead times, while Spring (6 days avg.) has the shortest, reflecting typical travel planning cycles.
Recommendations for Hosts
- Use the overall average lead time (10 days) as a baseline for your pricing and availability strategy in Huánuco.
- Target marketing efforts for the Summer season well in advance (at least 12 days) to capture early planners.
- Monitor your own booking lead times against these Huánuco averages to identify opportunities for dynamic pricing adjustments.
Popular & Essential Airbnb Amenities in Huánuco (2026)
Amenity Prevalence
Amenity Insights for Huánuco
- Essential amenities in Huánuco that guests expect include: TV, Wifi. Lacking these (any) could significantly impact bookings.
- Popular amenities like Kitchen, Hot water, Dedicated workspace are common but not universal. Offering these can provide a competitive edge.
Recommendations for Hosts
- Ensure your listing includes all essential amenities for Huánuco: TV, Wifi.
- Prioritize adding missing essentials: Wifi.
- Consider adding popular differentiators like Kitchen or Hot water to increase appeal.
- Highlight unique or less common amenities you offer (e.g., hot tub, dedicated workspace, EV charger) in your listing description and photos.
- Regularly check competitor amenities in Huánuco to stay competitive.
Huánuco Airbnb Guest Demographics & Profile Analysis (2026)
Guest Profile Summary for Huánuco
- The typical guest profile for Airbnb in Huánuco consists of primarily domestic travelers (86%), often arriving from nearby Lima, typically belonging to the Post-2000s (Gen Z/Alpha) group (50%), primarily speaking Spanish or English.
- Domestic travelers account for 86.1% of guests.
- Key international markets include Peru (86.1%) and United States (6.3%).
- Top languages spoken are Spanish (52.2%) followed by English (29.3%).
- A significant demographic segment is the Post-2000s (Gen Z/Alpha) group, representing 50% of guests.
Recommendations for Hosts
- Target domestic marketing efforts towards travelers from Lima and Lima Region.
- Tailor amenities and listing descriptions to appeal to the dominant Post-2000s (Gen Z/Alpha) demographic (e.g., highlight fast WiFi, smart home features, local guides).
- Highlight unique local experiences or amenities relevant to the primary guest profile.
- Consider seasonal promotions aligned with peak travel times for key origin markets.
Nearby Short-Term Rental Market Comparison
How does the Huánuco Airbnb market stack up against its neighbors? Compare key performance metrics like average monthly revenue, ADR, and occupancy rates in surrounding areas to understand the broader regional STR landscape.
| Market | Active Properties | Monthly Revenue | Daily Rate | Avg. Occupancy |
|---|---|---|---|---|
| Huancabamba | 41 | $436 | $100.39 | 22% |
| Chontabamba | 76 | $296 | $78.98 | 21% |
| Oxapampa | 273 | $230 | $64.90 | 22% |
| Barranca | 37 | $229 | $66.13 | 22% |
| Huaraz | 323 | $192 | $37.87 | 27% |
| Rupa-Rupa | 46 | $169 | $43.52 | 20% |
| Amarilis | 25 | $142 | $33.69 | 23% |
| Independencia | 120 | $130 | $40.78 | 23% |
| Carhuaz | 12 | $125 | $67.12 | 14% |
| Villa Rica | 29 | $90 | $45.95 | 15% |