Wanchaq Airbnb Market Analysis 2026: Short Term Rental Data & Vacation Rental Statistics in Cusco, Peru
Is Airbnb profitable in Wanchaq in 2026? Explore comprehensive Airbnb analytics for Wanchaq, Cusco, Peru to uncover income potential. This 2026 STR market report for Wanchaq, based on AirROI data from February 2025 to January 2026, reveals key trends in the market of 527 active listings.
Whether you're considering an Airbnb investment in Wanchaq, optimizing your existing vacation rental, or exploring rental arbitrage opportunities, understanding the Wanchaq Airbnb data is crucial. Leveraging the low regulation environment is key to maximizing your short term rental income potential. Let's dive into the specifics.
Key Wanchaq Airbnb Performance Metrics Overview
Monthly Airbnb Revenue Variations & Income Potential in Wanchaq (2026)
Understanding the monthly revenue variations for Airbnb listings in Wanchaq is key to maximizing your short term rental income potential. Seasonality significantly impacts earnings. Our analysis, based on data from the past 12 months, shows that the peak revenue month for STRs in Wanchaq is typically April, while January often presents the lowest earnings, highlighting opportunities for strategic pricing adjustments during shoulder and low seasons. Explore the typical Airbnb income in Wanchaq across different performance tiers:
- Best-in-class properties (Top 10%) achieve $1,314+ monthly, often utilizing dynamic pricing and superior guest experiences.
- Strong performing properties (Top 25%) earn $835 or more, indicating effective management and desirable locations/amenities.
- Typical properties (Median) generate around $386 per month, representing the average market performance.
- Entry-level properties (Bottom 25%) see earnings around $154, often with potential for optimization.
Average Monthly Airbnb Earnings Trend in Wanchaq
Wanchaq Airbnb Occupancy Rate Trends (2026)
Maximize your bookings by understanding the Wanchaq STR occupancy trends. Seasonal demand shifts significantly influence how often properties are booked. Typically, Aprilsees the highest demand (peak season occupancy), while January experiences the lowest (low season). Effective strategies, like adjusting minimum stays or offering promotions, can boost occupancy during slower periods. Here's how different property tiers perform in Wanchaq:
- Best-in-class properties (Top 10%) achieve 84%+ occupancy, indicating high desirability and potentially optimized availability.
- Strong performing properties (Top 25%) maintain 69% or higher occupancy, suggesting good market fit and guest satisfaction.
- Typical properties (Median) have an occupancy rate around 41%.
- Entry-level properties (Bottom 25%) average 18% occupancy, potentially facing higher vacancy.
Average Monthly Occupancy Rate Trend in Wanchaq
Average Daily Rate (ADR) Airbnb Trends in Wanchaq (2026)
Effective short term rental pricing strategy in Wanchaq involves understanding monthly ADR fluctuations. The Average Daily Rate (ADR) for Airbnb in Wanchaq typically peaks in December and dips lowest during February. Leveraging Airbnb dynamic pricing tools or strategies based on this seasonality can significantly boost revenue. Here's a look at the typical nightly rates achieved:
- Best-in-class properties (Top 10%) command rates of $66+ per night, often due to premium features or locations.
- Strong performing properties (Top 25%) achieve nightly rates of $44 or more.
- Typical properties (Median) charge around $31 per night.
- Entry-level properties (Bottom 25%) earn around $20 per night.
Average Daily Rate (ADR) Trend by Month in Wanchaq
Get Live Wanchaq Market Intelligence 👇

Explore Real-time Analytics
Airbnb Seasonality Analysis & Trends in Wanchaq (2026)
Peak Season (April, September, July)
- Revenue averages $679 per month
- Occupancy rates average 48.8%
- Daily rates average $38
Shoulder Season
- Revenue averages $605 per month
- Occupancy maintains around 44.5%
- Daily rates hold near $38
Low Season (January, February, December)
- Revenue drops to average $479 per month
- Occupancy decreases to average 37.7%
- Daily rates adjust to average $39
Seasonality Insights for Wanchaq
- The Airbnb seasonality in Wanchaq shows moderate seasonality with distinct peak and low periods. While the sections above show seasonal averages, it's also insightful to look at the extremes:
- During the high season, the absolute peak month showcases Wanchaq's highest earning potential, with monthly revenues capable of climbing to $687, occupancy reaching a high of 50.1%, and ADRs peaking at $42.
- Conversely, the slowest single month of the year, typically falling within the low season, marks the market's lowest point. In this month, revenue might dip to $432, occupancy could drop to 31.5%, and ADRs may adjust down to $35.
- Understanding both the seasonal averages and these monthly peaks and troughs in revenue, occupancy, and ADR is crucial for maximizing your Airbnb profit potential in Wanchaq.
Seasonal Strategies for Maximizing Profit
- Peak Season: Maximize revenue through premium pricing and potentially longer minimum stays. Ensure high availability.
- Low Season: Offer competitive pricing, special promotions (e.g., extended stay discounts), and flexible cancellation policies. Target off-season travelers like remote workers or budget-conscious guests.
- Shoulder Seasons: Implement dynamic pricing that balances peak and low rates. Target weekend travelers or specific events. Offer slightly more flexible terms than peak season.
- Regularly analyze your own performance against these Wanchaq seasonality benchmarks and adjust your pricing and availability strategy accordingly.
Best Areas for Airbnb Investment in Wanchaq (2026)
Exploring the top neighborhoods for short-term rentals in Wanchaq? This section highlights key areas, outlining why they are attractive for hosts and guests, along with notable local attractions. Consider these locations based on your target guest profile and investment strategy.
| Neighborhood / Area | Why Host Here? (Target Guests & Appeal) | Key Attractions & Landmarks |
|---|---|---|
| San Blas | Charming neighborhood known for its narrow streets, artisanal shops, and vibrant arts culture. A favorite among tourists for its unique character and proximity to the historical center of Cusco. | San Blas Church, Artisan Market, Saqsayhuamán, ChocoMuseum, Plaza de Armas |
| Plaza de Armas | The main square of Cusco, surrounded by historic buildings and popular restaurants. Ideal for travelers who want to be in the heart of the action and close to major attractions. | Cathedral of Cusco, Inca Museum, La Compania de Jesus, Korikancha, Plaza de Armas nightlife |
| Cusco City Center | The bustling center of Cusco, offering a mix of historical sites, dining, and shopping. Great location for tourists wanting to explore the city's rich culture and history. | Qorikancha, Museum of Pre-Columbian Art, Centro Qosqo de Arte Nativo, San Pedro Market, Catedral del Cusco |
| Saqsayhuamán | An archaeological site just above Cusco, known for its impressive stone structures. Attracts tourists interested in history and Inca architecture, with stunning views of the city. | Saqsayhuamán ruins, Puka Pukara, Qenqo, Templo de la Luna |
| Ollantaytambo | A picturesque Inca village and gateway to Machu Picchu. Offers historical significance and stunning landscapes, appealing to those looking for accommodations near the Sacred Valley. | Ollantaytambo Ruins, Sacred Valley, Pachar, Inca Trail |
| Pisac | Known for its traditional market and Incan ruins, Pisac is a popular destination in the Sacred Valley. Attracts visitors who are interested in local culture and stunning landscapes. | Pisac Archaeological Park, Pisac Market, Intihuatana Stone |
| Chinchero | Famous for its weaving community and archaeological sites. Offers a unique cultural experience and stunning views of the Andean mountains. | Chinchero Ruins, Weaving Workshops, Machu Picchu access |
| Urubamba | The heart of the Sacred Valley, providing access to multiple tourist sites and experiences. Known for its scenic beauty and adventure activities such as rafting. | Urubamba River, Maras Salt Mines, Chinchero, Hard Adventures |
Understanding Airbnb License Requirements & STR Laws in Wanchaq (2026)
While Wanchaq, Cusco, Peru currently shows low STR regulations, specific Airbnb license requirements might still exist or change. Always verify the latest short term rental regulations and Airbnb license requirements directly with local government authorities for Wanchaq to ensure full compliance before hosting.
(Source: AirROI data, 2026, based on 1% licensed listings)
Top Performing Airbnb Properties in Wanchaq (2026)
Benchmark your potential! Explore examples of top-performing Airbnb properties in Wanchaqbased on Trailing Twelve Month (TTM) revenue. Analyze their characteristics, revenue, occupancy rate, and ADR to understand what drives success in this market.
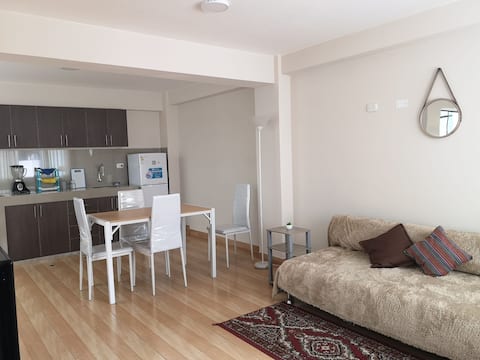
New Downtown Apartment in Cusco
Entire Place • 2 bedrooms
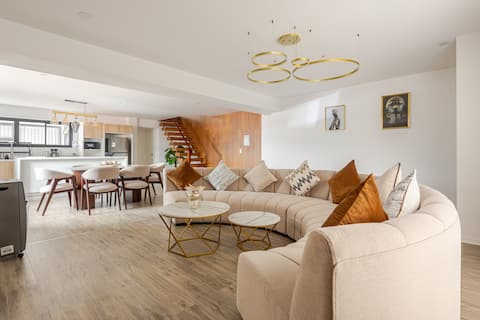
Spacious and centrally-located duplex for groups 4 bedrooms/4 bathrooms
Entire Place • 4 bedrooms

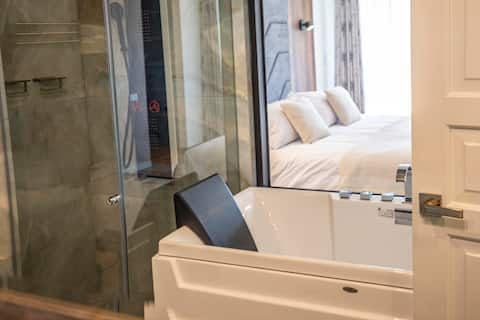
Duplex Suite with Pool, Jacuzzi, Sauna and Terrace
Entire Place • 4 bedrooms
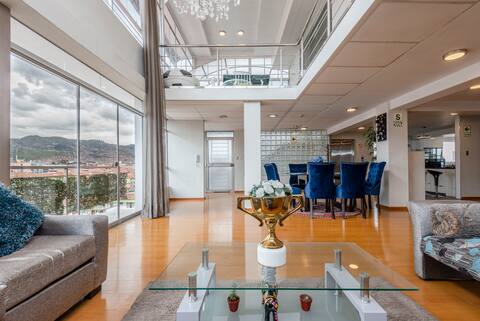
duplex apartment, very cozy with all the comforts.
Entire Place • 5 bedrooms

w* | Wonderful 2BR w/ Perfect Balcony in Cusco
Entire Place • 2 bedrooms
Dúplex moderno cerca del Centro Histórico
Entire Place • 3 bedrooms
Note: Performance varies based on location, size, amenities, seasonality, and management quality. Data reflects the past 12 months.
Top Performing Airbnb Hosts in Wanchaq (2026)
Learn from the best! This table showcases top-performing Airbnb hosts in Wanchaq based on the number of properties managed and estimated total revenue over the past year. Analyze their scale and performance metrics.
| Host Name | Properties | Grossing Revenue | Stay Reviews | Avg Rating |
|---|---|---|---|---|
| Rodrigo | 6 | $122,010 | 214 | 4.83/5.0 |
| Yīshā | 4 | $99,758 | 258 | 4.89/5.0 |
| Qoribnb | 5 | $86,708 | 376 | 4.89/5.0 |
| We Home | 7 | $63,526 | 281 | 4.83/5.0 |
| Denise | 4 | $62,931 | 268 | 4.97/5.0 |
| Sury | 4 | $62,398 | 146 | 4.79/5.0 |
| Nay Ruth | 32 | $52,215 | 1222 | 4.78/5.0 |
| Karla | 2 | $48,584 | 375 | 4.93/5.0 |
| Susana | 4 | $47,625 | 522 | 4.97/5.0 |
| Mariela | 2 | $47,388 | 610 | 4.84/5.0 |
Analyzing the strategies of top hosts, such as their property selection, pricing, and guest communication, can offer valuable lessons for optimizing your own Airbnb operations in Wanchaq.
Dive Deeper: Advanced Wanchaq STR Market Data (2026)
Ready to unlock more insights? AirROI provides access to advanced metrics and comprehensive Airbnb data for Wanchaq. Explore detailed analytics beyond this report to refine your investment strategy, optimize pricing, and maximize your vacation rental profits.
Explore Advanced MetricsWanchaq Short-Term Rental Market Composition (2026): Property & Room Types
Room Type Distribution
Property Type Distribution
Market Composition Insights for Wanchaq
- The Wanchaq Airbnb market composition is heavily skewed towards Entire Home/Apt listings, which make up 77.2% of the 527 active rentals. This indicates strong guest preference for privacy and space.
- Looking at the property type distribution in Wanchaq, Apartment/Condo properties are the most common (78.6%), reflecting the local real estate landscape.
- The presence of 9.9% Hotel/Boutique listings indicates integration with traditional hospitality.
Wanchaq Airbnb Room Capacity Analysis (2026): Bedroom Distribution
Distribution of Listings by Number of Bedrooms
Room Capacity Insights for Wanchaq
- The dominant room capacity in Wanchaq is 2 bedrooms listings, making up 27.9% of the market. This suggests a strong demand for properties suitable for couples or solo travelers.
- Together, 2 bedrooms and 1 bedroom properties represent 53.9% of the active Airbnb listings in Wanchaq, indicating a high concentration in these sizes.
- A significant 31.8% of listings offer 3+ bedrooms, catering to larger groups and families seeking more space in Wanchaq.
Wanchaq Vacation Rental Guest Capacity Trends (2026)
Distribution of Listings by Guest Capacity
Guest Capacity Insights for Wanchaq
- The most common guest capacity trend in Wanchaq vacation rentals is listings accommodating 4 guests (21.6%). This suggests the primary traveler segment is likely small families or groups.
- Properties designed for 4 guests and 2 guests dominate the Wanchaq STR market, accounting for 39.8% of listings.
- 24.9% of properties accommodate 6+ guests, serving the market segment for larger families or group travel in Wanchaq.
- On average, properties in Wanchaq are equipped to host 3.6 guests.
Wanchaq Airbnb Booking Patterns (2026): Available vs. Booked Days
Available Days Distribution
Booked Days Distribution
Booking Pattern Insights for Wanchaq
- The most common availability pattern in Wanchaq falls within the 271-366 days range, representing 53.9% of listings. This suggests many properties have significant open periods on their calendars.
- Approximately 75.7% of listings show high availability (181+ days open annually), indicating potential for increased bookings or specific owner usage patterns.
- For booked days, the 1-30 days range is most frequent in Wanchaq (30.2%), reflecting common guest stay durations or potential owner blocking patterns.
- A notable 25.2% of properties secure long booking periods (181+ days booked per year), highlighting successful long-term rental strategies or significant owner usage.
Wanchaq Airbnb Minimum Stay Requirements Analysis
Distribution of Listings by Minimum Night Requirement
1 Night
177 listings
33.6% of total
2 Nights
186 listings
35.3% of total
3 Nights
27 listings
5.1% of total
4-6 Nights
14 listings
2.7% of total
7-29 Nights
4 listings
0.8% of total
30+ Nights
119 listings
22.6% of total
Key Insights
- The most prevalent minimum stay requirement in Wanchaq is 2 Nights, adopted by 35.3% of listings. This highlights the market's preference for shorter, flexible bookings.
- A strong majority (68.9%) of the Wanchaq Airbnb data shows acceptance of very short stays (1-2 nights), indicating a dynamic, high-turnover market.
- A significant segment (22.6%) caters to monthly stays (30+ nights) in Wanchaq, pointing to opportunities in the extended-stay market.
Recommendations
- Align with the market by considering a 2 Nights minimum stay, as 35.3% of Wanchaq hosts use this setting.
- Explore offering discounts for stays of 30+ nights to attract the 22.6% of the market seeking extended stays.
- Adjust minimum nights based on seasonality – potentially shorter during low season and longer during peak demand periods in Wanchaq.
Wanchaq Airbnb Cancellation Policy Trends Analysis (2026)
Limited
6 listings
1.1% of total
Flexible
280 listings
53.1% of total
Moderate
132 listings
25% of total
Firm
87 listings
16.5% of total
Strict
22 listings
4.2% of total
Cancellation Policy Insights for Wanchaq
- The prevailing Airbnb cancellation policy trend in Wanchaq is Flexible, used by 53.1% of listings.
- The market strongly favors guest-friendly terms, with 78.1% of listings offering Flexible or Moderate policies. This suggests guests in Wanchaq may expect booking flexibility.
- Strict cancellation policies are quite rare (4.2%), potentially making listings with this policy less competitive unless justified by high demand or property type.
Recommendations for Hosts
- Consider adopting a Flexible policy to align with the 53.1% market standard in Wanchaq.
- Given the high prevalence of Flexible policies (53.1%), offering this can enhance booking appeal, especially during shoulder seasons.
- Using a Strict policy might deter some guests, as only 4.2% of listings use it. Evaluate if potential revenue protection outweighs possible lower booking rates.
- Regularly review your cancellation policy against competitors and market demand shifts in Wanchaq.
Wanchaq STR Booking Lead Time Analysis (2026)
Average Booking Lead Time by Month
Booking Lead Time Insights for Wanchaq
- The overall average booking lead time for vacation rentals in Wanchaq is 25 days.
- Guests book furthest in advance for stays during August (average 35 days), likely coinciding with peak travel demand or local events.
- The shortest booking windows occur for stays in February (average 16 days), indicating more last-minute travel plans during this time.
- Seasonally, Summer (33 days avg.) sees the longest lead times, while Winter (25 days avg.) has the shortest, reflecting typical travel planning cycles.
Recommendations for Hosts
- Use the overall average lead time (25 days) as a baseline for your pricing and availability strategy in Wanchaq.
- Target marketing efforts for the Summer season well in advance (at least 33 days) to capture early planners.
- Monitor your own booking lead times against these Wanchaq averages to identify opportunities for dynamic pricing adjustments.
Popular & Essential Airbnb Amenities in Wanchaq (2026)
Amenity Prevalence
Amenity Insights for Wanchaq
- Essential amenities in Wanchaq that guests expect include: Wifi. Lacking these (this) could significantly impact bookings.
- Popular amenities like TV, Hot water, Kitchen are common but not universal. Offering these can provide a competitive edge.
Recommendations for Hosts
- Ensure your listing includes all essential amenities for Wanchaq: Wifi.
- Prioritize adding missing essentials: Wifi.
- Consider adding popular differentiators like TV or Hot water to increase appeal.
- Highlight unique or less common amenities you offer (e.g., hot tub, dedicated workspace, EV charger) in your listing description and photos.
- Regularly check competitor amenities in Wanchaq to stay competitive.
Wanchaq Airbnb Guest Demographics & Profile Analysis (2026)
Guest Profile Summary for Wanchaq
- The typical guest profile for Airbnb in Wanchaq consists of predominantly international visitors (83%), with top international origins including Peru, typically belonging to the Post-2000s (Gen Z/Alpha) group (50%), primarily speaking English or Spanish.
- Domestic travelers account for 16.6% of guests.
- Key international markets include United States (28.7%) and Peru (16.6%).
- Top languages spoken are English (42.1%) followed by Spanish (29.6%).
- A significant demographic segment is the Post-2000s (Gen Z/Alpha) group, representing 50% of guests.
Recommendations for Hosts
- Focus marketing internationally, particularly towards travelers from Peru.
- Tailor amenities and listing descriptions to appeal to the dominant Post-2000s (Gen Z/Alpha) demographic (e.g., highlight fast WiFi, smart home features, local guides).
- Highlight unique local experiences or amenities relevant to the primary guest profile.
- Consider seasonal promotions aligned with peak travel times for key origin markets.
Nearby Short-Term Rental Market Comparison
How does the Wanchaq Airbnb market stack up against its neighbors? Compare key performance metrics like average monthly revenue, ADR, and occupancy rates in surrounding areas to understand the broader regional STR landscape.
| Market | Active Properties | Monthly Revenue | Daily Rate | Avg. Occupancy |
|---|---|---|---|---|
| Lamay | 14 | $1,098 | $95.76 | 38% |
| Huayllabamba | 50 | $1,082 | $138.65 | 30% |
| Calca | 107 | $693 | $106.76 | 33% |
| Urubamba | 232 | $539 | $86.78 | 27% |
| Maras | 18 | $476 | $66.95 | 22% |
| Taray | 14 | $475 | $64.21 | 41% |
| Distrito de Cusco | 2,111 | $424 | $41.51 | 40% |
| San Salvador | 21 | $362 | $57.07 | 36% |
| Pisac | 180 | $354 | $42.42 | 33% |
| Cusco | 259 | $333 | $41.23 | 40% |