Urubamba Airbnb Market Analysis 2026: Short Term Rental Data & Vacation Rental Statistics in Cusco, Peru
Is Airbnb profitable in Urubamba in 2026? Explore comprehensive Airbnb analytics for Urubamba, Cusco, Peru to uncover income potential. This 2026 STR market report for Urubamba, based on AirROI data from February 2025 to January 2026, reveals key trends in the market of 232 active listings.
Whether you're considering an Airbnb investment in Urubamba, optimizing your existing vacation rental, or exploring rental arbitrage opportunities, understanding the Urubamba Airbnb data is crucial. Leveraging the low regulation environment is key to maximizing your short term rental income potential. Let's dive into the specifics.
Key Urubamba Airbnb Performance Metrics Overview
Monthly Airbnb Revenue Variations & Income Potential in Urubamba (2026)
Understanding the monthly revenue variations for Airbnb listings in Urubamba is key to maximizing your short term rental income potential. Seasonality significantly impacts earnings. Our analysis, based on data from the past 12 months, shows that the peak revenue month for STRs in Urubamba is typically July, while January often presents the lowest earnings, highlighting opportunities for strategic pricing adjustments during shoulder and low seasons. Explore the typical Airbnb income in Urubamba across different performance tiers:
- Best-in-class properties (Top 10%) achieve $2,147+ monthly, often utilizing dynamic pricing and superior guest experiences.
- Strong performing properties (Top 25%) earn $1,016 or more, indicating effective management and desirable locations/amenities.
- Typical properties (Median) generate around $443 per month, representing the average market performance.
- Entry-level properties (Bottom 25%) see earnings around $172, often with potential for optimization.
Average Monthly Airbnb Earnings Trend in Urubamba
Urubamba Airbnb Occupancy Rate Trends (2026)
Maximize your bookings by understanding the Urubamba STR occupancy trends. Seasonal demand shifts significantly influence how often properties are booked. Typically, Julysees the highest demand (peak season occupancy), while January experiences the lowest (low season). Effective strategies, like adjusting minimum stays or offering promotions, can boost occupancy during slower periods. Here's how different property tiers perform in Urubamba:
- Best-in-class properties (Top 10%) achieve 67%+ occupancy, indicating high desirability and potentially optimized availability.
- Strong performing properties (Top 25%) maintain 45% or higher occupancy, suggesting good market fit and guest satisfaction.
- Typical properties (Median) have an occupancy rate around 24%.
- Entry-level properties (Bottom 25%) average 12% occupancy, potentially facing higher vacancy.
Average Monthly Occupancy Rate Trend in Urubamba
Average Daily Rate (ADR) Airbnb Trends in Urubamba (2026)
Effective short term rental pricing strategy in Urubamba involves understanding monthly ADR fluctuations. The Average Daily Rate (ADR) for Airbnb in Urubamba typically peaks in September and dips lowest during March. Leveraging Airbnb dynamic pricing tools or strategies based on this seasonality can significantly boost revenue. Here's a look at the typical nightly rates achieved:
- Best-in-class properties (Top 10%) command rates of $176+ per night, often due to premium features or locations.
- Strong performing properties (Top 25%) achieve nightly rates of $92 or more.
- Typical properties (Median) charge around $46 per night.
- Entry-level properties (Bottom 25%) earn around $28 per night.
Average Daily Rate (ADR) Trend by Month in Urubamba
Get Live Urubamba Market Intelligence 👇

Explore Real-time Analytics
Airbnb Seasonality Analysis & Trends in Urubamba (2026)
Peak Season (July, March, October)
- Revenue averages $1,030 per month
- Occupancy rates average 33.9%
- Daily rates average $78
Shoulder Season
- Revenue averages $885 per month
- Occupancy maintains around 30.4%
- Daily rates hold near $79
Low Season (January, February, November)
- Revenue drops to average $763 per month
- Occupancy decreases to average 28.7%
- Daily rates adjust to average $78
Seasonality Insights for Urubamba
- The Airbnb seasonality in Urubamba shows moderate seasonality with distinct peak and low periods. While the sections above show seasonal averages, it's also insightful to look at the extremes:
- During the high season, the absolute peak month showcases Urubamba's highest earning potential, with monthly revenues capable of climbing to $1,111, occupancy reaching a high of 35.7%, and ADRs peaking at $83.
- Conversely, the slowest single month of the year, typically falling within the low season, marks the market's lowest point. In this month, revenue might dip to $689, occupancy could drop to 23.8%, and ADRs may adjust down to $75.
- Understanding both the seasonal averages and these monthly peaks and troughs in revenue, occupancy, and ADR is crucial for maximizing your Airbnb profit potential in Urubamba.
Seasonal Strategies for Maximizing Profit
- Peak Season: Maximize revenue through premium pricing and potentially longer minimum stays. Ensure high availability.
- Low Season: Offer competitive pricing, special promotions (e.g., extended stay discounts), and flexible cancellation policies. Target off-season travelers like remote workers or budget-conscious guests.
- Shoulder Seasons: Implement dynamic pricing that balances peak and low rates. Target weekend travelers or specific events. Offer slightly more flexible terms than peak season.
- Regularly analyze your own performance against these Urubamba seasonality benchmarks and adjust your pricing and availability strategy accordingly.
Best Areas for Airbnb Investment in Urubamba (2026)
Exploring the top neighborhoods for short-term rentals in Urubamba? This section highlights key areas, outlining why they are attractive for hosts and guests, along with notable local attractions. Consider these locations based on your target guest profile and investment strategy.
| Neighborhood / Area | Why Host Here? (Target Guests & Appeal) | Key Attractions & Landmarks |
|---|---|---|
| Urubamba Centro | The heart of Urubamba, offering access to local markets, restaurants, and cultural activities. Ideal for tourists wanting to experience the local lifestyle and close proximity to attractions. | Urubamba Market, Plaza de Armas, Local Eateries, Cultural Events, Scenic Views |
| Ollantaytambo | A historic town known for its Incan ruins and proximity to the Sacred Valley. Popular with tourists who want to explore ancient sites and the Inca Trail. | Ollantaytambo Ruins, Inca Trail Access, Pisaq Market, Scenic Train to Aguas Calientes, Temple of the Sun |
| Písac | Famous for its archaeological sites and vibrant artisan market. Attracts visitors looking for crafts, culture, and stunning mountain views. | Písac Ruins, Písac Market, Artisan Workshops, Sacred Valley Views, Hiking Trails |
| Chinchero | A small town known for its traditional weaving and Incan ruins. A quieter alternative that offers authentic experiences and stunning landscapes. | Chinchero Ruins, Traditional Weaving Workshops, Beautiful Landscapes, Cultural Experiences, Local Festivals |
| Santa Teresa | Gateway to Machu Picchu and hot springs, popular among adventure seekers and nature lovers. Great for tourists looking to explore the region's natural beauty. | Machu Picchu Access, Colca River Hot Springs, Trekking Opportunities, Scenic Landscapes, Adventurous Activities |
| Maras | Known for its picturesque salt mines and Incan ruins, Maras is ideal for tourists looking for unique sights and cultural experiences. | Moray Agricultural Terraces, Maras Salt Mines, Inka Farm, Scenic Views, Local Cuisine |
| Lares | Famous for its hot springs and traditional village communities, great for travelers seeking relaxation and cultural immersion. | Lares Hot Springs, Traditional Communities, Trekking Routes, Natural Beauty, Cultural Interactions |
| Machupicchu Pueblo | The nearest town to Machu Picchu, making it essential for tourists visiting the iconic site. Offers multiple accommodations and services for travelers. | Machupicchu Entrance, Aguas Calientes Hot Springs, Machu Picchu Town Square, Dining Options, Shops and Markets |
Understanding Airbnb License Requirements & STR Laws in Urubamba (2026)
While Urubamba, Cusco, Peru currently shows low STR regulations, specific Airbnb license requirements might still exist or change. Always verify the latest short term rental regulations and Airbnb license requirements directly with local government authorities for Urubamba to ensure full compliance before hosting.
(Source: AirROI data, 2026, based on 1% licensed listings)
Top Performing Airbnb Properties in Urubamba (2026)
Benchmark your potential! Explore examples of top-performing Airbnb properties in Urubambabased on Trailing Twelve Month (TTM) revenue. Analyze their characteristics, revenue, occupancy rate, and ADR to understand what drives success in this market.

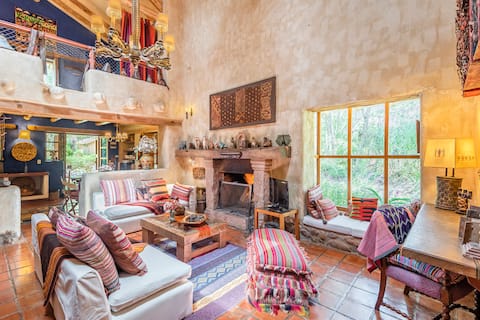
NUNA Andean Luxury GuestHouse (Urubamba, Cusco)
Entire Place • 5 bedrooms
Andean charming house
Entire Place • 4 bedrooms

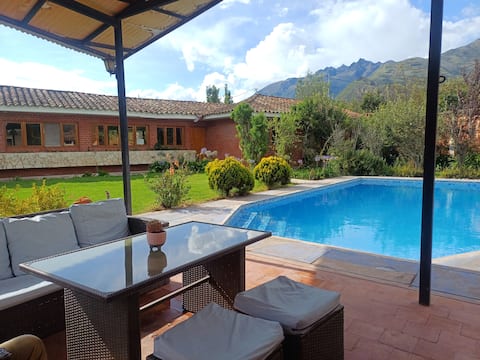
Exclusive Andean Villa Incl. Breakfast & Cleaning
Entire Place • 4 bedrooms

Villa Runa, Sacred Valley / Cusco
Entire Place • 4 bedrooms
Tierra Bella - Country House
Entire Place • 4 bedrooms
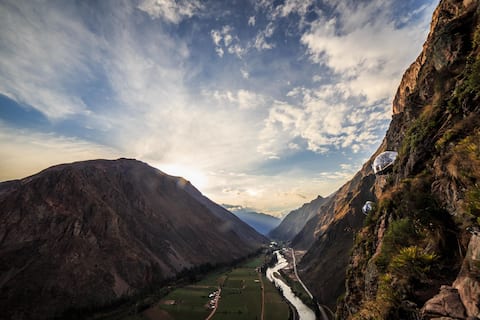
Skylodge Adventure Suites
Private Room • 1 bedroom
Note: Performance varies based on location, size, amenities, seasonality, and management quality. Data reflects the past 12 months.
Top Performing Airbnb Hosts in Urubamba (2026)
Learn from the best! This table showcases top-performing Airbnb hosts in Urubamba based on the number of properties managed and estimated total revenue over the past year. Analyze their scale and performance metrics.
| Host Name | Properties | Grossing Revenue | Stay Reviews | Avg Rating |
|---|---|---|---|---|
| Jacqueline | 1 | $108,175 | 38 | 4.92/5.0 |
| Teresa | 1 | $61,688 | 99 | 5.00/5.0 |
| Ia Sl | 1 | $61,675 | 213 | 4.92/5.0 |
| Aderly | 6 | $56,524 | 504 | 4.90/5.0 |
| Viviana | 1 | $53,101 | 64 | 4.97/5.0 |
| Hanan Pacha Lodge | 2 | $52,518 | 25 | 4.97/5.0 |
| Natalia | 2 | $52,473 | 316 | 4.96/5.0 |
| Carlos | 1 | $41,625 | 63 | 4.97/5.0 |
| Klau | 6 | $40,653 | 190 | 4.99/5.0 |
| Enrique | 1 | $37,619 | 102 | 4.83/5.0 |
Analyzing the strategies of top hosts, such as their property selection, pricing, and guest communication, can offer valuable lessons for optimizing your own Airbnb operations in Urubamba.
Dive Deeper: Advanced Urubamba STR Market Data (2026)
Ready to unlock more insights? AirROI provides access to advanced metrics and comprehensive Airbnb data for Urubamba. Explore detailed analytics beyond this report to refine your investment strategy, optimize pricing, and maximize your vacation rental profits.
Explore Advanced MetricsUrubamba Short-Term Rental Market Composition (2026): Property & Room Types
Room Type Distribution
Property Type Distribution
Market Composition Insights for Urubamba
- The Urubamba Airbnb market composition is heavily skewed towards Entire Home/Apt listings, which make up 68.1% of the 232 active rentals. This indicates strong guest preference for privacy and space.
- However, a notable 31.9% share for Private Rooms suggests opportunities for budget-conscious travelers or hosts renting out spare rooms.
- Looking at the property type distribution in Urubamba, House properties are the most common (59.9%), reflecting the local real estate landscape.
- Houses represent a significant 59.9% portion, catering likely to families or larger groups.
- The presence of 12.1% Hotel/Boutique listings indicates integration with traditional hospitality.
- Smaller segments like others, unique stays (combined 2.1%) offer potential for unique stay experiences.
Urubamba Airbnb Room Capacity Analysis (2026): Bedroom Distribution
Distribution of Listings by Number of Bedrooms
Room Capacity Insights for Urubamba
- The dominant room capacity in Urubamba is 1 bedroom listings, making up 28.9% of the market. This suggests a strong demand for properties suitable for couples or solo travelers.
- Together, 1 bedroom and 2 bedrooms properties represent 45.7% of the active Airbnb listings in Urubamba, indicating a high concentration in these sizes.
- A significant 37.9% of listings offer 3+ bedrooms, catering to larger groups and families seeking more space in Urubamba.
Urubamba Vacation Rental Guest Capacity Trends (2026)
Distribution of Listings by Guest Capacity
Guest Capacity Insights for Urubamba
- The most common guest capacity trend in Urubamba vacation rentals is listings accommodating 8+ guests (27.6%). This suggests the primary traveler segment is likely larger groups.
- Properties designed for 8+ guests and 2 guests dominate the Urubamba STR market, accounting for 48.3% of listings.
- 39.3% of properties accommodate 6+ guests, serving the market segment for larger families or group travel in Urubamba.
- On average, properties in Urubamba are equipped to host 4.2 guests.
Urubamba Airbnb Booking Patterns (2026): Available vs. Booked Days
Available Days Distribution
Booked Days Distribution
Booking Pattern Insights for Urubamba
- The most common availability pattern in Urubamba falls within the 271-366 days range, representing 70.7% of listings. This suggests many properties have significant open periods on their calendars.
- Approximately 93.5% of listings show high availability (181+ days open annually), indicating potential for increased bookings or specific owner usage patterns.
- For booked days, the 1-30 days range is most frequent in Urubamba (39.2%), reflecting common guest stay durations or potential owner blocking patterns.
- A notable 6.9% of properties secure long booking periods (181+ days booked per year), highlighting successful long-term rental strategies or significant owner usage.
Urubamba Airbnb Minimum Stay Requirements Analysis
Distribution of Listings by Minimum Night Requirement
1 Night
111 listings
47.8% of total
2 Nights
51 listings
22% of total
3 Nights
6 listings
2.6% of total
4-6 Nights
3 listings
1.3% of total
30+ Nights
61 listings
26.3% of total
Key Insights
- The most prevalent minimum stay requirement in Urubamba is 1 Night, adopted by 47.8% of listings. This highlights the market's preference for shorter, flexible bookings.
- A strong majority (69.8%) of the Urubamba Airbnb data shows acceptance of very short stays (1-2 nights), indicating a dynamic, high-turnover market.
- A significant segment (26.3%) caters to monthly stays (30+ nights) in Urubamba, pointing to opportunities in the extended-stay market.
Recommendations
- Align with the market by considering a 1 Night minimum stay, as 47.8% of Urubamba hosts use this setting.
- Explore offering discounts for stays of 30+ nights to attract the 26.3% of the market seeking extended stays.
- Adjust minimum nights based on seasonality – potentially shorter during low season and longer during peak demand periods in Urubamba.
Urubamba Airbnb Cancellation Policy Trends Analysis (2026)
Limited
1 listings
0.4% of total
Flexible
101 listings
43.7% of total
Moderate
55 listings
23.8% of total
Firm
53 listings
22.9% of total
Strict
21 listings
9.1% of total
Cancellation Policy Insights for Urubamba
- The prevailing Airbnb cancellation policy trend in Urubamba is Flexible, used by 43.7% of listings.
- There's a relatively balanced mix between guest-friendly (67.5%) and stricter (32.0%) policies, offering choices for different guest needs.
- Strict cancellation policies are quite rare (9.1%), potentially making listings with this policy less competitive unless justified by high demand or property type.
Recommendations for Hosts
- Consider adopting a Flexible policy to align with the 43.7% market standard in Urubamba.
- Using a Strict policy might deter some guests, as only 9.1% of listings use it. Evaluate if potential revenue protection outweighs possible lower booking rates.
- Regularly review your cancellation policy against competitors and market demand shifts in Urubamba.
Urubamba STR Booking Lead Time Analysis (2026)
Average Booking Lead Time by Month
Booking Lead Time Insights for Urubamba
- The overall average booking lead time for vacation rentals in Urubamba is 34 days.
- Guests book furthest in advance for stays during November (average 47 days), likely coinciding with peak travel demand or local events.
- The shortest booking windows occur for stays in February (average 27 days), indicating more last-minute travel plans during this time.
- Seasonally, Fall (43 days avg.) sees the longest lead times, while Winter (31 days avg.) has the shortest, reflecting typical travel planning cycles.
Recommendations for Hosts
- Use the overall average lead time (34 days) as a baseline for your pricing and availability strategy in Urubamba.
- For November stays, consider implementing length-of-stay discounts or slightly higher rates for bookings made less than 47 days out to capitalize on advance planning.
- Target marketing efforts for the Fall season well in advance (at least 43 days) to capture early planners.
- Monitor your own booking lead times against these Urubamba averages to identify opportunities for dynamic pricing adjustments.
Popular & Essential Airbnb Amenities in Urubamba (2026)
Amenity Prevalence
Amenity Insights for Urubamba
- Essential amenities in Urubamba that guests expect include: Wifi. Lacking these (this) could significantly impact bookings.
- Popular amenities like Hot water, Kitchen, Free parking on premises are common but not universal. Offering these can provide a competitive edge.
Recommendations for Hosts
- Ensure your listing includes all essential amenities for Urubamba: Wifi.
- Prioritize adding missing essentials: Wifi.
- Consider adding popular differentiators like Hot water or Kitchen to increase appeal.
- Highlight unique or less common amenities you offer (e.g., hot tub, dedicated workspace, EV charger) in your listing description and photos.
- Regularly check competitor amenities in Urubamba to stay competitive.
Urubamba Airbnb Guest Demographics & Profile Analysis (2026)
Guest Profile Summary for Urubamba
- The typical guest profile for Airbnb in Urubamba consists of predominantly international visitors (74%), with top international origins including Peru, typically belonging to the Post-2000s (Gen Z/Alpha) group (50%), primarily speaking English or Spanish.
- Domestic travelers account for 26.4% of guests.
- Key international markets include United States (36.4%) and Peru (26.4%).
- Top languages spoken are English (44.1%) followed by Spanish (31.7%).
- A significant demographic segment is the Post-2000s (Gen Z/Alpha) group, representing 50% of guests.
Recommendations for Hosts
- Focus marketing internationally, particularly towards travelers from Peru.
- Tailor amenities and listing descriptions to appeal to the dominant Post-2000s (Gen Z/Alpha) demographic (e.g., highlight fast WiFi, smart home features, local guides).
- Highlight unique local experiences or amenities relevant to the primary guest profile.
- Consider seasonal promotions aligned with peak travel times for key origin markets.
Nearby Short-Term Rental Market Comparison
How does the Urubamba Airbnb market stack up against its neighbors? Compare key performance metrics like average monthly revenue, ADR, and occupancy rates in surrounding areas to understand the broader regional STR landscape.
| Market | Active Properties | Monthly Revenue | Daily Rate | Avg. Occupancy |
|---|---|---|---|---|
| Lamay | 14 | $1,098 | $95.76 | 38% |
| Huayllabamba | 50 | $1,082 | $138.65 | 30% |
| Calca | 107 | $693 | $106.76 | 33% |
| Maras | 18 | $476 | $66.95 | 22% |
| Taray | 14 | $475 | $64.21 | 41% |
| Distrito de Cusco | 2,111 | $424 | $41.51 | 40% |
| Wanchaq | 527 | $392 | $39.04 | 38% |
| San Salvador | 21 | $362 | $57.07 | 36% |
| Pisac | 180 | $354 | $42.42 | 33% |
| Cusco | 259 | $333 | $41.23 | 40% |