Santiago Airbnb Market Analysis 2026: Short Term Rental Data & Vacation Rental Statistics in Cusco, Peru
Is Airbnb profitable in Santiago in 2026? Explore comprehensive Airbnb analytics for Santiago, Cusco, Peru to uncover income potential. This 2026 STR market report for Santiago, based on AirROI data from February 2025 to January 2026, reveals key trends in the niche market of 179 active listings.
Whether you're considering an Airbnb investment in Santiago, optimizing your existing vacation rental, or exploring rental arbitrage opportunities, understanding the Santiago Airbnb data is crucial. Leveraging the low regulation environment is key to maximizing your short term rental income potential. Let's dive into the specifics.
Key Santiago Airbnb Performance Metrics Overview
Monthly Airbnb Revenue Variations & Income Potential in Santiago (2026)
Understanding the monthly revenue variations for Airbnb listings in Santiago is key to maximizing your short term rental income potential. Seasonality significantly impacts earnings. Our analysis, based on data from the past 12 months, shows that the peak revenue month for STRs in Santiago is typically July, while January often presents the lowest earnings, highlighting opportunities for strategic pricing adjustments during shoulder and low seasons. Explore the typical Airbnb income in Santiago across different performance tiers:
- Best-in-class properties (Top 10%) achieve $952+ monthly, often utilizing dynamic pricing and superior guest experiences.
- Strong performing properties (Top 25%) earn $556 or more, indicating effective management and desirable locations/amenities.
- Typical properties (Median) generate around $287 per month, representing the average market performance.
- Entry-level properties (Bottom 25%) see earnings around $145, often with potential for optimization.
Average Monthly Airbnb Earnings Trend in Santiago
Santiago Airbnb Occupancy Rate Trends (2026)
Maximize your bookings by understanding the Santiago STR occupancy trends. Seasonal demand shifts significantly influence how often properties are booked. Typically, Julysees the highest demand (peak season occupancy), while January experiences the lowest (low season). Effective strategies, like adjusting minimum stays or offering promotions, can boost occupancy during slower periods. Here's how different property tiers perform in Santiago:
- Best-in-class properties (Top 10%) achieve 79%+ occupancy, indicating high desirability and potentially optimized availability.
- Strong performing properties (Top 25%) maintain 62% or higher occupancy, suggesting good market fit and guest satisfaction.
- Typical properties (Median) have an occupancy rate around 34%.
- Entry-level properties (Bottom 25%) average 17% occupancy, potentially facing higher vacancy.
Average Monthly Occupancy Rate Trend in Santiago
Average Daily Rate (ADR) Airbnb Trends in Santiago (2026)
Effective short term rental pricing strategy in Santiago involves understanding monthly ADR fluctuations. The Average Daily Rate (ADR) for Airbnb in Santiago typically peaks in September and dips lowest during March. Leveraging Airbnb dynamic pricing tools or strategies based on this seasonality can significantly boost revenue. Here's a look at the typical nightly rates achieved:
- Best-in-class properties (Top 10%) command rates of $63+ per night, often due to premium features or locations.
- Strong performing properties (Top 25%) achieve nightly rates of $44 or more.
- Typical properties (Median) charge around $30 per night.
- Entry-level properties (Bottom 25%) earn around $20 per night.
Average Daily Rate (ADR) Trend by Month in Santiago
Get Live Santiago Market Intelligence 👇

Explore Real-time Analytics
Airbnb Seasonality Analysis & Trends in Santiago (2026)
Peak Season (July, April, June)
- Revenue averages $563 per month
- Occupancy rates average 44.7%
- Daily rates average $37
Shoulder Season
- Revenue averages $460 per month
- Occupancy maintains around 40.3%
- Daily rates hold near $38
Low Season (January, February, December)
- Revenue drops to average $343 per month
- Occupancy decreases to average 32.7%
- Daily rates adjust to average $38
Seasonality Insights for Santiago
- The Airbnb seasonality in Santiago shows moderate seasonality with distinct peak and low periods. While the sections above show seasonal averages, it's also insightful to look at the extremes:
- During the high season, the absolute peak month showcases Santiago's highest earning potential, with monthly revenues capable of climbing to $605, occupancy reaching a high of 47.5%, and ADRs peaking at $40.
- Conversely, the slowest single month of the year, typically falling within the low season, marks the market's lowest point. In this month, revenue might dip to $326, occupancy could drop to 28.0%, and ADRs may adjust down to $35.
- Understanding both the seasonal averages and these monthly peaks and troughs in revenue, occupancy, and ADR is crucial for maximizing your Airbnb profit potential in Santiago.
Seasonal Strategies for Maximizing Profit
- Peak Season: Maximize revenue through premium pricing and potentially longer minimum stays. Ensure high availability.
- Low Season: Offer competitive pricing, special promotions (e.g., extended stay discounts), and flexible cancellation policies. Target off-season travelers like remote workers or budget-conscious guests.
- Shoulder Seasons: Implement dynamic pricing that balances peak and low rates. Target weekend travelers or specific events. Offer slightly more flexible terms than peak season.
- Regularly analyze your own performance against these Santiago seasonality benchmarks and adjust your pricing and availability strategy accordingly.
Best Areas for Airbnb Investment in Santiago (2026)
Exploring the top neighborhoods for short-term rentals in Santiago? This section highlights key areas, outlining why they are attractive for hosts and guests, along with notable local attractions. Consider these locations based on your target guest profile and investment strategy.
| Neighborhood / Area | Why Host Here? (Target Guests & Appeal) | Key Attractions & Landmarks |
|---|---|---|
| Barranco | Known for its bohemian atmosphere, vibrant arts scene, and ocean views, Barranco is a favorite among tourists looking for cultural experiences and nightlife. | Barranco's Bridge of Sighs, The Mario Testino Museum, La Ermita, Plaza de Barranco, Local art galleries |
| Miraflores | A bustling district popular with tourists for its parks, beaches, and lively cultural scene. Known for its affluence and safe environment, it attracts both leisure and business travelers. | Larcomar Shopping Center, Parque Kennedy, Miraflores Malecon, Huaca Pucllana, Plaza Mayor |
| Cusco Historic Center | The historic heart of Cusco, a UNESCO World Heritage site, is full of colonial architecture and rich Incan history, making it a top destination for history enthusiasts and tourists. | Sacsayhuamán, Plaza de Armas, Qorikancha, Cusco Cathedral, Inca Trail |
| San Blas, Cusco | A quaint bohemian neighborhood known for its artsy shops and stunning viewpoints. Attractions include better-preserved Incan architecture and proximity to major tourist sites. | San Blas Church, Artisan Market, Nust'a Spa, Viewpoints, Pictorial streets |
| Punta Sal | A stunning beach destination on the north coast of Peru primarily frequented by travelers seeking relaxation and water activities. It features luxury beachfront properties. | Punta Sal Beach, Nature Reserve, Water sports, Luxury resorts, Sunset views |
| Sacsayhuamán | An impressive Inca archaeological site located just outside Cusco. Popular among tourists for its historical significance and breathtaking views of Cusco. | Sacsayhuamán ruins, Views of Cusco, Incan stone walls, Archaeological tours, Temple of the Moon |
| Nunoa | A family-friendly neighborhood in Santiago, known for its parks and communal spaces. Attracts tourists looking for local experiences away from the crowded tourist areas. | Plaza Nunoa, Nunoa Market, Local cafes, Museo de la Solidaridad, Street art |
| Providencia | An upscale district known for its shopping, dining, and proximity to business hotels. A prime area for those conducting business or wanting to experience Santiago's urban life. | Costanera Center, Los Dominicos Park, Santiago Metropolitan Park, Shopping malls, Restaurants |
Understanding Airbnb License Requirements & STR Laws in Santiago (2026)
While Santiago, Cusco, Peru currently shows low STR regulations, specific Airbnb license requirements might still exist or change. Always verify the latest short term rental regulations and Airbnb license requirements directly with local government authorities for Santiago to ensure full compliance before hosting.
(Source: AirROI data, 2026, finding no licensed listings among those analyzed)
Top Performing Airbnb Properties in Santiago (2026)
Benchmark your potential! Explore examples of top-performing Airbnb properties in Santiagobased on Trailing Twelve Month (TTM) revenue. Analyze their characteristics, revenue, occupancy rate, and ADR to understand what drives success in this market.
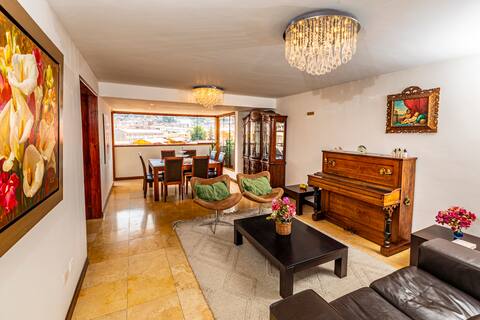
Cozy and spacious house with a beautiful view
Entire Place • 3 bedrooms

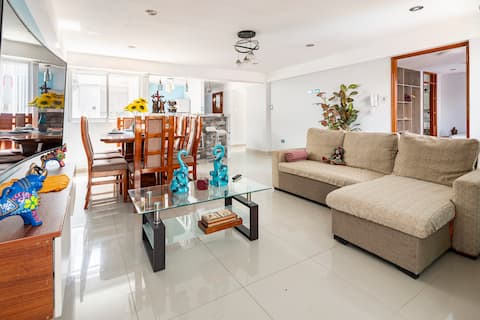
Independent house for tourists and groups in Cusco
Entire Place • 6 bedrooms
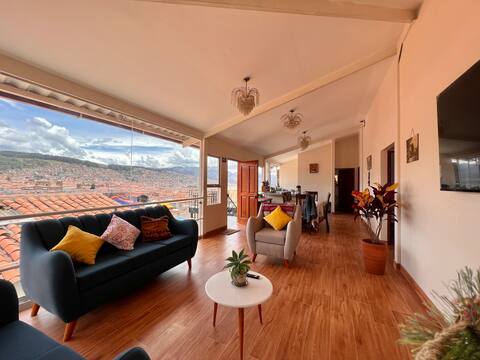
Nice apartment in the historic center of Cusco
Entire Place • 3 bedrooms

Cusco Casa Kantu accommodation
Entire Place • 6 bedrooms
Charming apartment with a hot tub
Entire Place • 5 bedrooms

M° | Ninnaf cozy house close historic center cusco
Private Room • 2 bedrooms
Note: Performance varies based on location, size, amenities, seasonality, and management quality. Data reflects the past 12 months.
Top Performing Airbnb Hosts in Santiago (2026)
Learn from the best! This table showcases top-performing Airbnb hosts in Santiago based on the number of properties managed and estimated total revenue over the past year. Analyze their scale and performance metrics.
| Host Name | Properties | Grossing Revenue | Stay Reviews | Avg Rating |
|---|---|---|---|---|
| Inka View Apartment | 2 | $40,616 | 178 | 4.94/5.0 |
| Anali Priscila | 1 | $37,761 | 96 | 4.88/5.0 |
| Cesar | 5 | $31,000 | 50 | 4.95/5.0 |
| Soledad | 8 | $28,296 | 816 | 4.74/5.0 |
| Rolando | 5 | $27,150 | 262 | 4.85/5.0 |
| Denisse | 6 | $26,402 | 280 | 4.78/5.0 |
| Mariella | 1 | $23,459 | 103 | 4.83/5.0 |
| Marcos Oswaldo | 1 | $20,683 | 91 | 4.87/5.0 |
| Fabián Andrés | 1 | $20,496 | 59 | 4.93/5.0 |
| Muña | 3 | $15,534 | 846 | 4.77/5.0 |
Analyzing the strategies of top hosts, such as their property selection, pricing, and guest communication, can offer valuable lessons for optimizing your own Airbnb operations in Santiago.
Dive Deeper: Advanced Santiago STR Market Data (2026)
Ready to unlock more insights? AirROI provides access to advanced metrics and comprehensive Airbnb data for Santiago. Explore detailed analytics beyond this report to refine your investment strategy, optimize pricing, and maximize your vacation rental profits.
Explore Advanced MetricsSantiago Short-Term Rental Market Composition (2026): Property & Room Types
Room Type Distribution
Property Type Distribution
Market Composition Insights for Santiago
- The Santiago Airbnb market composition is heavily skewed towards Entire Home/Apt listings, which make up 70.4% of the 179 active rentals. This indicates strong guest preference for privacy and space.
- Looking at the property type distribution in Santiago, Apartment/Condo properties are the most common (77.7%), reflecting the local real estate landscape.
- The presence of 6.1% Hotel/Boutique listings indicates integration with traditional hospitality.
- Smaller segments like outdoor/unique, others (combined 1.7%) offer potential for unique stay experiences.
Santiago Airbnb Room Capacity Analysis (2026): Bedroom Distribution
Distribution of Listings by Number of Bedrooms
Room Capacity Insights for Santiago
- The dominant room capacity in Santiago is 3 bedrooms listings, making up 26.3% of the market. This suggests a strong demand for properties suitable for families or small groups.
- Together, 3 bedrooms and 2 bedrooms properties represent 50.3% of the active Airbnb listings in Santiago, indicating a high concentration in these sizes.
- A significant 38.6% of listings offer 3+ bedrooms, catering to larger groups and families seeking more space in Santiago.
Santiago Vacation Rental Guest Capacity Trends (2026)
Distribution of Listings by Guest Capacity
Guest Capacity Insights for Santiago
- The most common guest capacity trend in Santiago vacation rentals is listings accommodating 4 guests (20.7%). This suggests the primary traveler segment is likely small families or groups.
- Properties designed for 4 guests and 6 guests dominate the Santiago STR market, accounting for 38.0% of listings.
- 34.1% of properties accommodate 6+ guests, serving the market segment for larger families or group travel in Santiago.
- On average, properties in Santiago are equipped to host 4.0 guests.
Santiago Airbnb Booking Patterns (2026): Available vs. Booked Days
Available Days Distribution
Booked Days Distribution
Booking Pattern Insights for Santiago
- The most common availability pattern in Santiago falls within the 271-366 days range, representing 60.3% of listings. This suggests many properties have significant open periods on their calendars.
- Approximately 84.3% of listings show high availability (181+ days open annually), indicating potential for increased bookings or specific owner usage patterns.
- For booked days, the 1-30 days range is most frequent in Santiago (32.4%), reflecting common guest stay durations or potential owner blocking patterns.
- A notable 17.4% of properties secure long booking periods (181+ days booked per year), highlighting successful long-term rental strategies or significant owner usage.
Santiago Airbnb Minimum Stay Requirements Analysis
Distribution of Listings by Minimum Night Requirement
1 Night
61 listings
34.1% of total
2 Nights
59 listings
33% of total
3 Nights
20 listings
11.2% of total
4-6 Nights
3 listings
1.7% of total
30+ Nights
36 listings
20.1% of total
Key Insights
- The most prevalent minimum stay requirement in Santiago is 1 Night, adopted by 34.1% of listings. This highlights the market's preference for shorter, flexible bookings.
- A strong majority (67.1%) of the Santiago Airbnb data shows acceptance of very short stays (1-2 nights), indicating a dynamic, high-turnover market.
- A significant segment (20.1%) caters to monthly stays (30+ nights) in Santiago, pointing to opportunities in the extended-stay market.
Recommendations
- Align with the market by considering a 1 Night minimum stay, as 34.1% of Santiago hosts use this setting.
- Explore offering discounts for stays of 30+ nights to attract the 20.1% of the market seeking extended stays.
- Adjust minimum nights based on seasonality – potentially shorter during low season and longer during peak demand periods in Santiago.
Santiago Airbnb Cancellation Policy Trends Analysis (2026)
Limited
1 listings
0.6% of total
Flexible
101 listings
56.7% of total
Moderate
38 listings
21.3% of total
Firm
31 listings
17.4% of total
Strict
7 listings
3.9% of total
Cancellation Policy Insights for Santiago
- The prevailing Airbnb cancellation policy trend in Santiago is Flexible, used by 56.7% of listings.
- The market strongly favors guest-friendly terms, with 78.0% of listings offering Flexible or Moderate policies. This suggests guests in Santiago may expect booking flexibility.
- Strict cancellation policies are quite rare (3.9%), potentially making listings with this policy less competitive unless justified by high demand or property type.
Recommendations for Hosts
- Consider adopting a Flexible policy to align with the 56.7% market standard in Santiago.
- Given the high prevalence of Flexible policies (56.7%), offering this can enhance booking appeal, especially during shoulder seasons.
- Using a Strict policy might deter some guests, as only 3.9% of listings use it. Evaluate if potential revenue protection outweighs possible lower booking rates.
- Regularly review your cancellation policy against competitors and market demand shifts in Santiago.
Santiago STR Booking Lead Time Analysis (2026)
Average Booking Lead Time by Month
Booking Lead Time Insights for Santiago
- The overall average booking lead time for vacation rentals in Santiago is 23 days.
- Guests book furthest in advance for stays during July (average 32 days), likely coinciding with peak travel demand or local events.
- The shortest booking windows occur for stays in March (average 12 days), indicating more last-minute travel plans during this time.
- Seasonally, Summer (30 days avg.) sees the longest lead times, while Spring (21 days avg.) has the shortest, reflecting typical travel planning cycles.
Recommendations for Hosts
- Use the overall average lead time (23 days) as a baseline for your pricing and availability strategy in Santiago.
- During March, focus on last-minute booking availability and promotions, as guests book with very short notice (12 days avg.).
- Target marketing efforts for the Summer season well in advance (at least 30 days) to capture early planners.
- Monitor your own booking lead times against these Santiago averages to identify opportunities for dynamic pricing adjustments.
Popular & Essential Airbnb Amenities in Santiago (2026)
Amenity Prevalence
Amenity Insights for Santiago
- Essential amenities in Santiago that guests expect include: Wifi. Lacking these (this) could significantly impact bookings.
- Popular amenities like TV, Kitchen, Hot water are common but not universal. Offering these can provide a competitive edge.
Recommendations for Hosts
- Ensure your listing includes all essential amenities for Santiago: Wifi.
- Prioritize adding missing essentials: Wifi.
- Consider adding popular differentiators like TV or Kitchen to increase appeal.
- Highlight unique or less common amenities you offer (e.g., hot tub, dedicated workspace, EV charger) in your listing description and photos.
- Regularly check competitor amenities in Santiago to stay competitive.
Santiago Airbnb Guest Demographics & Profile Analysis (2026)
Guest Profile Summary for Santiago
- The typical guest profile for Airbnb in Santiago consists of predominantly international visitors (79%), with top international origins including United States, typically belonging to the Post-2000s (Gen Z/Alpha) group (50%), primarily speaking English or Spanish.
- Domestic travelers account for 21.0% of guests.
- Key international markets include Peru (21%) and United States (18.9%).
- Top languages spoken are English (38.8%) followed by Spanish (34.6%).
- A significant demographic segment is the Post-2000s (Gen Z/Alpha) group, representing 50% of guests.
Recommendations for Hosts
- Focus marketing internationally, particularly towards travelers from United States.
- Tailor amenities and listing descriptions to appeal to the dominant Post-2000s (Gen Z/Alpha) demographic (e.g., highlight fast WiFi, smart home features, local guides).
- Highlight unique local experiences or amenities relevant to the primary guest profile.
- Consider seasonal promotions aligned with peak travel times for key origin markets.
Nearby Short-Term Rental Market Comparison
How does the Santiago Airbnb market stack up against its neighbors? Compare key performance metrics like average monthly revenue, ADR, and occupancy rates in surrounding areas to understand the broader regional STR landscape.
| Market | Active Properties | Monthly Revenue | Daily Rate | Avg. Occupancy |
|---|---|---|---|---|
| Lamay | 14 | $1,098 | $95.76 | 38% |
| Huayllabamba | 50 | $1,082 | $138.65 | 30% |
| Calca | 107 | $693 | $106.76 | 33% |
| Urubamba | 232 | $539 | $86.78 | 27% |
| Maras | 18 | $476 | $66.95 | 22% |
| Taray | 14 | $475 | $64.21 | 41% |
| Distrito de Cusco | 2,111 | $424 | $41.51 | 40% |
| Wanchaq | 527 | $392 | $39.04 | 38% |
| San Salvador | 21 | $362 | $57.07 | 36% |
| Pisac | 180 | $354 | $42.42 | 33% |