San Salvador Airbnb Market Analysis 2026: Short Term Rental Data & Vacation Rental Statistics in Cusco, Peru
Is Airbnb profitable in San Salvador in 2026? Explore comprehensive Airbnb analytics for San Salvador, Cusco, Peru to uncover income potential. This 2026 STR market report for San Salvador, based on AirROI data from February 2025 to January 2026, reveals key trends in the niche market of 21 active listings.
Whether you're considering an Airbnb investment in San Salvador, optimizing your existing vacation rental, or exploring rental arbitrage opportunities, understanding the San Salvador Airbnb data is crucial. Leveraging the low regulation environment is key to maximizing your short term rental income potential. Let's dive into the specifics.
Key San Salvador Airbnb Performance Metrics Overview
Monthly Airbnb Revenue Variations & Income Potential in San Salvador (2026)
Understanding the monthly revenue variations for Airbnb listings in San Salvador is key to maximizing your short term rental income potential. Seasonality significantly impacts earnings. Our analysis, based on data from the past 12 months, shows that the peak revenue month for STRs in San Salvador is typically February, while December often presents the lowest earnings, highlighting opportunities for strategic pricing adjustments during shoulder and low seasons. Explore the typical Airbnb income in San Salvador across different performance tiers:
- Best-in-class properties (Top 10%) achieve $1,105+ monthly, often utilizing dynamic pricing and superior guest experiences.
- Strong performing properties (Top 25%) earn $760 or more, indicating effective management and desirable locations/amenities.
- Typical properties (Median) generate around $372 per month, representing the average market performance.
- Entry-level properties (Bottom 25%) see earnings around $180, often with potential for optimization.
Average Monthly Airbnb Earnings Trend in San Salvador
San Salvador Airbnb Occupancy Rate Trends (2026)
Maximize your bookings by understanding the San Salvador STR occupancy trends. Seasonal demand shifts significantly influence how often properties are booked. Typically, Marchsees the highest demand (peak season occupancy), while December experiences the lowest (low season). Effective strategies, like adjusting minimum stays or offering promotions, can boost occupancy during slower periods. Here's how different property tiers perform in San Salvador:
- Best-in-class properties (Top 10%) achieve 71%+ occupancy, indicating high desirability and potentially optimized availability.
- Strong performing properties (Top 25%) maintain 52% or higher occupancy, suggesting good market fit and guest satisfaction.
- Typical properties (Median) have an occupancy rate around 29%.
- Entry-level properties (Bottom 25%) average 15% occupancy, potentially facing higher vacancy.
Average Monthly Occupancy Rate Trend in San Salvador
Average Daily Rate (ADR) Airbnb Trends in San Salvador (2026)
Effective short term rental pricing strategy in San Salvador involves understanding monthly ADR fluctuations. The Average Daily Rate (ADR) for Airbnb in San Salvador typically peaks in December and dips lowest during February. Leveraging Airbnb dynamic pricing tools or strategies based on this seasonality can significantly boost revenue. Here's a look at the typical nightly rates achieved:
- Best-in-class properties (Top 10%) command rates of $99+ per night, often due to premium features or locations.
- Strong performing properties (Top 25%) achieve nightly rates of $75 or more.
- Typical properties (Median) charge around $50 per night.
- Entry-level properties (Bottom 25%) earn around $32 per night.
Average Daily Rate (ADR) Trend by Month in San Salvador
Get Live San Salvador Market Intelligence 👇

Explore Real-time Analytics
Airbnb Seasonality Analysis & Trends in San Salvador (2026)
Peak Season (February, March, August)
- Revenue averages $735 per month
- Occupancy rates average 46.8%
- Daily rates average $54
Shoulder Season
- Revenue averages $567 per month
- Occupancy maintains around 37.2%
- Daily rates hold near $56
Low Season (January, October, December)
- Revenue drops to average $319 per month
- Occupancy decreases to average 23.5%
- Daily rates adjust to average $57
Seasonality Insights for San Salvador
- The Airbnb seasonality in San Salvador shows highly seasonal trends requiring careful strategy. While the sections above show seasonal averages, it's also insightful to look at the extremes:
- During the high season, the absolute peak month showcases San Salvador's highest earning potential, with monthly revenues capable of climbing to $744, occupancy reaching a high of 53.6%, and ADRs peaking at $57.
- Conversely, the slowest single month of the year, typically falling within the low season, marks the market's lowest point. In this month, revenue might dip to $283, occupancy could drop to 18.6%, and ADRs may adjust down to $52.
- Understanding both the seasonal averages and these monthly peaks and troughs in revenue, occupancy, and ADR is crucial for maximizing your Airbnb profit potential in San Salvador.
Seasonal Strategies for Maximizing Profit
- Peak Season: Maximize revenue through premium pricing and potentially longer minimum stays. Ensure high availability.
- Low Season: Offer competitive pricing, special promotions (e.g., extended stay discounts), and flexible cancellation policies. Target off-season travelers like remote workers or budget-conscious guests.
- Shoulder Seasons: Implement dynamic pricing that balances peak and low rates. Target weekend travelers or specific events. Offer slightly more flexible terms than peak season.
- Regularly analyze your own performance against these San Salvador seasonality benchmarks and adjust your pricing and availability strategy accordingly.
Best Areas for Airbnb Investment in San Salvador (2026)
Exploring the top neighborhoods for short-term rentals in San Salvador? This section highlights key areas, outlining why they are attractive for hosts and guests, along with notable local attractions. Consider these locations based on your target guest profile and investment strategy.
| Neighborhood / Area | Why Host Here? (Target Guests & Appeal) | Key Attractions & Landmarks |
|---|---|---|
| Historic Center | The Historic Center of Cusco is a UNESCO World Heritage Site filled with colonial architecture and Incan history. It's a major draw for tourists exploring ancient civilizations. | Plaza de Armas, Sacsayhuamán, Cusco Cathedral, Qorikancha, San Blas District |
| San Blas | Known for its artistic vibe and cobblestone streets, San Blas is a lively neighborhood with bohemian charm, popular for its arts and craft shops. | San Blas Church, artisan shops, local markets, Mirador de San Blas, Plaza San Blas |
| Cusco Region | The wider Cusco Region offers access to stunning natural landscapes and is the gateway to attractions like Machu Picchu, making it highly attractive to adventure tourists. | Machu Picchu, Sacred Valley, Rainbow Mountain, Inca Trail, Qenko |
| Santo Domingo | Central yet quiet, Santo Domingo offers easy access to main attractions and is known for its colonial churches and gardens. | Qorikancha Temple, Jardín de la Virgen, local restaurants, Plaza de Armas |
| Ollantaytambo | A charming town located in the Sacred Valley, Ollantaytambo is close to ancient ruins and serves as a jumping-off point for Machu Picchu. | Ollantaytambo ruins, Inca terraces, local markets, Urubamba River |
| Pisaq | Pisaq is famous for its market and Inca ruins. It attracts visitors looking for local culture and history, making it a great area for hosting. | Pisaq Ruins, Pisaq Market, Sacred Valley views, local handicrafts |
| Chinchero | Chinchero is known for its traditional weaving and cultural significance. It appeals to tourists interested in authentic Peruvian experiences. | Chinchero Market, Inca ruins, traditional weaving demonstrations, beautiful Andean landscapes |
| Tambomachay | An important archaeological site and known for its Incan water channels, Tambomachay attracts history enthusiasts and nature lovers. | Tambomachay ruins, water channels, scenic trails, photographic opportunities |
Understanding Airbnb License Requirements & STR Laws in San Salvador (2026)
While San Salvador, Cusco, Peru currently shows low STR regulations, specific Airbnb license requirements might still exist or change. Always verify the latest short term rental regulations and Airbnb license requirements directly with local government authorities for San Salvador to ensure full compliance before hosting.
(Source: AirROI data, 2026, finding no licensed listings among those analyzed)
Top Performing Airbnb Properties in San Salvador (2026)
Benchmark your potential! Explore examples of top-performing Airbnb properties in San Salvadorbased on Trailing Twelve Month (TTM) revenue. Analyze their characteristics, revenue, occupancy rate, and ADR to understand what drives success in this market.
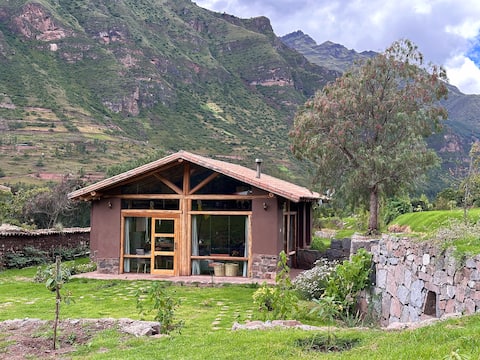
Sara Wasi Bungalow Suite
Entire Place • 2 bedrooms

Beautiful nest in the mountains with fireplace
Entire Place • 1 bedroom
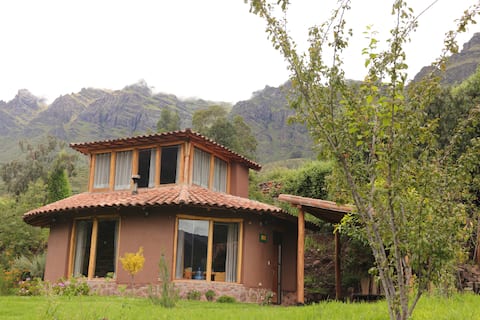
Suite Bungalow the sacred valley Inti Wasi
Entire Place • 1 bedroom
Chaska Wasi Sacred Valley Bungalow Suite
Entire Place • 1 bedroom

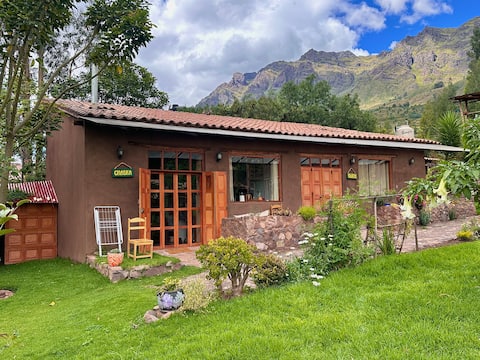
Cheerful 1-bedroom home with indoor fireplace
Entire Place • 1 bedroom

Dome house in the Sacred Valley
Entire Place • 1 bedroom
Note: Performance varies based on location, size, amenities, seasonality, and management quality. Data reflects the past 12 months.
Top Performing Airbnb Hosts in San Salvador (2026)
Learn from the best! This table showcases top-performing Airbnb hosts in San Salvador based on the number of properties managed and estimated total revenue over the past year. Analyze their scale and performance metrics.
| Host Name | Properties | Grossing Revenue | Stay Reviews | Avg Rating |
|---|---|---|---|---|
| Uchumuca | 5 | $28,652 | 137 | 4.99/5.0 |
| Sasaba | 3 | $18,509 | 39 | 4.96/5.0 |
| Lea | 4 | $16,439 | 117 | 4.95/5.0 |
| Milagros | 2 | $9,606 | 171 | 4.81/5.0 |
| Paqo | 2 | $6,908 | 46 | 4.87/5.0 |
| Carla | 1 | $6,559 | 65 | 4.89/5.0 |
| Erick | 1 | $1,857 | 5 | 5.00/5.0 |
| Roxana | 2 | $1,655 | 5 | 4.50/5.0 |
| Arda | 1 | $1,007 | 2 | Not Rated |
Analyzing the strategies of top hosts, such as their property selection, pricing, and guest communication, can offer valuable lessons for optimizing your own Airbnb operations in San Salvador.
Dive Deeper: Advanced San Salvador STR Market Data (2026)
Ready to unlock more insights? AirROI provides access to advanced metrics and comprehensive Airbnb data for San Salvador. Explore detailed analytics beyond this report to refine your investment strategy, optimize pricing, and maximize your vacation rental profits.
Explore Advanced MetricsSan Salvador Short-Term Rental Market Composition (2026): Property & Room Types
Room Type Distribution
Property Type Distribution
Market Composition Insights for San Salvador
- The San Salvador Airbnb market composition is heavily skewed towards Entire Home/Apt listings, which make up 76.2% of the 21 active rentals. This indicates strong guest preference for privacy and space.
- Looking at the property type distribution in San Salvador, House properties are the most common (61.9%), reflecting the local real estate landscape.
- Houses represent a significant 61.9% portion, catering likely to families or larger groups.
- Smaller segments like unique stays (combined 4.8%) offer potential for unique stay experiences.
San Salvador Airbnb Room Capacity Analysis (2026): Bedroom Distribution
Distribution of Listings by Number of Bedrooms
Room Capacity Insights for San Salvador
- The dominant room capacity in San Salvador is 1 bedroom listings, making up 61.9% of the market. This suggests a strong demand for properties suitable for couples or solo travelers.
- Together, 1 bedroom and 3 bedrooms properties represent 76.2% of the active Airbnb listings in San Salvador, indicating a high concentration in these sizes.
- With over half the market (61.9%) consisting of studios or 1-bedroom units, San Salvador is particularly well-suited for individuals or couples.
- A significant 23.8% of listings offer 3+ bedrooms, catering to larger groups and families seeking more space in San Salvador.
San Salvador Vacation Rental Guest Capacity Trends (2026)
Distribution of Listings by Guest Capacity
Guest Capacity Insights for San Salvador
- The most common guest capacity trend in San Salvador vacation rentals is listings accommodating 2 guests (57.1%). This suggests the primary traveler segment is likely couples or solo travelers.
- Properties designed for 2 guests and 8+ guests dominate the San Salvador STR market, accounting for 71.4% of listings.
- A significant 57.1% of listings cater specifically to 1-2 guests, highlighting strong demand from couples and solo travelers in San Salvador.
- 28.6% of properties accommodate 6+ guests, serving the market segment for larger families or group travel in San Salvador.
- On average, properties in San Salvador are equipped to host 3.5 guests.
San Salvador Airbnb Booking Patterns (2026): Available vs. Booked Days
Available Days Distribution
Booked Days Distribution
Booking Pattern Insights for San Salvador
- The most common availability pattern in San Salvador falls within the 271-366 days range, representing 47.6% of listings. This suggests many properties have significant open periods on their calendars.
- Approximately 90.5% of listings show high availability (181+ days open annually), indicating potential for increased bookings or specific owner usage patterns.
- For booked days, the 91-180 days range is most frequent in San Salvador (42.9%), reflecting common guest stay durations or potential owner blocking patterns.
- A notable 9.5% of properties secure long booking periods (181+ days booked per year), highlighting successful long-term rental strategies or significant owner usage.
San Salvador Airbnb Minimum Stay Requirements Analysis
Distribution of Listings by Minimum Night Requirement
1 Night
3 listings
14.3% of total
2 Nights
10 listings
47.6% of total
3 Nights
8 listings
38.1% of total
Key Insights
- The most prevalent minimum stay requirement in San Salvador is 2 Nights, adopted by 47.6% of listings. This highlights the market's preference for shorter, flexible bookings.
- A strong majority (61.9%) of the San Salvador Airbnb data shows acceptance of very short stays (1-2 nights), indicating a dynamic, high-turnover market.
Recommendations
- Align with the market by considering a 2 Nights minimum stay, as 47.6% of San Salvador hosts use this setting.
- If feasible, allowing 1-night stays, especially midweek or during low season, could capture last-minute bookings, as only 14.3% currently do.
- A 2-night minimum appears standard (47.6%). Consider this for weekends or peak periods.
- Adjust minimum nights based on seasonality – potentially shorter during low season and longer during peak demand periods in San Salvador.
San Salvador Airbnb Cancellation Policy Trends Analysis (2026)
Flexible
1 listings
4.8% of total
Moderate
10 listings
47.6% of total
Firm
9 listings
42.9% of total
Strict
1 listings
4.8% of total
Cancellation Policy Insights for San Salvador
- The prevailing Airbnb cancellation policy trend in San Salvador is Moderate, used by 47.6% of listings.
- There's a relatively balanced mix between guest-friendly (52.4%) and stricter (47.7%) policies, offering choices for different guest needs.
- Strict cancellation policies are quite rare (4.8%), potentially making listings with this policy less competitive unless justified by high demand or property type.
Recommendations for Hosts
- Consider adopting a Moderate policy to align with the 47.6% market standard in San Salvador.
- Using a Strict policy might deter some guests, as only 4.8% of listings use it. Evaluate if potential revenue protection outweighs possible lower booking rates.
- Regularly review your cancellation policy against competitors and market demand shifts in San Salvador.
San Salvador STR Booking Lead Time Analysis (2026)
Average Booking Lead Time by Month
Booking Lead Time Insights for San Salvador
- The overall average booking lead time for vacation rentals in San Salvador is 29 days.
- Guests book furthest in advance for stays during May (average 43 days), likely coinciding with peak travel demand or local events.
- The shortest booking windows occur for stays in February (average 16 days), indicating more last-minute travel plans during this time.
- Seasonally, Spring (37 days avg.) sees the longest lead times, while Winter (26 days avg.) has the shortest, reflecting typical travel planning cycles.
Recommendations for Hosts
- Use the overall average lead time (29 days) as a baseline for your pricing and availability strategy in San Salvador.
- For May stays, consider implementing length-of-stay discounts or slightly higher rates for bookings made less than 43 days out to capitalize on advance planning.
- Target marketing efforts for the Spring season well in advance (at least 37 days) to capture early planners.
- Monitor your own booking lead times against these San Salvador averages to identify opportunities for dynamic pricing adjustments.
Popular & Essential Airbnb Amenities in San Salvador (2026)
Amenity Prevalence
Amenity Insights for San Salvador
- Essential amenities in San Salvador that guests expect include: Wifi, Hot water. Lacking these (any) could significantly impact bookings.
- Popular amenities like Long term stays allowed, Kitchen, Free parking on premises are common but not universal. Offering these can provide a competitive edge.
Recommendations for Hosts
- Ensure your listing includes all essential amenities for San Salvador: Wifi, Hot water.
- Prioritize adding missing essentials: Hot water.
- Consider adding popular differentiators like Long term stays allowed or Kitchen to increase appeal.
- Highlight unique or less common amenities you offer (e.g., hot tub, dedicated workspace, EV charger) in your listing description and photos.
- Regularly check competitor amenities in San Salvador to stay competitive.
San Salvador Airbnb Guest Demographics & Profile Analysis (2026)
Guest Profile Summary for San Salvador
- The typical guest profile for Airbnb in San Salvador consists of predominantly international visitors (87%), with top international origins including Canada, typically belonging to the Post-2000s (Gen Z/Alpha) group (50%), primarily speaking English or Spanish.
- Domestic travelers account for 12.7% of guests.
- Key international markets include United States (34.9%) and Canada (17.5%).
- Top languages spoken are English (49.3%) followed by Spanish (24.6%).
- A significant demographic segment is the Post-2000s (Gen Z/Alpha) group, representing 50% of guests.
Recommendations for Hosts
- Focus marketing internationally, particularly towards travelers from Canada.
- Tailor amenities and listing descriptions to appeal to the dominant Post-2000s (Gen Z/Alpha) demographic (e.g., highlight fast WiFi, smart home features, local guides).
- Highlight unique local experiences or amenities relevant to the primary guest profile.
- Consider seasonal promotions aligned with peak travel times for key origin markets.
Nearby Short-Term Rental Market Comparison
How does the San Salvador Airbnb market stack up against its neighbors? Compare key performance metrics like average monthly revenue, ADR, and occupancy rates in surrounding areas to understand the broader regional STR landscape.
| Market | Active Properties | Monthly Revenue | Daily Rate | Avg. Occupancy |
|---|---|---|---|---|
| Lamay | 14 | $1,098 | $95.76 | 38% |
| Huayllabamba | 50 | $1,082 | $138.65 | 30% |
| Calca | 107 | $693 | $106.76 | 33% |
| Urubamba | 232 | $539 | $86.78 | 27% |
| Maras | 18 | $476 | $66.95 | 22% |
| Taray | 14 | $475 | $64.21 | 41% |
| Distrito de Cusco | 2,111 | $424 | $41.51 | 40% |
| Wanchaq | 527 | $392 | $39.04 | 38% |
| Pisac | 180 | $354 | $42.42 | 33% |
| Cusco | 259 | $333 | $41.23 | 40% |