Los Baños del Inca Airbnb Market Analysis 2026: Short Term Rental Data & Vacation Rental Statistics in Cajamarca, Peru
Is Airbnb profitable in Los Baños del Inca in 2026? Explore comprehensive Airbnb analytics for Los Baños del Inca, Cajamarca, Peru to uncover income potential. This 2026 STR market report for Los Baños del Inca, based on AirROI data from February 2025 to January 2026, reveals key trends in the niche market of 60 active listings.
Whether you're considering an Airbnb investment in Los Baños del Inca, optimizing your existing vacation rental, or exploring rental arbitrage opportunities, understanding the Los Baños del Inca Airbnb data is crucial. Leveraging the low regulation environment is key to maximizing your short term rental income potential. Let's dive into the specifics.
Key Los Baños del Inca Airbnb Performance Metrics Overview
Monthly Airbnb Revenue Variations & Income Potential in Los Baños del Inca (2026)
Understanding the monthly revenue variations for Airbnb listings in Los Baños del Inca is key to maximizing your short term rental income potential. Seasonality significantly impacts earnings. Our analysis, based on data from the past 12 months, shows that the peak revenue month for STRs in Los Baños del Inca is typically June, while May often presents the lowest earnings, highlighting opportunities for strategic pricing adjustments during shoulder and low seasons. Explore the typical Airbnb income in Los Baños del Inca across different performance tiers:
- Best-in-class properties (Top 10%) achieve $886+ monthly, often utilizing dynamic pricing and superior guest experiences.
- Strong performing properties (Top 25%) earn $473 or more, indicating effective management and desirable locations/amenities.
- Typical properties (Median) generate around $247 per month, representing the average market performance.
- Entry-level properties (Bottom 25%) see earnings around $114, often with potential for optimization.
Average Monthly Airbnb Earnings Trend in Los Baños del Inca
Los Baños del Inca Airbnb Occupancy Rate Trends (2026)
Maximize your bookings by understanding the Los Baños del Inca STR occupancy trends. Seasonal demand shifts significantly influence how often properties are booked. Typically, Augustsees the highest demand (peak season occupancy), while November experiences the lowest (low season). Effective strategies, like adjusting minimum stays or offering promotions, can boost occupancy during slower periods. Here's how different property tiers perform in Los Baños del Inca:
- Best-in-class properties (Top 10%) achieve 49%+ occupancy, indicating high desirability and potentially optimized availability.
- Strong performing properties (Top 25%) maintain 33% or higher occupancy, suggesting good market fit and guest satisfaction.
- Typical properties (Median) have an occupancy rate around 17%.
- Entry-level properties (Bottom 25%) average 9% occupancy, potentially facing higher vacancy.
Average Monthly Occupancy Rate Trend in Los Baños del Inca
Average Daily Rate (ADR) Airbnb Trends in Los Baños del Inca (2026)
Effective short term rental pricing strategy in Los Baños del Inca involves understanding monthly ADR fluctuations. The Average Daily Rate (ADR) for Airbnb in Los Baños del Inca typically peaks in February and dips lowest during May. Leveraging Airbnb dynamic pricing tools or strategies based on this seasonality can significantly boost revenue. Here's a look at the typical nightly rates achieved:
- Best-in-class properties (Top 10%) command rates of $113+ per night, often due to premium features or locations.
- Strong performing properties (Top 25%) achieve nightly rates of $61 or more.
- Typical properties (Median) charge around $37 per night.
- Entry-level properties (Bottom 25%) earn around $27 per night.
Average Daily Rate (ADR) Trend by Month in Los Baños del Inca
Get Live Los Baños del Inca Market Intelligence 👇

Explore Real-time Analytics
Airbnb Seasonality Analysis & Trends in Los Baños del Inca (2026)
Peak Season (June, March, October)
- Revenue averages $464 per month
- Occupancy rates average 24.6%
- Daily rates average $56
Shoulder Season
- Revenue averages $386 per month
- Occupancy maintains around 25.1%
- Daily rates hold near $56
Low Season (January, May, November)
- Revenue drops to average $280 per month
- Occupancy decreases to average 17.8%
- Daily rates adjust to average $55
Seasonality Insights for Los Baños del Inca
- The Airbnb seasonality in Los Baños del Inca shows moderate seasonality with distinct peak and low periods. While the sections above show seasonal averages, it's also insightful to look at the extremes:
- During the high season, the absolute peak month showcases Los Baños del Inca's highest earning potential, with monthly revenues capable of climbing to $490, occupancy reaching a high of 33.8%, and ADRs peaking at $65.
- Conversely, the slowest single month of the year, typically falling within the low season, marks the market's lowest point. In this month, revenue might dip to $267, occupancy could drop to 15.9%, and ADRs may adjust down to $52.
- Understanding both the seasonal averages and these monthly peaks and troughs in revenue, occupancy, and ADR is crucial for maximizing your Airbnb profit potential in Los Baños del Inca.
Seasonal Strategies for Maximizing Profit
- Peak Season: Maximize revenue through premium pricing and potentially longer minimum stays. Ensure high availability.
- Low Season: Offer competitive pricing, special promotions (e.g., extended stay discounts), and flexible cancellation policies. Target off-season travelers like remote workers or budget-conscious guests.
- Shoulder Seasons: Implement dynamic pricing that balances peak and low rates. Target weekend travelers or specific events. Offer slightly more flexible terms than peak season.
- Regularly analyze your own performance against these Los Baños del Inca seasonality benchmarks and adjust your pricing and availability strategy accordingly.
Best Areas for Airbnb Investment in Los Baños del Inca (2026)
Exploring the top neighborhoods for short-term rentals in Los Baños del Inca? This section highlights key areas, outlining why they are attractive for hosts and guests, along with notable local attractions. Consider these locations based on your target guest profile and investment strategy.
| Neighborhood / Area | Why Host Here? (Target Guests & Appeal) | Key Attractions & Landmarks |
|---|---|---|
| Quilish | A serene and scenic area known for its stunning views of the Cajamarca valley. It attracts tourists looking for relaxation and nature activities, making it a great spot for peaceful getaways. | Quilish Park, Lake Tartar, Forest of the Waterfalls |
| Cumbemayo | Famous for its ancient aqueducts and stunning rock formations. This unique historical site attracts both national and international tourists interested in history and archaeology. | Cumbemayo Aqueduct, Rock Formations, Archaeological Sites |
| Baños del Inca | Known for its natural hot springs, this neighborhood attracts tourists seeking wellness and relaxation. It is a prime destination for wellness retreats and rejuvenating stays. | Baños del Inca Thermal Baths, Inca Baths, Cajamarca Waterfalls |
| Historic Center of Cajamarca | Rich in history and culture, this area draws visitors interested in colonial architecture and historical landmarks. A great place for tourists wanting to explore Cajamarca's past. | Cathedral of Cajamarca, Site of the Last Inca, Plaza de Armas, Yambrasbamba |
| San Pedro | A charming suburban area near the main attractions of Cajamarca, San Pedro provides a more local experience, appealing to travelers looking for authentic cultural immersion. | Local Markets, Cultural Festivals, Community Events |
| Los Pinos | A quiet residential area with beautiful natural surroundings. It is ideal for families visiting Cajamarca and looking for a peaceful environment to stay. | Nature Trails, Community Parks, Family-Friendly Activities |
| El Cuartel | A developing commercial area with easy access to amenities and city attractions. It is attractive to business travelers and tourists who prefer accessibility and convenience. | Shopping Centers, Restaurants, Business District |
| Santo Domingo | An up-and-coming neighborhood with cultural significance and local charm. It offers a blend of local and tourist experiences, appealing to a diverse range of travelers. | Santo Domingo Church, Artisan Markets, Local Dining |
Understanding Airbnb License Requirements & STR Laws in Los Baños del Inca (2026)
While Los Baños del Inca, Cajamarca, Peru currently shows low STR regulations, specific Airbnb license requirements might still exist or change. Always verify the latest short term rental regulations and Airbnb license requirements directly with local government authorities for Los Baños del Inca to ensure full compliance before hosting.
(Source: AirROI data, 2026, based on 5% licensed listings)
Top Performing Airbnb Properties in Los Baños del Inca (2026)
Benchmark your potential! Explore examples of top-performing Airbnb properties in Los Baños del Incabased on Trailing Twelve Month (TTM) revenue. Analyze their characteristics, revenue, occupancy rate, and ADR to understand what drives success in this market.

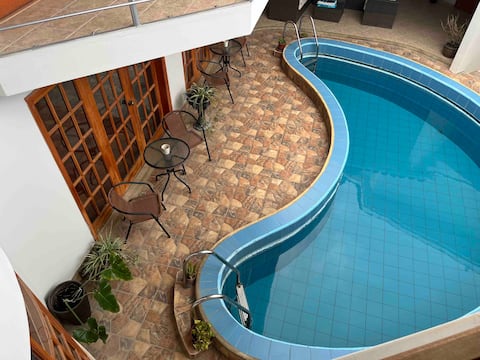
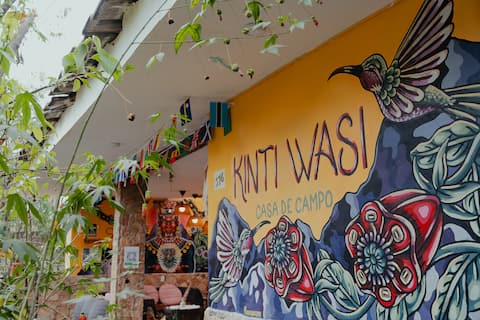
Hummingbird House * Ecolodge & Retreat
Entire Place • 3 bedrooms
Home w thermal waters Inca Baths, sleeps 12
Entire Place • 6 bedrooms
Entire house 18pax•Garden + Fire Pit Baños del Inca
Entire Place • 4 bedrooms

Rustic room with close nature walks
Private Room • N/A

Total Relaxation: Rustic Cabin + Fireplace + Nature
Entire Place • 1 bedroom

El Dorado of the Inca
Entire Place • 4 bedrooms
Note: Performance varies based on location, size, amenities, seasonality, and management quality. Data reflects the past 12 months.
Top Performing Airbnb Hosts in Los Baños del Inca (2026)
Learn from the best! This table showcases top-performing Airbnb hosts in Los Baños del Inca based on the number of properties managed and estimated total revenue over the past year. Analyze their scale and performance metrics.
| Host Name | Properties | Grossing Revenue | Stay Reviews | Avg Rating |
|---|---|---|---|---|
| Jesus | 7 | $28,933 | 100 | 4.87/5.0 |
| Robin | 1 | $14,889 | 119 | 4.92/5.0 |
| Veronica | 1 | $12,657 | 10 | 4.90/5.0 |
| Sol | 4 | $7,911 | 40 | 4.82/5.0 |
| Victoria | 3 | $7,788 | 336 | 4.93/5.0 |
| André Omar | 1 | $5,451 | 1 | Not Rated |
| Blanca Giuliana | 1 | $5,165 | 1 | Not Rated |
| Samantha Nikole | 1 | $4,966 | 27 | 4.81/5.0 |
| Diego | 1 | $4,776 | 2 | Not Rated |
| Carolina | 1 | $4,771 | 52 | 4.79/5.0 |
Analyzing the strategies of top hosts, such as their property selection, pricing, and guest communication, can offer valuable lessons for optimizing your own Airbnb operations in Los Baños del Inca.
Dive Deeper: Advanced Los Baños del Inca STR Market Data (2026)
Ready to unlock more insights? AirROI provides access to advanced metrics and comprehensive Airbnb data for Los Baños del Inca. Explore detailed analytics beyond this report to refine your investment strategy, optimize pricing, and maximize your vacation rental profits.
Explore Advanced MetricsLos Baños del Inca Short-Term Rental Market Composition (2026): Property & Room Types
Room Type Distribution
Property Type Distribution
Market Composition Insights for Los Baños del Inca
- The Los Baños del Inca Airbnb market composition is heavily skewed towards Entire Home/Apt listings, which make up 68.3% of the 60 active rentals. This indicates strong guest preference for privacy and space.
- However, a notable 31.7% share for Private Rooms suggests opportunities for budget-conscious travelers or hosts renting out spare rooms.
- Looking at the property type distribution in Los Baños del Inca, House properties are the most common (43.3%), reflecting the local real estate landscape.
- Houses represent a significant 43.3% portion, catering likely to families or larger groups.
- The presence of 13.3% Hotel/Boutique listings indicates integration with traditional hospitality.
Los Baños del Inca Airbnb Room Capacity Analysis (2026): Bedroom Distribution
Distribution of Listings by Number of Bedrooms
Room Capacity Insights for Los Baños del Inca
- The dominant room capacity in Los Baños del Inca is 2 bedrooms listings, making up 23.3% of the market. This suggests a strong demand for properties suitable for couples or solo travelers.
- Together, 2 bedrooms and 3 bedrooms properties represent 46.6% of the active Airbnb listings in Los Baños del Inca, indicating a high concentration in these sizes.
- A significant 40.0% of listings offer 3+ bedrooms, catering to larger groups and families seeking more space in Los Baños del Inca.
Los Baños del Inca Vacation Rental Guest Capacity Trends (2026)
Distribution of Listings by Guest Capacity
Guest Capacity Insights for Los Baños del Inca
- The most common guest capacity trend in Los Baños del Inca vacation rentals is listings accommodating 8+ guests (18.3%). This suggests the primary traveler segment is likely larger groups.
- Properties designed for 8+ guests and 6 guests dominate the Los Baños del Inca STR market, accounting for 36.6% of listings.
- 43.3% of properties accommodate 6+ guests, serving the market segment for larger families or group travel in Los Baños del Inca.
- On average, properties in Los Baños del Inca are equipped to host 4.4 guests.
Los Baños del Inca Airbnb Booking Patterns (2026): Available vs. Booked Days
Available Days Distribution
Booked Days Distribution
Booking Pattern Insights for Los Baños del Inca
- The most common availability pattern in Los Baños del Inca falls within the 271-366 days range, representing 85% of listings. This suggests many properties have significant open periods on their calendars.
- Approximately 100.0% of listings show high availability (181+ days open annually), indicating potential for increased bookings or specific owner usage patterns.
- For booked days, the 1-30 days range is most frequent in Los Baños del Inca (53.3%), reflecting common guest stay durations or potential owner blocking patterns.
Los Baños del Inca Airbnb Minimum Stay Requirements Analysis
Distribution of Listings by Minimum Night Requirement
1 Night
28 listings
46.7% of total
2 Nights
18 listings
30% of total
3 Nights
5 listings
8.3% of total
30+ Nights
9 listings
15% of total
Key Insights
- The most prevalent minimum stay requirement in Los Baños del Inca is 1 Night, adopted by 46.7% of listings. This highlights the market's preference for shorter, flexible bookings.
- A strong majority (76.7%) of the Los Baños del Inca Airbnb data shows acceptance of very short stays (1-2 nights), indicating a dynamic, high-turnover market.
- A significant segment (15%) caters to monthly stays (30+ nights) in Los Baños del Inca, pointing to opportunities in the extended-stay market.
Recommendations
- Align with the market by considering a 1 Night minimum stay, as 46.7% of Los Baños del Inca hosts use this setting.
- Explore offering discounts for stays of 30+ nights to attract the 15% of the market seeking extended stays.
- Adjust minimum nights based on seasonality – potentially shorter during low season and longer during peak demand periods in Los Baños del Inca.
Los Baños del Inca Airbnb Cancellation Policy Trends Analysis (2026)
Flexible
32 listings
53.3% of total
Moderate
15 listings
25% of total
Firm
12 listings
20% of total
Strict
1 listings
1.7% of total
Cancellation Policy Insights for Los Baños del Inca
- The prevailing Airbnb cancellation policy trend in Los Baños del Inca is Flexible, used by 53.3% of listings.
- The market strongly favors guest-friendly terms, with 78.3% of listings offering Flexible or Moderate policies. This suggests guests in Los Baños del Inca may expect booking flexibility.
- Strict cancellation policies are quite rare (1.7%), potentially making listings with this policy less competitive unless justified by high demand or property type.
Recommendations for Hosts
- Consider adopting a Flexible policy to align with the 53.3% market standard in Los Baños del Inca.
- Given the high prevalence of Flexible policies (53.3%), offering this can enhance booking appeal, especially during shoulder seasons.
- Using a Strict policy might deter some guests, as only 1.7% of listings use it. Evaluate if potential revenue protection outweighs possible lower booking rates.
- Regularly review your cancellation policy against competitors and market demand shifts in Los Baños del Inca.
Los Baños del Inca STR Booking Lead Time Analysis (2026)
Average Booking Lead Time by Month
Booking Lead Time Insights for Los Baños del Inca
- The overall average booking lead time for vacation rentals in Los Baños del Inca is 46 days.
- Guests book furthest in advance for stays during February (average 58 days), likely coinciding with peak travel demand or local events.
- The shortest booking windows occur for stays in April (average 11 days), indicating more last-minute travel plans during this time.
- Seasonally, Winter (38 days avg.) sees the longest lead times, while Fall (17 days avg.) has the shortest, reflecting typical travel planning cycles.
Recommendations for Hosts
- Use the overall average lead time (46 days) as a baseline for your pricing and availability strategy in Los Baños del Inca.
- For February stays, consider implementing length-of-stay discounts or slightly higher rates for bookings made less than 58 days out to capitalize on advance planning.
- During April, focus on last-minute booking availability and promotions, as guests book with very short notice (11 days avg.).
- Target marketing efforts for the Winter season well in advance (at least 38 days) to capture early planners.
- Monitor your own booking lead times against these Los Baños del Inca averages to identify opportunities for dynamic pricing adjustments.
Popular & Essential Airbnb Amenities in Los Baños del Inca (2026)
Amenity Prevalence
Amenity Insights for Los Baños del Inca
- Popular amenities like Wifi, Hot water, TV are common but not universal. Offering these can provide a competitive edge.
- Warning: Wifi is not universally provided but is considered essential globally. Ensure reliable Wifi is offered.
Recommendations for Hosts
- Consider adding popular differentiators like Wifi or Hot water to increase appeal.
- Highlight unique or less common amenities you offer (e.g., hot tub, dedicated workspace, EV charger) in your listing description and photos.
- Regularly check competitor amenities in Los Baños del Inca to stay competitive.
Los Baños del Inca Airbnb Guest Demographics & Profile Analysis (2026)
Guest Profile Summary for Los Baños del Inca
- The typical guest profile for Airbnb in Los Baños del Inca consists of primarily domestic travelers (78%), often arriving from nearby Lima, typically belonging to the Post-2000s (Gen Z/Alpha) group (50%), primarily speaking Spanish or English.
- Domestic travelers account for 78.3% of guests.
- Key international markets include Peru (78.3%) and United States (13%).
- Top languages spoken are Spanish (59.5%) followed by English (33.8%).
- A significant demographic segment is the Post-2000s (Gen Z/Alpha) group, representing 50% of guests.
Recommendations for Hosts
- Target domestic marketing efforts towards travelers from Lima and Trujillo.
- Tailor amenities and listing descriptions to appeal to the dominant Post-2000s (Gen Z/Alpha) demographic (e.g., highlight fast WiFi, smart home features, local guides).
- Highlight unique local experiences or amenities relevant to the primary guest profile.
- Consider seasonal promotions aligned with peak travel times for key origin markets.
Nearby Short-Term Rental Market Comparison
How does the Los Baños del Inca Airbnb market stack up against its neighbors? Compare key performance metrics like average monthly revenue, ADR, and occupancy rates in surrounding areas to understand the broader regional STR landscape.
| Market | Active Properties | Monthly Revenue | Daily Rate | Avg. Occupancy |
|---|---|---|---|---|
| Laredo | 12 | $523 | $232.33 | 16% |
| San Pedro de Lloc | 10 | $415 | $131.54 | 17% |
| Pimentel | 79 | $278 | $60.28 | 25% |
| La Victoria | 23 | $268 | $32.92 | 30% |
| Víctor Larco Herrera | 93 | $246 | $39.11 | 32% |
| Pacasmayo | 33 | $242 | $51.50 | 23% |
| Huanchaco | 156 | $240 | $55.89 | 26% |
| Etén Puerto | 14 | $232 | $73.24 | 24% |
| Rázuri | 31 | $229 | $77.61 | 20% |
| Moche | 16 | $213 | $91.41 | 17% |