Yanahuara Airbnb Market Analysis 2026: Short Term Rental Data & Vacation Rental Statistics in Arequipa, Peru
Is Airbnb profitable in Yanahuara in 2026? Explore comprehensive Airbnb analytics for Yanahuara, Arequipa, Peru to uncover income potential. This 2026 STR market report for Yanahuara, based on AirROI data from February 2025 to January 2026, reveals key trends in the niche market of 180 active listings.
Whether you're considering an Airbnb investment in Yanahuara, optimizing your existing vacation rental, or exploring rental arbitrage opportunities, understanding the Yanahuara Airbnb data is crucial. Leveraging the low regulation environment is key to maximizing your short term rental income potential. Let's dive into the specifics.
Key Yanahuara Airbnb Performance Metrics Overview
Monthly Airbnb Revenue Variations & Income Potential in Yanahuara (2026)
Understanding the monthly revenue variations for Airbnb listings in Yanahuara is key to maximizing your short term rental income potential. Seasonality significantly impacts earnings. Our analysis, based on data from the past 12 months, shows that the peak revenue month for STRs in Yanahuara is typically September, while March often presents the lowest earnings, highlighting opportunities for strategic pricing adjustments during shoulder and low seasons. Explore the typical Airbnb income in Yanahuara across different performance tiers:
- Best-in-class properties (Top 10%) achieve $827+ monthly, often utilizing dynamic pricing and superior guest experiences.
- Strong performing properties (Top 25%) earn $563 or more, indicating effective management and desirable locations/amenities.
- Typical properties (Median) generate around $311 per month, representing the average market performance.
- Entry-level properties (Bottom 25%) see earnings around $147, often with potential for optimization.
Average Monthly Airbnb Earnings Trend in Yanahuara
Yanahuara Airbnb Occupancy Rate Trends (2026)
Maximize your bookings by understanding the Yanahuara STR occupancy trends. Seasonal demand shifts significantly influence how often properties are booked. Typically, Februarysees the highest demand (peak season occupancy), while January experiences the lowest (low season). Effective strategies, like adjusting minimum stays or offering promotions, can boost occupancy during slower periods. Here's how different property tiers perform in Yanahuara:
- Best-in-class properties (Top 10%) achieve 76%+ occupancy, indicating high desirability and potentially optimized availability.
- Strong performing properties (Top 25%) maintain 55% or higher occupancy, suggesting good market fit and guest satisfaction.
- Typical properties (Median) have an occupancy rate around 32%.
- Entry-level properties (Bottom 25%) average 16% occupancy, potentially facing higher vacancy.
Average Monthly Occupancy Rate Trend in Yanahuara
Average Daily Rate (ADR) Airbnb Trends in Yanahuara (2026)
Effective short term rental pricing strategy in Yanahuara involves understanding monthly ADR fluctuations. The Average Daily Rate (ADR) for Airbnb in Yanahuara typically peaks in September and dips lowest during March. Leveraging Airbnb dynamic pricing tools or strategies based on this seasonality can significantly boost revenue. Here's a look at the typical nightly rates achieved:
- Best-in-class properties (Top 10%) command rates of $58+ per night, often due to premium features or locations.
- Strong performing properties (Top 25%) achieve nightly rates of $44 or more.
- Typical properties (Median) charge around $30 per night.
- Entry-level properties (Bottom 25%) earn around $22 per night.
Average Daily Rate (ADR) Trend by Month in Yanahuara
Get Live Yanahuara Market Intelligence 👇

Explore Real-time Analytics
Airbnb Seasonality Analysis & Trends in Yanahuara (2026)
Peak Season (September, July, August)
- Revenue averages $498 per month
- Occupancy rates average 39.3%
- Daily rates average $38
Shoulder Season
- Revenue averages $398 per month
- Occupancy maintains around 36.6%
- Daily rates hold near $37
Low Season (February, March, April)
- Revenue drops to average $330 per month
- Occupancy decreases to average 38.2%
- Daily rates adjust to average $34
Seasonality Insights for Yanahuara
- The Airbnb seasonality in Yanahuara shows moderate seasonality with distinct peak and low periods. While the sections above show seasonal averages, it's also insightful to look at the extremes:
- During the high season, the absolute peak month showcases Yanahuara's highest earning potential, with monthly revenues capable of climbing to $566, occupancy reaching a high of 40.3%, and ADRs peaking at $43.
- Conversely, the slowest single month of the year, typically falling within the low season, marks the market's lowest point. In this month, revenue might dip to $312, occupancy could drop to 34.6%, and ADRs may adjust down to $34.
- Understanding both the seasonal averages and these monthly peaks and troughs in revenue, occupancy, and ADR is crucial for maximizing your Airbnb profit potential in Yanahuara.
Seasonal Strategies for Maximizing Profit
- Peak Season: Maximize revenue through premium pricing and potentially longer minimum stays. Ensure high availability.
- Low Season: Offer competitive pricing, special promotions (e.g., extended stay discounts), and flexible cancellation policies. Target off-season travelers like remote workers or budget-conscious guests.
- Shoulder Seasons: Implement dynamic pricing that balances peak and low rates. Target weekend travelers or specific events. Offer slightly more flexible terms than peak season.
- Regularly analyze your own performance against these Yanahuara seasonality benchmarks and adjust your pricing and availability strategy accordingly.
Best Areas for Airbnb Investment in Yanahuara (2026)
Exploring the top neighborhoods for short-term rentals in Yanahuara? This section highlights key areas, outlining why they are attractive for hosts and guests, along with notable local attractions. Consider these locations based on your target guest profile and investment strategy.
| Neighborhood / Area | Why Host Here? (Target Guests & Appeal) | Key Attractions & Landmarks |
|---|---|---|
| Historic Center | Cultural heart of Arequipa, known for stunning colonial architecture and proximity to major tourist attractions. Ideal for travelers looking to explore the city's rich history and vibrant local culture. | Santa Catalina Monastery, Plaza de Armas, Museo Santuarios Andinos, Arequipa Cathedral, Casa del Moral |
| Yanahuara | Charming district famous for its traditional white sillar houses and stunning views of the Misti volcano. Attracts visitors seeking a peaceful, picturesque neighborhood with local charm. | Yanahuara Viewpoint, Iglesia de Yanahuara, Local artisan shops, Traditional markets |
| Cayma | Upscale residential area with beautiful parks and a more relaxed atmosphere. Ideal for guests looking for tranquility while still being near the city center. | Selva Alegre Park, Cayma's cultural sites, Gastronomy of Cayma |
| Cerro Colorado | Emerging area with a mix of local and modern amenities. Attracts visitors interested in local life and affordable accommodations. | Parque Lambramani, shopping centers, local eateries |
| Socabaya | A traditional neighborhood with a strong local feel, offering a glimpse of everyday life in Arequipa. Perfect for longer stays and those wanting to immerse themselves in local culture. | Solar de Arequipa, Rural tourism experiences, Local cuisine |
| Miraflores Arequipa | A trendy area with a variety of dining and shopping options, known for its vibrant nightlife and cultural activities. Great for young travelers and those seeking entertainment. | Cultural Events, Restaurants and Bars, Shopping areas |
| La Campiña | Known for its beautiful nature and agricultural scenery, a great escape from the city. Ideal for eco-tourism and those seeking a retreat. | Nature Trails, Agricultural Tours, Breathtaking Views |
| Plaza de Armas Area | Main square of Arequipa, surrounded by cafes, shops, and historical sites. Prime location for tourists looking for convenience and lively atmosphere. | City Tours, Restaurants, Shopping |
Understanding Airbnb License Requirements & STR Laws in Yanahuara (2026)
While Yanahuara, Arequipa, Peru currently shows low STR regulations, specific Airbnb license requirements might still exist or change. Always verify the latest short term rental regulations and Airbnb license requirements directly with local government authorities for Yanahuara to ensure full compliance before hosting.
(Source: AirROI data, 2026, finding no licensed listings among those analyzed)
Top Performing Airbnb Properties in Yanahuara (2026)
Benchmark your potential! Explore examples of top-performing Airbnb properties in Yanahuarabased on Trailing Twelve Month (TTM) revenue. Analyze their characteristics, revenue, occupancy rate, and ADR to understand what drives success in this market.
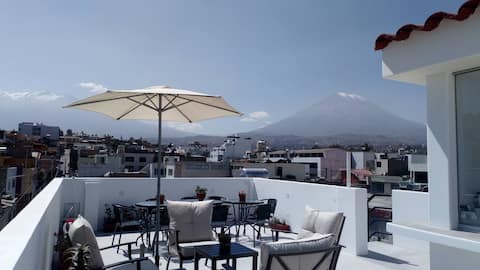
House with Terrace, The Best View of the Volcanoes
Entire Place • 8 bedrooms

Nice 2-story house in the best area of Arequipa
Entire Place • 5 bedrooms

Luxury apartment Yanahuara- Arequipa
Entire Place • 1 bedroom

Los Rieles-CASA in Yanahuara, 5 bedrooms - private bathroom
Entire Place • 5 bedrooms
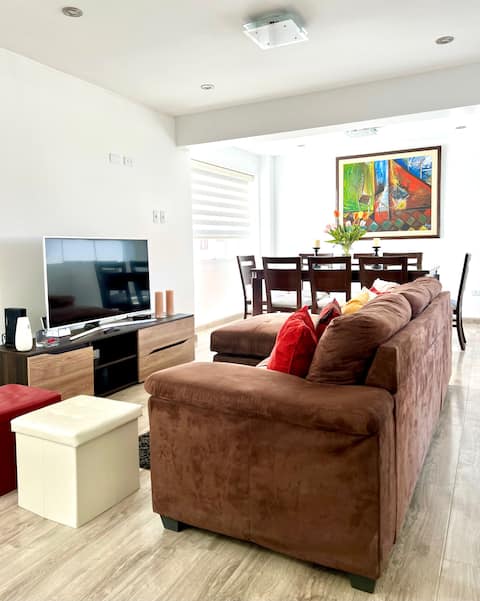
Lovely apartment in Yanahuara
Entire Place • 2 bedrooms

Downtown Duplex, Garage, near Mirador Yanahuara
Entire Place • 4 bedrooms
Note: Performance varies based on location, size, amenities, seasonality, and management quality. Data reflects the past 12 months.
Top Performing Airbnb Hosts in Yanahuara (2026)
Learn from the best! This table showcases top-performing Airbnb hosts in Yanahuara based on the number of properties managed and estimated total revenue over the past year. Analyze their scale and performance metrics.
| Host Name | Properties | Grossing Revenue | Stay Reviews | Avg Rating |
|---|---|---|---|---|
| Ana / Karina | 6 | $31,303 | 156 | 4.69/5.0 |
| Alejandro | 3 | $20,976 | 639 | 4.88/5.0 |
| Silvia | 1 | $20,335 | 118 | 4.77/5.0 |
| Virginia | 5 | $19,274 | 1379 | 4.73/5.0 |
| Rocio | 4 | $17,836 | 539 | 4.72/5.0 |
| Alberth | 4 | $15,611 | 159 | 4.81/5.0 |
| Bertha | 11 | $15,408 | 461 | 4.85/5.0 |
| Jorge | 1 | $14,386 | 93 | 4.87/5.0 |
| Anita | 1 | $12,161 | 64 | 5.00/5.0 |
| Juan Eduardo | 1 | $11,373 | 58 | 4.86/5.0 |
Analyzing the strategies of top hosts, such as their property selection, pricing, and guest communication, can offer valuable lessons for optimizing your own Airbnb operations in Yanahuara.
Dive Deeper: Advanced Yanahuara STR Market Data (2026)
Ready to unlock more insights? AirROI provides access to advanced metrics and comprehensive Airbnb data for Yanahuara. Explore detailed analytics beyond this report to refine your investment strategy, optimize pricing, and maximize your vacation rental profits.
Explore Advanced MetricsYanahuara Short-Term Rental Market Composition (2026): Property & Room Types
Room Type Distribution
Property Type Distribution
Market Composition Insights for Yanahuara
- The Yanahuara Airbnb market composition is heavily skewed towards Entire Home/Apt listings, which make up 66.7% of the 180 active rentals. This indicates strong guest preference for privacy and space.
- However, a notable 33.3% share for Private Rooms suggests opportunities for budget-conscious travelers or hosts renting out spare rooms.
- Looking at the property type distribution in Yanahuara, Apartment/Condo properties are the most common (61.1%), reflecting the local real estate landscape.
- Houses represent a significant 25% portion, catering likely to families or larger groups.
- The presence of 11.7% Hotel/Boutique listings indicates integration with traditional hospitality.
- Smaller segments like others (combined 2.2%) offer potential for unique stay experiences.
Yanahuara Airbnb Room Capacity Analysis (2026): Bedroom Distribution
Distribution of Listings by Number of Bedrooms
Room Capacity Insights for Yanahuara
- The dominant room capacity in Yanahuara is 1 bedroom listings, making up 35% of the market. This suggests a strong demand for properties suitable for couples or solo travelers.
- Together, 1 bedroom and 2 bedrooms properties represent 54.4% of the active Airbnb listings in Yanahuara, indicating a high concentration in these sizes.
- A significant 22.3% of listings offer 3+ bedrooms, catering to larger groups and families seeking more space in Yanahuara.
Yanahuara Vacation Rental Guest Capacity Trends (2026)
Distribution of Listings by Guest Capacity
Guest Capacity Insights for Yanahuara
- The most common guest capacity trend in Yanahuara vacation rentals is listings accommodating 2 guests (27.8%). This suggests the primary traveler segment is likely couples or solo travelers.
- Properties designed for 2 guests and 4 guests dominate the Yanahuara STR market, accounting for 46.7% of listings.
- 14.4% of properties accommodate 6+ guests, serving the market segment for larger families or group travel in Yanahuara.
- On average, properties in Yanahuara are equipped to host 2.7 guests.
Yanahuara Airbnb Booking Patterns (2026): Available vs. Booked Days
Available Days Distribution
Booked Days Distribution
Booking Pattern Insights for Yanahuara
- The most common availability pattern in Yanahuara falls within the 271-366 days range, representing 64.4% of listings. This suggests many properties have significant open periods on their calendars.
- Approximately 88.3% of listings show high availability (181+ days open annually), indicating potential for increased bookings or specific owner usage patterns.
- For booked days, the 31-90 days range is most frequent in Yanahuara (32.2%), reflecting common guest stay durations or potential owner blocking patterns.
- A notable 13.9% of properties secure long booking periods (181+ days booked per year), highlighting successful long-term rental strategies or significant owner usage.
Yanahuara Airbnb Minimum Stay Requirements Analysis
Distribution of Listings by Minimum Night Requirement
1 Night
70 listings
38.9% of total
2 Nights
58 listings
32.2% of total
3 Nights
11 listings
6.1% of total
4-6 Nights
2 listings
1.1% of total
7-29 Nights
5 listings
2.8% of total
30+ Nights
34 listings
18.9% of total
Key Insights
- The most prevalent minimum stay requirement in Yanahuara is 1 Night, adopted by 38.9% of listings. This highlights the market's preference for shorter, flexible bookings.
- A strong majority (71.1%) of the Yanahuara Airbnb data shows acceptance of very short stays (1-2 nights), indicating a dynamic, high-turnover market.
- A significant segment (18.9%) caters to monthly stays (30+ nights) in Yanahuara, pointing to opportunities in the extended-stay market.
Recommendations
- Align with the market by considering a 1 Night minimum stay, as 38.9% of Yanahuara hosts use this setting.
- Explore offering discounts for stays of 30+ nights to attract the 18.9% of the market seeking extended stays.
- Adjust minimum nights based on seasonality – potentially shorter during low season and longer during peak demand periods in Yanahuara.
Yanahuara Airbnb Cancellation Policy Trends Analysis (2026)
Flexible
88 listings
48.9% of total
Moderate
56 listings
31.1% of total
Firm
21 listings
11.7% of total
Strict
15 listings
8.3% of total
Cancellation Policy Insights for Yanahuara
- The prevailing Airbnb cancellation policy trend in Yanahuara is Flexible, used by 48.9% of listings.
- The market strongly favors guest-friendly terms, with 80.0% of listings offering Flexible or Moderate policies. This suggests guests in Yanahuara may expect booking flexibility.
- Strict cancellation policies are quite rare (8.3%), potentially making listings with this policy less competitive unless justified by high demand or property type.
Recommendations for Hosts
- Consider adopting a Flexible policy to align with the 48.9% market standard in Yanahuara.
- Using a Strict policy might deter some guests, as only 8.3% of listings use it. Evaluate if potential revenue protection outweighs possible lower booking rates.
- Regularly review your cancellation policy against competitors and market demand shifts in Yanahuara.
Yanahuara STR Booking Lead Time Analysis (2026)
Average Booking Lead Time by Month
Booking Lead Time Insights for Yanahuara
- The overall average booking lead time for vacation rentals in Yanahuara is 25 days.
- Guests book furthest in advance for stays during September (average 61 days), likely coinciding with peak travel demand or local events.
- The shortest booking windows occur for stays in February (average 9 days), indicating more last-minute travel plans during this time.
- Seasonally, Fall (31 days avg.) sees the longest lead times, while Spring (14 days avg.) has the shortest, reflecting typical travel planning cycles.
Recommendations for Hosts
- Use the overall average lead time (25 days) as a baseline for your pricing and availability strategy in Yanahuara.
- For September stays, consider implementing length-of-stay discounts or slightly higher rates for bookings made less than 61 days out to capitalize on advance planning.
- During February, focus on last-minute booking availability and promotions, as guests book with very short notice (9 days avg.).
- Target marketing efforts for the Fall season well in advance (at least 31 days) to capture early planners.
- Monitor your own booking lead times against these Yanahuara averages to identify opportunities for dynamic pricing adjustments.
Popular & Essential Airbnb Amenities in Yanahuara (2026)
Amenity Prevalence
Amenity Insights for Yanahuara
- Essential amenities in Yanahuara that guests expect include: Wifi, TV. Lacking these (any) could significantly impact bookings.
- Popular amenities like Hot water, Kitchen, Dishes and silverware are common but not universal. Offering these can provide a competitive edge.
Recommendations for Hosts
- Ensure your listing includes all essential amenities for Yanahuara: Wifi, TV.
- Prioritize adding missing essentials: Wifi, TV.
- Consider adding popular differentiators like Hot water or Kitchen to increase appeal.
- Highlight unique or less common amenities you offer (e.g., hot tub, dedicated workspace, EV charger) in your listing description and photos.
- Regularly check competitor amenities in Yanahuara to stay competitive.
Yanahuara Airbnb Guest Demographics & Profile Analysis (2026)
Guest Profile Summary for Yanahuara
- The typical guest profile for Airbnb in Yanahuara consists of a mix of domestic (57%) and international guests, often arriving from nearby Lima, typically belonging to the Post-2000s (Gen Z/Alpha) group (50%), primarily speaking Spanish or English.
- Domestic travelers account for 57.0% of guests.
- Key international markets include Peru (57%) and United States (10.4%).
- Top languages spoken are Spanish (41.2%) followed by English (36%).
- A significant demographic segment is the Post-2000s (Gen Z/Alpha) group, representing 50% of guests.
Recommendations for Hosts
- Balance marketing efforts between domestic and international channels based on the guest mix.
- Tailor amenities and listing descriptions to appeal to the dominant Post-2000s (Gen Z/Alpha) demographic (e.g., highlight fast WiFi, smart home features, local guides).
- Highlight unique local experiences or amenities relevant to the primary guest profile.
- Consider seasonal promotions aligned with peak travel times for key origin markets.
Nearby Short-Term Rental Market Comparison
How does the Yanahuara Airbnb market stack up against its neighbors? Compare key performance metrics like average monthly revenue, ADR, and occupancy rates in surrounding areas to understand the broader regional STR landscape.
| Market | Active Properties | Monthly Revenue | Daily Rate | Avg. Occupancy |
|---|---|---|---|---|
| Mejía | 27 | $499 | $143.48 | 21% |
| Cayma | 174 | $317 | $41.46 | 36% |
| Mollendo | 74 | $291 | $86.24 | 25% |
| Yanque | 23 | $290 | $94.53 | 16% |
| Arequipa | 718 | $289 | $42.06 | 32% |
| Samuel Pastor | 63 | $280 | $133.01 | 25% |
| Cerro Colorado | 120 | $256 | $46.26 | 30% |
| Camaná | 13 | $255 | $100.77 | 21% |
| Sachaca | 21 | $236 | $35.87 | 28% |
| Miraflores | 64 | $226 | $27.72 | 39% |