Samuel Pastor Airbnb Market Analysis 2026: Short Term Rental Data & Vacation Rental Statistics in Arequipa, Peru
Is Airbnb profitable in Samuel Pastor in 2026? Explore comprehensive Airbnb analytics for Samuel Pastor, Arequipa, Peru to uncover income potential. This 2026 STR market report for Samuel Pastor, based on AirROI data from February 2025 to January 2026, reveals key trends in the niche market of 63 active listings.
Whether you're considering an Airbnb investment in Samuel Pastor, optimizing your existing vacation rental, or exploring rental arbitrage opportunities, understanding the Samuel Pastor Airbnb data is crucial. Leveraging the low regulation environment is key to maximizing your short term rental income potential. Let's dive into the specifics.
Key Samuel Pastor Airbnb Performance Metrics Overview
Monthly Airbnb Revenue Variations & Income Potential in Samuel Pastor (2026)
Understanding the monthly revenue variations for Airbnb listings in Samuel Pastor is key to maximizing your short term rental income potential. Seasonality significantly impacts earnings. Our analysis, based on data from the past 12 months, shows that the peak revenue month for STRs in Samuel Pastor is typically February, while June often presents the lowest earnings, highlighting opportunities for strategic pricing adjustments during shoulder and low seasons. Explore the typical Airbnb income in Samuel Pastor across different performance tiers:
- Best-in-class properties (Top 10%) achieve $1,393+ monthly, often utilizing dynamic pricing and superior guest experiences.
- Strong performing properties (Top 25%) earn $930 or more, indicating effective management and desirable locations/amenities.
- Typical properties (Median) generate around $463 per month, representing the average market performance.
- Entry-level properties (Bottom 25%) see earnings around $205, often with potential for optimization.
Average Monthly Airbnb Earnings Trend in Samuel Pastor
Samuel Pastor Airbnb Occupancy Rate Trends (2026)
Maximize your bookings by understanding the Samuel Pastor STR occupancy trends. Seasonal demand shifts significantly influence how often properties are booked. Typically, Februarysees the highest demand (peak season occupancy), while September experiences the lowest (low season). Effective strategies, like adjusting minimum stays or offering promotions, can boost occupancy during slower periods. Here's how different property tiers perform in Samuel Pastor:
- Best-in-class properties (Top 10%) achieve 29%+ occupancy, indicating high desirability and potentially optimized availability.
- Strong performing properties (Top 25%) maintain 19% or higher occupancy, suggesting good market fit and guest satisfaction.
- Typical properties (Median) have an occupancy rate around 10%.
- Entry-level properties (Bottom 25%) average 6% occupancy, potentially facing higher vacancy.
Average Monthly Occupancy Rate Trend in Samuel Pastor
Average Daily Rate (ADR) Airbnb Trends in Samuel Pastor (2026)
Effective short term rental pricing strategy in Samuel Pastor involves understanding monthly ADR fluctuations. The Average Daily Rate (ADR) for Airbnb in Samuel Pastor typically peaks in January and dips lowest during April. Leveraging Airbnb dynamic pricing tools or strategies based on this seasonality can significantly boost revenue. Here's a look at the typical nightly rates achieved:
- Best-in-class properties (Top 10%) command rates of $243+ per night, often due to premium features or locations.
- Strong performing properties (Top 25%) achieve nightly rates of $162 or more.
- Typical properties (Median) charge around $110 per night.
- Entry-level properties (Bottom 25%) earn around $71 per night.
Average Daily Rate (ADR) Trend by Month in Samuel Pastor
Get Live Samuel Pastor Market Intelligence 👇

Explore Real-time Analytics
Airbnb Seasonality Analysis & Trends in Samuel Pastor (2026)
Peak Season (February, May, January)
- Revenue averages $1,368 per month
- Occupancy rates average 28.8%
- Daily rates average $129
Shoulder Season
- Revenue averages $524 per month
- Occupancy maintains around 12.0%
- Daily rates hold near $127
Low Season (June, August, September)
- Revenue drops to average $216 per month
- Occupancy decreases to average 3.7%
- Daily rates adjust to average $129
Seasonality Insights for Samuel Pastor
- The Airbnb seasonality in Samuel Pastor shows highly seasonal trends requiring careful strategy. While the sections above show seasonal averages, it's also insightful to look at the extremes:
- During the high season, the absolute peak month showcases Samuel Pastor's highest earning potential, with monthly revenues capable of climbing to $1,771, occupancy reaching a high of 43.1%, and ADRs peaking at $137.
- Conversely, the slowest single month of the year, typically falling within the low season, marks the market's lowest point. In this month, revenue might dip to $209, occupancy could drop to 3.3%, and ADRs may adjust down to $121.
- Understanding both the seasonal averages and these monthly peaks and troughs in revenue, occupancy, and ADR is crucial for maximizing your Airbnb profit potential in Samuel Pastor.
Seasonal Strategies for Maximizing Profit
- Peak Season: Maximize revenue through premium pricing and potentially longer minimum stays. Ensure high availability.
- Low Season: Offer competitive pricing, special promotions (e.g., extended stay discounts), and flexible cancellation policies. Target off-season travelers like remote workers or budget-conscious guests.
- Shoulder Seasons: Implement dynamic pricing that balances peak and low rates. Target weekend travelers or specific events. Offer slightly more flexible terms than peak season.
- Regularly analyze your own performance against these Samuel Pastor seasonality benchmarks and adjust your pricing and availability strategy accordingly.
Best Areas for Airbnb Investment in Samuel Pastor (2026)
Exploring the top neighborhoods for short-term rentals in Samuel Pastor? This section highlights key areas, outlining why they are attractive for hosts and guests, along with notable local attractions. Consider these locations based on your target guest profile and investment strategy.
| Neighborhood / Area | Why Host Here? (Target Guests & Appeal) | Key Attractions & Landmarks |
|---|---|---|
| Miraflores | A trendy district known for its parks, beaches, and vibrant nightlife, Miraflores attracts tourists looking for a mix of culture and leisure activities. | Larcomar, Kennedy Park, Huaca Pucllana, Miraflores Boardwalk, Parque Kennedy |
| Centro Histórico de Arequipa | The historic center of Arequipa is a UNESCO World Heritage site known for its colonial architecture and rich history. It's a popular spot for tourists exploring culture and history. | Plaza de Armas, Santa Catalina Monastery, Arequipa Cathedral, Museum of Andean Sanctuaries, Yanahuara Viewpoint |
| Yanahuara | This district is famous for its scenic views of the city and its historical buildings, making it attractive for visitors who enjoy outdoor activities and photography. | Yanahuara Viewpoint, The Church of Yanahuara, Mirador de Yanahuara, Vilque Blanco Church |
| Cayma | An affluent residential area with beautiful views and parks, Cayma offers a quiet escape from the city while still being close to attractions. | Cayma Bridge, Paseo del Solar, Cayma Park |
| Socabaya | Known for its peaceful environment, Socabaya is ideal for travelers looking for a more laid-back experience while still having access to local attractions. | Socabaya Park, Cerro Colorado, Local artisan markets |
| José Luis Bustamante y Rivero | A district that combines residential life with access to parks and local markets, appealing to visitors who prefer staying in a local ambiance. | Tingo River, Parque Selva Alegre, Local markets |
| La Joya | A developing area that offers affordable accommodations with easy access to public transportation, appealing to budget-conscious travelers. | Local attractions related to agriculture, Cultural experiences in surrounding areas |
| Arequipa Cercado | This central area provides a mix of cultural experiences and urban life, making it a hotspot for tourists who want to explore the essence of Arequipa. | Museo del Oro, Plaza de Armas, Cultural events and festivals |
Understanding Airbnb License Requirements & STR Laws in Samuel Pastor (2026)
While Samuel Pastor, Arequipa, Peru currently shows low STR regulations, specific Airbnb license requirements might still exist or change. Always verify the latest short term rental regulations and Airbnb license requirements directly with local government authorities for Samuel Pastor to ensure full compliance before hosting.
(Source: AirROI data, 2026, based on 2% licensed listings)
Top Performing Airbnb Properties in Samuel Pastor (2026)
Benchmark your potential! Explore examples of top-performing Airbnb properties in Samuel Pastorbased on Trailing Twelve Month (TTM) revenue. Analyze their characteristics, revenue, occupancy rate, and ADR to understand what drives success in this market.

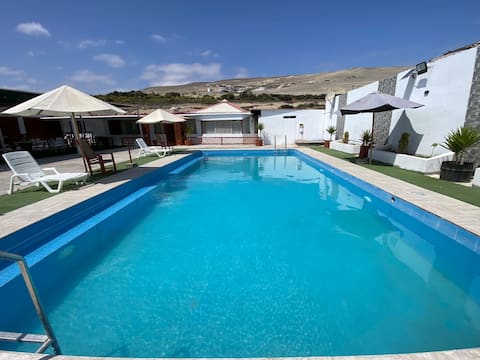
Beautiful Camaná Beach House
Entire Place • 6 bedrooms
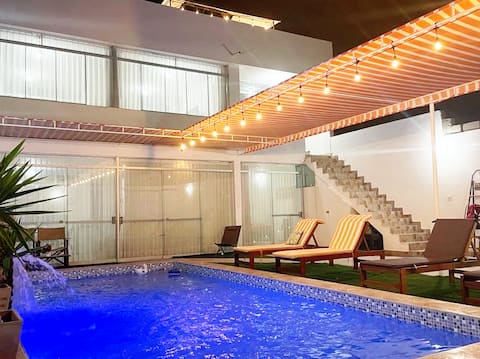
GREAT BEACH HOUSE IN CAMANÁ!
Entire Place • 8 bedrooms

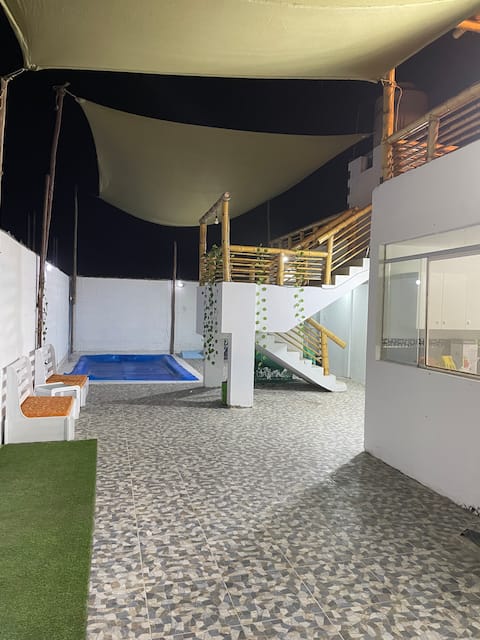
Casa Playa Camaná half a block from the sea - La Punta
Entire Place • 6 bedrooms
Camaná Cerrillos beach house
Entire Place • 3 bedrooms
Mar y Sol Caves
Entire Place • 3 bedrooms

Furnished apartment on Camaná beach
Entire Place • 3 bedrooms
Note: Performance varies based on location, size, amenities, seasonality, and management quality. Data reflects the past 12 months.
Top Performing Airbnb Hosts in Samuel Pastor (2026)
Learn from the best! This table showcases top-performing Airbnb hosts in Samuel Pastor based on the number of properties managed and estimated total revenue over the past year. Analyze their scale and performance metrics.
| Host Name | Properties | Grossing Revenue | Stay Reviews | Avg Rating |
|---|---|---|---|---|
| Andrés | 1 | $20,794 | 1 | Not Rated |
| Fio | 3 | $17,203 | 7 | 4.50/5.0 |
| Geryll | 1 | $16,597 | 46 | 4.89/5.0 |
| David | 1 | $13,332 | 6 | 4.83/5.0 |
| Marie | 2 | $12,484 | 11 | 4.83/5.0 |
| Enrique | 3 | $11,183 | 7 | 5.00/5.0 |
| Marylia | 4 | $8,998 | 11 | 4.72/5.0 |
| Jessica Kattia | 3 | $6,803 | 24 | 4.97/5.0 |
| Michael | 1 | $6,486 | 3 | 3.67/5.0 |
| Claudia | 1 | $5,750 | 6 | 4.83/5.0 |
Analyzing the strategies of top hosts, such as their property selection, pricing, and guest communication, can offer valuable lessons for optimizing your own Airbnb operations in Samuel Pastor.
Dive Deeper: Advanced Samuel Pastor STR Market Data (2026)
Ready to unlock more insights? AirROI provides access to advanced metrics and comprehensive Airbnb data for Samuel Pastor. Explore detailed analytics beyond this report to refine your investment strategy, optimize pricing, and maximize your vacation rental profits.
Explore Advanced MetricsSamuel Pastor Short-Term Rental Market Composition (2026): Property & Room Types
Room Type Distribution
Property Type Distribution
Market Composition Insights for Samuel Pastor
- The Samuel Pastor Airbnb market composition is heavily skewed towards Entire Home/Apt listings, which make up 85.7% of the 63 active rentals. This indicates strong guest preference for privacy and space.
- Looking at the property type distribution in Samuel Pastor, House properties are the most common (61.9%), reflecting the local real estate landscape.
- Houses represent a significant 61.9% portion, catering likely to families or larger groups.
- Smaller segments like hotel/boutique, outdoor/unique (combined 8.0%) offer potential for unique stay experiences.
Samuel Pastor Airbnb Room Capacity Analysis (2026): Bedroom Distribution
Distribution of Listings by Number of Bedrooms
Room Capacity Insights for Samuel Pastor
- The dominant room capacity in Samuel Pastor is 3 bedrooms listings, making up 33.3% of the market. This suggests a strong demand for properties suitable for families or small groups.
- Together, 3 bedrooms and 4 bedrooms properties represent 58.7% of the active Airbnb listings in Samuel Pastor, indicating a high concentration in these sizes.
- A significant 77.7% of listings offer 3+ bedrooms, catering to larger groups and families seeking more space in Samuel Pastor.
Samuel Pastor Vacation Rental Guest Capacity Trends (2026)
Distribution of Listings by Guest Capacity
Guest Capacity Insights for Samuel Pastor
- The most common guest capacity trend in Samuel Pastor vacation rentals is listings accommodating 8+ guests (69.8%). This suggests the primary traveler segment is likely larger groups.
- Properties designed for 8+ guests and 6 guests dominate the Samuel Pastor STR market, accounting for 80.9% of listings.
- 84.1% of properties accommodate 6+ guests, serving the market segment for larger families or group travel in Samuel Pastor.
- On average, properties in Samuel Pastor are equipped to host 6.8 guests.
Samuel Pastor Airbnb Booking Patterns (2026): Available vs. Booked Days
Available Days Distribution
Booked Days Distribution
Booking Pattern Insights for Samuel Pastor
- The most common availability pattern in Samuel Pastor falls within the 271-366 days range, representing 100% of listings. This suggests many properties have significant open periods on their calendars.
- Approximately 100.0% of listings show high availability (181+ days open annually), indicating potential for increased bookings or specific owner usage patterns.
- For booked days, the 1-30 days range is most frequent in Samuel Pastor (71.4%), reflecting common guest stay durations or potential owner blocking patterns.
Samuel Pastor Airbnb Minimum Stay Requirements Analysis
Distribution of Listings by Minimum Night Requirement
1 Night
22 listings
34.9% of total
2 Nights
7 listings
11.1% of total
3 Nights
9 listings
14.3% of total
4-6 Nights
6 listings
9.5% of total
7-29 Nights
1 listings
1.6% of total
30+ Nights
18 listings
28.6% of total
Key Insights
- The most prevalent minimum stay requirement in Samuel Pastor is 1 Night, adopted by 34.9% of listings. This highlights the market's preference for shorter, flexible bookings.
- A significant segment (28.6%) caters to monthly stays (30+ nights) in Samuel Pastor, pointing to opportunities in the extended-stay market.
Recommendations
- Align with the market by considering a 1 Night minimum stay, as 34.9% of Samuel Pastor hosts use this setting.
- Explore offering discounts for stays of 30+ nights to attract the 28.6% of the market seeking extended stays.
- Adjust minimum nights based on seasonality – potentially shorter during low season and longer during peak demand periods in Samuel Pastor.
Samuel Pastor Airbnb Cancellation Policy Trends Analysis (2026)
Limited
4 listings
6.3% of total
Flexible
25 listings
39.7% of total
Moderate
18 listings
28.6% of total
Firm
7 listings
11.1% of total
Strict
9 listings
14.3% of total
Cancellation Policy Insights for Samuel Pastor
- The prevailing Airbnb cancellation policy trend in Samuel Pastor is Flexible, used by 39.7% of listings.
- There's a relatively balanced mix between guest-friendly (68.3%) and stricter (25.4%) policies, offering choices for different guest needs.
Recommendations for Hosts
- Consider adopting a Flexible policy to align with the 39.7% market standard in Samuel Pastor.
- Using a Strict policy might deter some guests, as only 14.3% of listings use it. Evaluate if potential revenue protection outweighs possible lower booking rates.
- Regularly review your cancellation policy against competitors and market demand shifts in Samuel Pastor.
Samuel Pastor STR Booking Lead Time Analysis (2026)
Average Booking Lead Time by Month
Booking Lead Time Insights for Samuel Pastor
- The overall average booking lead time for vacation rentals in Samuel Pastor is 15 days.
- Guests book furthest in advance for stays during December (average 21 days), likely coinciding with peak travel demand or local events.
- The shortest booking windows occur for stays in August (average 1 days), indicating more last-minute travel plans during this time.
- Seasonally, Winter (18 days avg.) sees the longest lead times, while Summer (1 days avg.) has the shortest, reflecting typical travel planning cycles.
Recommendations for Hosts
- Use the overall average lead time (15 days) as a baseline for your pricing and availability strategy in Samuel Pastor.
- During August, focus on last-minute booking availability and promotions, as guests book with very short notice (1 days avg.).
- Target marketing efforts for the Winter season well in advance (at least 18 days) to capture early planners.
- Monitor your own booking lead times against these Samuel Pastor averages to identify opportunities for dynamic pricing adjustments.
Popular & Essential Airbnb Amenities in Samuel Pastor (2026)
Amenity Prevalence
Amenity Insights for Samuel Pastor
- Popular amenities like Kitchen, Outdoor shower, Free parking on premises are common but not universal. Offering these can provide a competitive edge.
- A pool is a highly desired but not standard amenity, making it a key feature for attracting guests seeking leisure in Samuel Pastor.
Recommendations for Hosts
- Consider adding popular differentiators like Kitchen or Outdoor shower to increase appeal.
- Highlight unique or less common amenities you offer (e.g., hot tub, dedicated workspace, EV charger) in your listing description and photos.
- Regularly check competitor amenities in Samuel Pastor to stay competitive.
Samuel Pastor Airbnb Guest Demographics & Profile Analysis (2026)
Guest Profile Summary for Samuel Pastor
- The typical guest profile for Airbnb in Samuel Pastor consists of primarily domestic travelers (68%), often arriving from nearby Arequipa, typically belonging to the Post-2000s (Gen Z/Alpha) group (50%), primarily speaking Spanish or English.
- Domestic travelers account for 67.9% of guests.
- Key international markets include Peru (67.9%) and United States (10.7%).
- Top languages spoken are Spanish (50%) followed by English (37.5%).
- A significant demographic segment is the Post-2000s (Gen Z/Alpha) group, representing 50% of guests.
Recommendations for Hosts
- Target domestic marketing efforts towards travelers from Arequipa and Lima Region.
- Tailor amenities and listing descriptions to appeal to the dominant Post-2000s (Gen Z/Alpha) demographic (e.g., highlight fast WiFi, smart home features, local guides).
- Highlight unique local experiences or amenities relevant to the primary guest profile.
- Consider seasonal promotions aligned with peak travel times for key origin markets.
Nearby Short-Term Rental Market Comparison
How does the Samuel Pastor Airbnb market stack up against its neighbors? Compare key performance metrics like average monthly revenue, ADR, and occupancy rates in surrounding areas to understand the broader regional STR landscape.
| Market | Active Properties | Monthly Revenue | Daily Rate | Avg. Occupancy |
|---|---|---|---|---|
| Mejía | 27 | $499 | $143.48 | 21% |
| Cayma | 174 | $317 | $41.46 | 36% |
| Mollendo | 74 | $291 | $86.24 | 25% |
| Yanque | 23 | $290 | $94.53 | 16% |
| Arequipa | 718 | $289 | $42.06 | 32% |
| Cerro Colorado | 120 | $256 | $46.26 | 30% |
| Camaná | 13 | $255 | $100.77 | 21% |
| Yanahuara | 180 | $242 | $35.82 | 34% |
| Sachaca | 21 | $236 | $35.87 | 28% |
| Miraflores | 64 | $226 | $27.72 | 39% |