Sachaca Airbnb Market Analysis 2026: Short Term Rental Data & Vacation Rental Statistics in Arequipa, Peru
Is Airbnb profitable in Sachaca in 2026? Explore comprehensive Airbnb analytics for Sachaca, Arequipa, Peru to uncover income potential. This 2026 STR market report for Sachaca, based on AirROI data from February 2025 to January 2026, reveals key trends in the niche market of 21 active listings.
Whether you're considering an Airbnb investment in Sachaca, optimizing your existing vacation rental, or exploring rental arbitrage opportunities, understanding the Sachaca Airbnb data is crucial. Leveraging the low regulation environment is key to maximizing your short term rental income potential. Let's dive into the specifics.
Key Sachaca Airbnb Performance Metrics Overview
Monthly Airbnb Revenue Variations & Income Potential in Sachaca (2026)
Understanding the monthly revenue variations for Airbnb listings in Sachaca is key to maximizing your short term rental income potential. Seasonality significantly impacts earnings. Our analysis, based on data from the past 12 months, shows that the peak revenue month for STRs in Sachaca is typically October, while January often presents the lowest earnings, highlighting opportunities for strategic pricing adjustments during shoulder and low seasons. Explore the typical Airbnb income in Sachaca across different performance tiers:
- Best-in-class properties (Top 10%) achieve $1,058+ monthly, often utilizing dynamic pricing and superior guest experiences.
- Strong performing properties (Top 25%) earn $380 or more, indicating effective management and desirable locations/amenities.
- Typical properties (Median) generate around $222 per month, representing the average market performance.
- Entry-level properties (Bottom 25%) see earnings around $120, often with potential for optimization.
Average Monthly Airbnb Earnings Trend in Sachaca
Sachaca Airbnb Occupancy Rate Trends (2026)
Maximize your bookings by understanding the Sachaca STR occupancy trends. Seasonal demand shifts significantly influence how often properties are booked. Typically, Marchsees the highest demand (peak season occupancy), while June experiences the lowest (low season). Effective strategies, like adjusting minimum stays or offering promotions, can boost occupancy during slower periods. Here's how different property tiers perform in Sachaca:
- Best-in-class properties (Top 10%) achieve 61%+ occupancy, indicating high desirability and potentially optimized availability.
- Strong performing properties (Top 25%) maintain 47% or higher occupancy, suggesting good market fit and guest satisfaction.
- Typical properties (Median) have an occupancy rate around 26%.
- Entry-level properties (Bottom 25%) average 12% occupancy, potentially facing higher vacancy.
Average Monthly Occupancy Rate Trend in Sachaca
Average Daily Rate (ADR) Airbnb Trends in Sachaca (2026)
Effective short term rental pricing strategy in Sachaca involves understanding monthly ADR fluctuations. The Average Daily Rate (ADR) for Airbnb in Sachaca typically peaks in September and dips lowest during February. Leveraging Airbnb dynamic pricing tools or strategies based on this seasonality can significantly boost revenue. Here's a look at the typical nightly rates achieved:
- Best-in-class properties (Top 10%) command rates of $49+ per night, often due to premium features or locations.
- Strong performing properties (Top 25%) achieve nightly rates of $35 or more.
- Typical properties (Median) charge around $28 per night.
- Entry-level properties (Bottom 25%) earn around $24 per night.
Average Daily Rate (ADR) Trend by Month in Sachaca
Get Live Sachaca Market Intelligence 👇

Explore Real-time Analytics
Airbnb Seasonality Analysis & Trends in Sachaca (2026)
Peak Season (October, December, April)
- Revenue averages $595 per month
- Occupancy rates average 37.0%
- Daily rates average $35
Shoulder Season
- Revenue averages $475 per month
- Occupancy maintains around 32.7%
- Daily rates hold near $33
Low Season (January, June, November)
- Revenue drops to average $332 per month
- Occupancy decreases to average 23.8%
- Daily rates adjust to average $34
Seasonality Insights for Sachaca
- The Airbnb seasonality in Sachaca shows highly seasonal trends requiring careful strategy. While the sections above show seasonal averages, it's also insightful to look at the extremes:
- During the high season, the absolute peak month showcases Sachaca's highest earning potential, with monthly revenues capable of climbing to $664, occupancy reaching a high of 40.0%, and ADRs peaking at $38.
- Conversely, the slowest single month of the year, typically falling within the low season, marks the market's lowest point. In this month, revenue might dip to $249, occupancy could drop to 19.6%, and ADRs may adjust down to $31.
- Understanding both the seasonal averages and these monthly peaks and troughs in revenue, occupancy, and ADR is crucial for maximizing your Airbnb profit potential in Sachaca.
Seasonal Strategies for Maximizing Profit
- Peak Season: Maximize revenue through premium pricing and potentially longer minimum stays. Ensure high availability.
- Low Season: Offer competitive pricing, special promotions (e.g., extended stay discounts), and flexible cancellation policies. Target off-season travelers like remote workers or budget-conscious guests.
- Shoulder Seasons: Implement dynamic pricing that balances peak and low rates. Target weekend travelers or specific events. Offer slightly more flexible terms than peak season.
- Regularly analyze your own performance against these Sachaca seasonality benchmarks and adjust your pricing and availability strategy accordingly.
Best Areas for Airbnb Investment in Sachaca (2026)
Exploring the top neighborhoods for short-term rentals in Sachaca? This section highlights key areas, outlining why they are attractive for hosts and guests, along with notable local attractions. Consider these locations based on your target guest profile and investment strategy.
| Neighborhood / Area | Why Host Here? (Target Guests & Appeal) | Key Attractions & Landmarks |
|---|---|---|
| Centro Histórico | The historic center of Arequipa is full of colonial architecture, culture, and history. It's a prime location for tourists looking to explore the cultural heritage of the city with easy access to shops and restaurants. | Santa Catalina Monastery, Arequipa Cathedral, Plaza de Armas, Museo Santuarios Andinos, Calle Mercaderes |
| Yanahuara | A picturesque district known for its beautiful views of the volcanoes and charming streets. Popular with those looking for a more residential feel while still close to the city’s attractions. | Yanahuara Viewpoint, Iglesia de Yanahuara, Plaza de Yanahuara, Mirador de Yanahuara |
| Cayma | This area is known for its upscale residences and views of the city, making it appealing for visitors seeking comfort and aerial vistas of Arequipa. It offers a quieter experience while still being close to the city center. | Mirador de Cayma, Iglesia de Cayma, Jardín de la Selva |
| Socabaya | A district with a more local feel, offering interactions with suburban life in Arequipa while being a short distance from major attractions. Great for visitors wanting an authentic experience. | Iglesia de Socabaya, Mercado de Socabaya, Parque de Socabaya |
| Cercado | This central area includes multiple attractions, restaurants, and nightlife options, making it an excellent base for tourists. It's vibrant and full of local character. | La Recoleta, Museo de Arte Virreinal, Teatro Municipal, Virgen de Chapi |
| La Rotary | A residential and commercial area that has easy access to the main roads of Arequipa, ideal for guests who want to explore both the city and the surrounding areas. | Plaza Rotary, Parque La Rotary |
| Chachani | A more nature-focused area near the volcano of the same name, appealing to adventure tourists interested in hiking and outdoor activities. Offers stunning landscapes and fresh air. | Hiking trails, Natural parks, Volcan Chachani |
| San Lazaro | Known for its architecture and cultural significance, this area is charming and close to various attractions, appealing to visitors wanting to experience local life in a historic ambiance. | Iglesia de San Lazaro, Plaza de Armas, Local markets |
Understanding Airbnb License Requirements & STR Laws in Sachaca (2026)
While Sachaca, Arequipa, Peru currently shows low STR regulations, specific Airbnb license requirements might still exist or change. Always verify the latest short term rental regulations and Airbnb license requirements directly with local government authorities for Sachaca to ensure full compliance before hosting.
(Source: AirROI data, 2026, finding no licensed listings among those analyzed)
Top Performing Airbnb Properties in Sachaca (2026)
Benchmark your potential! Explore examples of top-performing Airbnb properties in Sachacabased on Trailing Twelve Month (TTM) revenue. Analyze their characteristics, revenue, occupancy rate, and ADR to understand what drives success in this market.
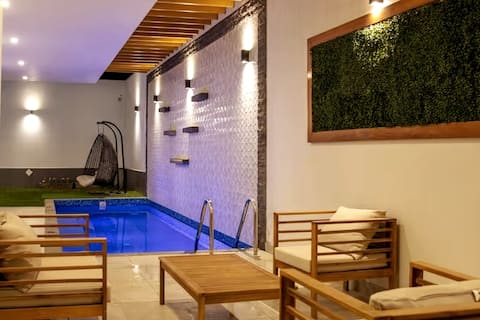
Family getaway with pool, jacuzzi and grill
Entire Place • 6 bedrooms
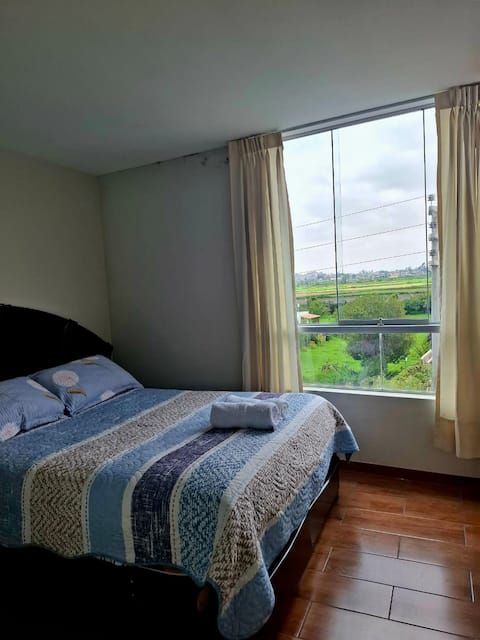
Beautiful view of the countryside. Long stays.
Entire Place • 2 bedrooms
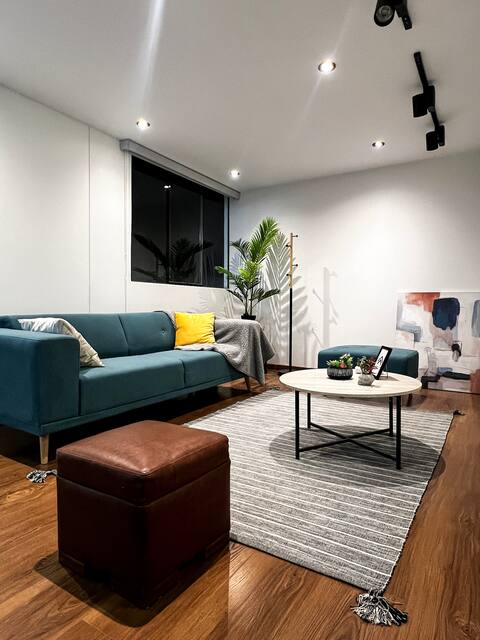
Apartment in Sachaca - Loft
Entire Place • 1 bedroom

Cozy, beautiful Vista.
Entire Place • 1 bedroom
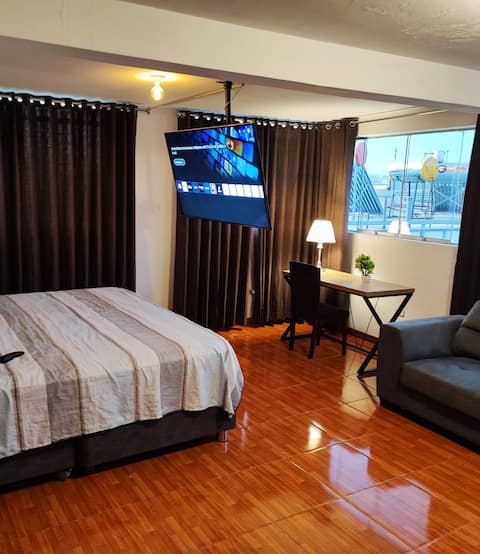
Room with a beautiful view
Private Room • N/A

Spacious and beautiful room
Private Room • 1 bedroom
Note: Performance varies based on location, size, amenities, seasonality, and management quality. Data reflects the past 12 months.
Top Performing Airbnb Hosts in Sachaca (2026)
Learn from the best! This table showcases top-performing Airbnb hosts in Sachaca based on the number of properties managed and estimated total revenue over the past year. Analyze their scale and performance metrics.
| Host Name | Properties | Grossing Revenue | Stay Reviews | Avg Rating |
|---|---|---|---|---|
| Karina | 2 | $32,291 | 115 | 4.84/5.0 |
| Victoria | 2 | $7,340 | 43 | 4.72/5.0 |
| Daniel | 3 | $6,415 | 327 | 4.88/5.0 |
| Diego | 1 | $3,724 | 11 | 4.73/5.0 |
| Alejandra | 3 | $1,983 | 15 | 4.78/5.0 |
| Naomi | 2 | $1,949 | 27 | 4.47/5.0 |
| Rosa | 1 | $1,530 | 13 | 4.77/5.0 |
| Carol | 1 | $1,149 | 8 | 4.88/5.0 |
| Raul Pulido | 1 | $1,029 | 2 | Not Rated |
| Anyela | 1 | $837 | 8 | 5.00/5.0 |
Analyzing the strategies of top hosts, such as their property selection, pricing, and guest communication, can offer valuable lessons for optimizing your own Airbnb operations in Sachaca.
Dive Deeper: Advanced Sachaca STR Market Data (2026)
Ready to unlock more insights? AirROI provides access to advanced metrics and comprehensive Airbnb data for Sachaca. Explore detailed analytics beyond this report to refine your investment strategy, optimize pricing, and maximize your vacation rental profits.
Explore Advanced MetricsSachaca Short-Term Rental Market Composition (2026): Property & Room Types
Room Type Distribution
Property Type Distribution
Market Composition Insights for Sachaca
- The Sachaca Airbnb market composition is heavily skewed towards Entire Home/Apt listings, which make up 85.7% of the 21 active rentals. This indicates strong guest preference for privacy and space.
- Looking at the property type distribution in Sachaca, Apartment/Condo properties are the most common (71.4%), reflecting the local real estate landscape.
- Houses represent a significant 19% portion, catering likely to families or larger groups.
- The presence of 9.5% Hotel/Boutique listings indicates integration with traditional hospitality.
Sachaca Airbnb Room Capacity Analysis (2026): Bedroom Distribution
Distribution of Listings by Number of Bedrooms
Room Capacity Insights for Sachaca
- The dominant room capacity in Sachaca is 2 bedrooms listings, making up 38.1% of the market. This suggests a strong demand for properties suitable for couples or solo travelers.
- Together, 2 bedrooms and 1 bedroom properties represent 61.9% of the active Airbnb listings in Sachaca, indicating a high concentration in these sizes.
- A significant 23.9% of listings offer 3+ bedrooms, catering to larger groups and families seeking more space in Sachaca.
Sachaca Vacation Rental Guest Capacity Trends (2026)
Distribution of Listings by Guest Capacity
Guest Capacity Insights for Sachaca
- The most common guest capacity trend in Sachaca vacation rentals is listings accommodating 4 guests (28.6%). This suggests the primary traveler segment is likely small families or groups.
- Properties designed for 4 guests and 2 guests dominate the Sachaca STR market, accounting for 52.4% of listings.
- 14.3% of properties accommodate 6+ guests, serving the market segment for larger families or group travel in Sachaca.
- On average, properties in Sachaca are equipped to host 3.3 guests.
Sachaca Airbnb Booking Patterns (2026): Available vs. Booked Days
Available Days Distribution
Booked Days Distribution
Booking Pattern Insights for Sachaca
- The most common availability pattern in Sachaca falls within the 271-366 days range, representing 71.4% of listings. This suggests many properties have significant open periods on their calendars.
- Approximately 95.2% of listings show high availability (181+ days open annually), indicating potential for increased bookings or specific owner usage patterns.
- For booked days, the 1-30 days range is most frequent in Sachaca (47.6%), reflecting common guest stay durations or potential owner blocking patterns.
- A notable 4.8% of properties secure long booking periods (181+ days booked per year), highlighting successful long-term rental strategies or significant owner usage.
Sachaca Airbnb Minimum Stay Requirements Analysis
Distribution of Listings by Minimum Night Requirement
1 Night
8 listings
38.1% of total
2 Nights
7 listings
33.3% of total
3 Nights
1 listings
4.8% of total
30+ Nights
5 listings
23.8% of total
Key Insights
- The most prevalent minimum stay requirement in Sachaca is 1 Night, adopted by 38.1% of listings. This highlights the market's preference for shorter, flexible bookings.
- A strong majority (71.4%) of the Sachaca Airbnb data shows acceptance of very short stays (1-2 nights), indicating a dynamic, high-turnover market.
- A significant segment (23.8%) caters to monthly stays (30+ nights) in Sachaca, pointing to opportunities in the extended-stay market.
Recommendations
- Align with the market by considering a 1 Night minimum stay, as 38.1% of Sachaca hosts use this setting.
- Explore offering discounts for stays of 30+ nights to attract the 23.8% of the market seeking extended stays.
- Adjust minimum nights based on seasonality – potentially shorter during low season and longer during peak demand periods in Sachaca.
Sachaca Airbnb Cancellation Policy Trends Analysis (2026)
Flexible
14 listings
66.7% of total
Moderate
5 listings
23.8% of total
Firm
2 listings
9.5% of total
Cancellation Policy Insights for Sachaca
- The prevailing Airbnb cancellation policy trend in Sachaca is Flexible, used by 66.7% of listings.
- The market strongly favors guest-friendly terms, with 90.5% of listings offering Flexible or Moderate policies. This suggests guests in Sachaca may expect booking flexibility.
Recommendations for Hosts
- Consider adopting a Flexible policy to align with the 66.7% market standard in Sachaca.
- Given the high prevalence of Flexible policies (66.7%), offering this can enhance booking appeal, especially during shoulder seasons.
- Regularly review your cancellation policy against competitors and market demand shifts in Sachaca.
Sachaca STR Booking Lead Time Analysis (2026)
Average Booking Lead Time by Month
Booking Lead Time Insights for Sachaca
- The overall average booking lead time for vacation rentals in Sachaca is 13 days.
- Guests book furthest in advance for stays during September (average 40 days), likely coinciding with peak travel demand or local events.
- The shortest booking windows occur for stays in March (average 5 days), indicating more last-minute travel plans during this time.
- Seasonally, Winter (25 days avg.) sees the longest lead times, while Spring (8 days avg.) has the shortest, reflecting typical travel planning cycles.
Recommendations for Hosts
- Use the overall average lead time (13 days) as a baseline for your pricing and availability strategy in Sachaca.
- For September stays, consider implementing length-of-stay discounts or slightly higher rates for bookings made less than 40 days out to capitalize on advance planning.
- During March, focus on last-minute booking availability and promotions, as guests book with very short notice (5 days avg.).
- Target marketing efforts for the Winter season well in advance (at least 25 days) to capture early planners.
- Monitor your own booking lead times against these Sachaca averages to identify opportunities for dynamic pricing adjustments.
Popular & Essential Airbnb Amenities in Sachaca (2026)
Amenity Prevalence
Amenity Insights for Sachaca
- Essential amenities in Sachaca that guests expect include: Wifi. Lacking these (this) could significantly impact bookings.
- Popular amenities like TV, Dishes and silverware, Kitchen are common but not universal. Offering these can provide a competitive edge.
Recommendations for Hosts
- Ensure your listing includes all essential amenities for Sachaca: Wifi.
- Prioritize adding missing essentials: Wifi.
- Consider adding popular differentiators like TV or Dishes and silverware to increase appeal.
- Highlight unique or less common amenities you offer (e.g., hot tub, dedicated workspace, EV charger) in your listing description and photos.
- Regularly check competitor amenities in Sachaca to stay competitive.
Sachaca Airbnb Guest Demographics & Profile Analysis (2026)
Guest Profile Summary for Sachaca
- The typical guest profile for Airbnb in Sachaca consists of primarily domestic travelers (71%), often arriving from nearby Arequipa, typically belonging to the Post-2000s (Gen Z/Alpha) group (50%), primarily speaking Spanish or English.
- Domestic travelers account for 70.8% of guests.
- Key international markets include Peru (70.8%) and United States (16.7%).
- Top languages spoken are Spanish (43.8%) followed by English (43.8%).
- A significant demographic segment is the Post-2000s (Gen Z/Alpha) group, representing 50% of guests.
Recommendations for Hosts
- Target domestic marketing efforts towards travelers from Arequipa and Cusco.
- Tailor amenities and listing descriptions to appeal to the dominant Post-2000s (Gen Z/Alpha) demographic (e.g., highlight fast WiFi, smart home features, local guides).
- Highlight unique local experiences or amenities relevant to the primary guest profile.
- Consider seasonal promotions aligned with peak travel times for key origin markets.
Nearby Short-Term Rental Market Comparison
How does the Sachaca Airbnb market stack up against its neighbors? Compare key performance metrics like average monthly revenue, ADR, and occupancy rates in surrounding areas to understand the broader regional STR landscape.
| Market | Active Properties | Monthly Revenue | Daily Rate | Avg. Occupancy |
|---|---|---|---|---|
| Mejía | 27 | $499 | $143.48 | 21% |
| Cayma | 174 | $317 | $41.46 | 36% |
| Mollendo | 74 | $291 | $86.24 | 25% |
| Yanque | 23 | $290 | $94.53 | 16% |
| Arequipa | 718 | $289 | $42.06 | 32% |
| Samuel Pastor | 63 | $280 | $133.01 | 25% |
| Cerro Colorado | 120 | $256 | $46.26 | 30% |
| Camaná | 13 | $255 | $100.77 | 21% |
| Yanahuara | 180 | $242 | $35.82 | 34% |
| Miraflores | 64 | $226 | $27.72 | 39% |