Mariano Melgar Airbnb Market Analysis 2026: Short Term Rental Data & Vacation Rental Statistics in Arequipa, Peru
Is Airbnb profitable in Mariano Melgar in 2026? Explore comprehensive Airbnb analytics for Mariano Melgar, Arequipa, Peru to uncover income potential. This 2026 STR market report for Mariano Melgar, based on AirROI data from February 2025 to January 2026, reveals key trends in the niche market of 20 active listings.
Whether you're considering an Airbnb investment in Mariano Melgar, optimizing your existing vacation rental, or exploring rental arbitrage opportunities, understanding the Mariano Melgar Airbnb data is crucial. Leveraging the low regulation environment is key to maximizing your short term rental income potential. Let's dive into the specifics.
Key Mariano Melgar Airbnb Performance Metrics Overview
Monthly Airbnb Revenue Variations & Income Potential in Mariano Melgar (2026)
Understanding the monthly revenue variations for Airbnb listings in Mariano Melgar is key to maximizing your short term rental income potential. Seasonality significantly impacts earnings. Our analysis, based on data from the past 12 months, shows that the peak revenue month for STRs in Mariano Melgar is typically May, while November often presents the lowest earnings, highlighting opportunities for strategic pricing adjustments during shoulder and low seasons. Explore the typical Airbnb income in Mariano Melgar across different performance tiers:
- Best-in-class properties (Top 10%) achieve $557+ monthly, often utilizing dynamic pricing and superior guest experiences.
- Strong performing properties (Top 25%) earn $419 or more, indicating effective management and desirable locations/amenities.
- Typical properties (Median) generate around $224 per month, representing the average market performance.
- Entry-level properties (Bottom 25%) see earnings around $110, often with potential for optimization.
Average Monthly Airbnb Earnings Trend in Mariano Melgar
Mariano Melgar Airbnb Occupancy Rate Trends (2026)
Maximize your bookings by understanding the Mariano Melgar STR occupancy trends. Seasonal demand shifts significantly influence how often properties are booked. Typically, Februarysees the highest demand (peak season occupancy), while November experiences the lowest (low season). Effective strategies, like adjusting minimum stays or offering promotions, can boost occupancy during slower periods. Here's how different property tiers perform in Mariano Melgar:
- Best-in-class properties (Top 10%) achieve 69%+ occupancy, indicating high desirability and potentially optimized availability.
- Strong performing properties (Top 25%) maintain 49% or higher occupancy, suggesting good market fit and guest satisfaction.
- Typical properties (Median) have an occupancy rate around 24%.
- Entry-level properties (Bottom 25%) average 13% occupancy, potentially facing higher vacancy.
Average Monthly Occupancy Rate Trend in Mariano Melgar
Average Daily Rate (ADR) Airbnb Trends in Mariano Melgar (2026)
Effective short term rental pricing strategy in Mariano Melgar involves understanding monthly ADR fluctuations. The Average Daily Rate (ADR) for Airbnb in Mariano Melgar typically peaks in September and dips lowest during March. Leveraging Airbnb dynamic pricing tools or strategies based on this seasonality can significantly boost revenue. Here's a look at the typical nightly rates achieved:
- Best-in-class properties (Top 10%) command rates of $41+ per night, often due to premium features or locations.
- Strong performing properties (Top 25%) achieve nightly rates of $32 or more.
- Typical properties (Median) charge around $28 per night.
- Entry-level properties (Bottom 25%) earn around $23 per night.
Average Daily Rate (ADR) Trend by Month in Mariano Melgar
Get Live Mariano Melgar Market Intelligence 👇

Explore Real-time Analytics
Airbnb Seasonality Analysis & Trends in Mariano Melgar (2026)
Peak Season (May, September, February)
- Revenue averages $378 per month
- Occupancy rates average 40.0%
- Daily rates average $31
Shoulder Season
- Revenue averages $294 per month
- Occupancy maintains around 35.0%
- Daily rates hold near $28
Low Season (October, November, December)
- Revenue drops to average $182 per month
- Occupancy decreases to average 23.0%
- Daily rates adjust to average $28
Seasonality Insights for Mariano Melgar
- The Airbnb seasonality in Mariano Melgar shows highly seasonal trends requiring careful strategy. While the sections above show seasonal averages, it's also insightful to look at the extremes:
- During the high season, the absolute peak month showcases Mariano Melgar's highest earning potential, with monthly revenues capable of climbing to $410, occupancy reaching a high of 48.7%, and ADRs peaking at $36.
- Conversely, the slowest single month of the year, typically falling within the low season, marks the market's lowest point. In this month, revenue might dip to $161, occupancy could drop to 20.0%, and ADRs may adjust down to $28.
- Understanding both the seasonal averages and these monthly peaks and troughs in revenue, occupancy, and ADR is crucial for maximizing your Airbnb profit potential in Mariano Melgar.
Seasonal Strategies for Maximizing Profit
- Peak Season: Maximize revenue through premium pricing and potentially longer minimum stays. Ensure high availability.
- Low Season: Offer competitive pricing, special promotions (e.g., extended stay discounts), and flexible cancellation policies. Target off-season travelers like remote workers or budget-conscious guests.
- Shoulder Seasons: Implement dynamic pricing that balances peak and low rates. Target weekend travelers or specific events. Offer slightly more flexible terms than peak season.
- Regularly analyze your own performance against these Mariano Melgar seasonality benchmarks and adjust your pricing and availability strategy accordingly.
Best Areas for Airbnb Investment in Mariano Melgar (2026)
Exploring the top neighborhoods for short-term rentals in Mariano Melgar? This section highlights key areas, outlining why they are attractive for hosts and guests, along with notable local attractions. Consider these locations based on your target guest profile and investment strategy.
| Neighborhood / Area | Why Host Here? (Target Guests & Appeal) | Key Attractions & Landmarks |
|---|---|---|
| Centro Histórico | The historical center of Arequipa, known for its stunning colonial architecture and vibrant cultural life. It attracts many tourists who want to experience the city’s rich history and scenic views. | Plaza de Armas, Santa Catalina Monastery, Arequipa Cathedral, Museo Santuarios Andinos, Yanahuara Viewpoint, Calle Santa Catalina |
| Yanahuara | A tranquil neighborhood that offers stunning views of the Misti volcano and is famous for its picturesque viewpoints. It's popular with tourists looking for an authentic Arequipa experience. | Yanahuara Viewpoint, Church of Yanahuara, Scenic walking paths, Local artisan markets |
| Mollendo | A beach town located near Arequipa, known for its warm weather and seaside resorts. It attracts both local and international tourists looking for beach activities. | Mollendo Beach, Los Poetas Beach, Cerro Verde National Park, Parque del Amor |
| Puerto de Arequipa | A strategic area for both business and tourism, close to the port and industrial areas. It has potential for hosting travelers involved in trade and transport. | Port facilities, Food markets, Local cultural events |
| Cayma | A residential area with a mix of local culture and beautiful views of the city and mountains. It appeals to families and long-term visitors. | Cayma Plaza, Urban parks, Local dining options |
| Socabaya | Growing neighborhood with affordable options for travelers. It offers a more local experience and is good for budget-conscious tourists. | Socabaya Aqueducts, Local markets, Traditional food spots |
| Sabandía | Known for its traditional farms and natural scenery, Sabandía offers a rustic experience just outside the city. Great for nature lovers and adventure tourism. | Sabandía Mill, Natural landscapes, Scenic hiking trails |
| Waynapicchu | A peaceful neighborhood set in nature with hiking trails and outdoor activity options, appealing to eco-tourists and adventurous travelers. | Hiking routes, Nature parks, Bird-watching spots |
Understanding Airbnb License Requirements & STR Laws in Mariano Melgar (2026)
While Mariano Melgar, Arequipa, Peru currently shows low STR regulations, specific Airbnb license requirements might still exist or change. Always verify the latest short term rental regulations and Airbnb license requirements directly with local government authorities for Mariano Melgar to ensure full compliance before hosting.
(Source: AirROI data, 2026, finding no licensed listings among those analyzed)
Top Performing Airbnb Properties in Mariano Melgar (2026)
Benchmark your potential! Explore examples of top-performing Airbnb properties in Mariano Melgarbased on Trailing Twelve Month (TTM) revenue. Analyze their characteristics, revenue, occupancy rate, and ADR to understand what drives success in this market.
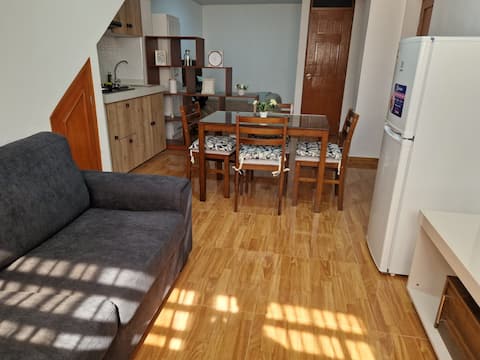
Apartment in Arequipa with a separate entrance
Entire Place • 1 bedroom
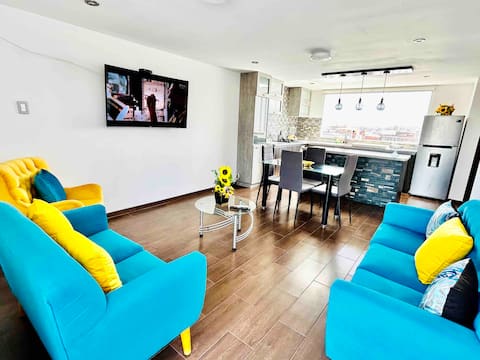
Apartment in Arequipa
Entire Place • 2 bedrooms
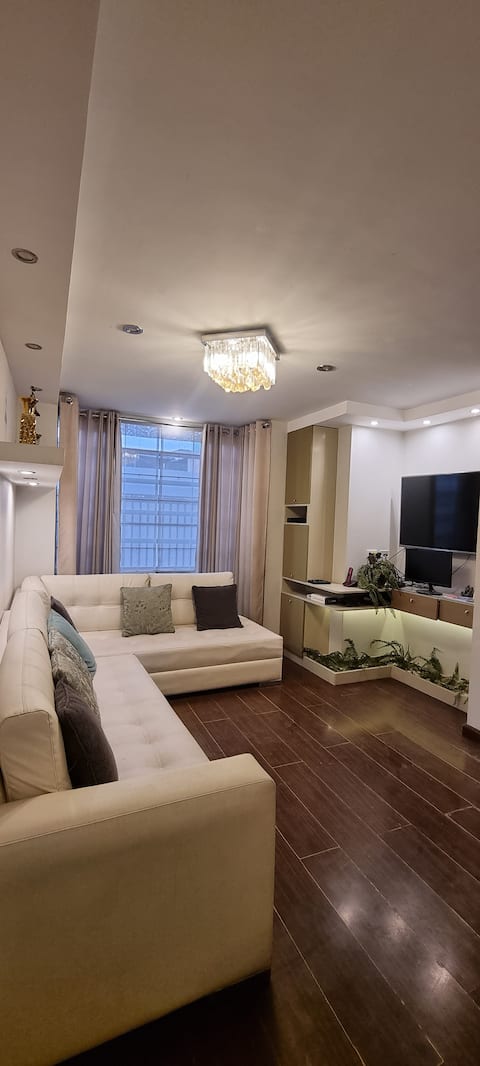
Liz's cozy apartment
Entire Place • 3 bedrooms

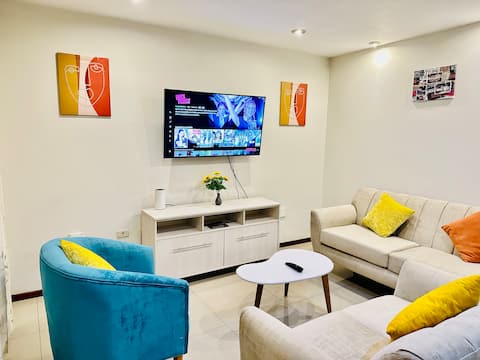
"Arequipa" Impressive Artistic Apartment
Entire Place • 2 bedrooms
"Characato" Beautiful Exclusive Apartment
Entire Place • 2 bedrooms

"Chachani" Exclusive apartment
Entire Place • 3 bedrooms
Note: Performance varies based on location, size, amenities, seasonality, and management quality. Data reflects the past 12 months.
Top Performing Airbnb Hosts in Mariano Melgar (2026)
Learn from the best! This table showcases top-performing Airbnb hosts in Mariano Melgar based on the number of properties managed and estimated total revenue over the past year. Analyze their scale and performance metrics.
| Host Name | Properties | Grossing Revenue | Stay Reviews | Avg Rating |
|---|---|---|---|---|
| Mauricio | 9 | $21,482 | 579 | 4.80/5.0 |
| Guadalupe María | 1 | $4,557 | 91 | 4.88/5.0 |
| Berly Luis | 1 | $4,430 | 110 | 4.85/5.0 |
| Daniel | 1 | $4,343 | 14 | 4.50/5.0 |
| Javier Saul | 2 | $4,104 | 84 | 4.75/5.0 |
| Jesus | 2 | $3,063 | 6 | 3.75/5.0 |
| Ana Lorena | 1 | $2,480 | 29 | 4.97/5.0 |
| Karina | 1 | $2,357 | 14 | 4.86/5.0 |
| Gladys | 1 | $738 | 18 | 4.67/5.0 |
| Juan Carlos | 1 | $188 | 41 | 4.93/5.0 |
Analyzing the strategies of top hosts, such as their property selection, pricing, and guest communication, can offer valuable lessons for optimizing your own Airbnb operations in Mariano Melgar.
Dive Deeper: Advanced Mariano Melgar STR Market Data (2026)
Ready to unlock more insights? AirROI provides access to advanced metrics and comprehensive Airbnb data for Mariano Melgar. Explore detailed analytics beyond this report to refine your investment strategy, optimize pricing, and maximize your vacation rental profits.
Explore Advanced MetricsMariano Melgar Short-Term Rental Market Composition (2026): Property & Room Types
Room Type Distribution
Property Type Distribution
Market Composition Insights for Mariano Melgar
- The Mariano Melgar Airbnb market composition is heavily skewed towards Entire Home/Apt listings, which make up 100% of the 20 active rentals. This indicates strong guest preference for privacy and space.
- Looking at the property type distribution in Mariano Melgar, Apartment/Condo properties are the most common (95%), reflecting the local real estate landscape.
Mariano Melgar Airbnb Room Capacity Analysis (2026): Bedroom Distribution
Distribution of Listings by Number of Bedrooms
Room Capacity Insights for Mariano Melgar
- The dominant room capacity in Mariano Melgar is 2 bedrooms listings, making up 40% of the market. This suggests a strong demand for properties suitable for couples or solo travelers.
- Together, 2 bedrooms and 1 bedroom properties represent 75.0% of the active Airbnb listings in Mariano Melgar, indicating a high concentration in these sizes.
Mariano Melgar Vacation Rental Guest Capacity Trends (2026)
Distribution of Listings by Guest Capacity
Guest Capacity Insights for Mariano Melgar
- The most common guest capacity trend in Mariano Melgar vacation rentals is listings accommodating 4 guests (45%). This suggests the primary traveler segment is likely small families or groups.
- Properties designed for 4 guests and 3 guests dominate the Mariano Melgar STR market, accounting for 60.0% of listings.
- On average, properties in Mariano Melgar are equipped to host 3.6 guests.
Mariano Melgar Airbnb Booking Patterns (2026): Available vs. Booked Days
Available Days Distribution
Booked Days Distribution
Booking Pattern Insights for Mariano Melgar
- The most common availability pattern in Mariano Melgar falls within the 271-366 days range, representing 60% of listings. This suggests many properties have significant open periods on their calendars.
- Approximately 90.0% of listings show high availability (181+ days open annually), indicating potential for increased bookings or specific owner usage patterns.
- For booked days, the 31-90 days range is most frequent in Mariano Melgar (40%), reflecting common guest stay durations or potential owner blocking patterns.
- A notable 10.0% of properties secure long booking periods (181+ days booked per year), highlighting successful long-term rental strategies or significant owner usage.
Mariano Melgar Airbnb Minimum Stay Requirements Analysis
Distribution of Listings by Minimum Night Requirement
1 Night
2 listings
10% of total
2 Nights
12 listings
60% of total
30+ Nights
6 listings
30% of total
Key Insights
- The most prevalent minimum stay requirement in Mariano Melgar is 2 Nights, adopted by 60% of listings. This highlights the market's preference for shorter, flexible bookings.
- A strong majority (70.0%) of the Mariano Melgar Airbnb data shows acceptance of very short stays (1-2 nights), indicating a dynamic, high-turnover market.
- A significant segment (30%) caters to monthly stays (30+ nights) in Mariano Melgar, pointing to opportunities in the extended-stay market.
Recommendations
- Align with the market by considering a 2 Nights minimum stay, as 60% of Mariano Melgar hosts use this setting.
- If feasible, allowing 1-night stays, especially midweek or during low season, could capture last-minute bookings, as only 10% currently do.
- A 2-night minimum appears standard (60%). Consider this for weekends or peak periods.
- Explore offering discounts for stays of 30+ nights to attract the 30% of the market seeking extended stays.
- Adjust minimum nights based on seasonality – potentially shorter during low season and longer during peak demand periods in Mariano Melgar.
Mariano Melgar Airbnb Cancellation Policy Trends Analysis (2026)
Flexible
7 listings
35% of total
Moderate
10 listings
50% of total
Firm
3 listings
15% of total
Cancellation Policy Insights for Mariano Melgar
- The prevailing Airbnb cancellation policy trend in Mariano Melgar is Moderate, used by 50% of listings.
- The market strongly favors guest-friendly terms, with 85.0% of listings offering Flexible or Moderate policies. This suggests guests in Mariano Melgar may expect booking flexibility.
Recommendations for Hosts
- Consider adopting a Moderate policy to align with the 50% market standard in Mariano Melgar.
- Regularly review your cancellation policy against competitors and market demand shifts in Mariano Melgar.
Mariano Melgar STR Booking Lead Time Analysis (2026)
Average Booking Lead Time by Month
Booking Lead Time Insights for Mariano Melgar
- The overall average booking lead time for vacation rentals in Mariano Melgar is 19 days.
- Guests book furthest in advance for stays during January (average 35 days), likely coinciding with peak travel demand or local events.
- The shortest booking windows occur for stays in November (average 3 days), indicating more last-minute travel plans during this time.
- Seasonally, Winter (21 days avg.) sees the longest lead times, while Spring (10 days avg.) has the shortest, reflecting typical travel planning cycles.
Recommendations for Hosts
- Use the overall average lead time (19 days) as a baseline for your pricing and availability strategy in Mariano Melgar.
- For January stays, consider implementing length-of-stay discounts or slightly higher rates for bookings made less than 35 days out to capitalize on advance planning.
- During November, focus on last-minute booking availability and promotions, as guests book with very short notice (3 days avg.).
- Target marketing efforts for the Winter season well in advance (at least 21 days) to capture early planners.
- Monitor your own booking lead times against these Mariano Melgar averages to identify opportunities for dynamic pricing adjustments.
Popular & Essential Airbnb Amenities in Mariano Melgar (2026)
Amenity Prevalence
Amenity Insights for Mariano Melgar
- Essential amenities in Mariano Melgar that guests expect include: Kitchen, Wifi, TV. Lacking these (any) could significantly impact bookings.
- Popular amenities like Washer, First aid kit, Dishes and silverware are common but not universal. Offering these can provide a competitive edge.
Recommendations for Hosts
- Ensure your listing includes all essential amenities for Mariano Melgar: Kitchen, Wifi, TV.
- Consider adding popular differentiators like Washer or First aid kit to increase appeal.
- Highlight unique or less common amenities you offer (e.g., hot tub, dedicated workspace, EV charger) in your listing description and photos.
- Regularly check competitor amenities in Mariano Melgar to stay competitive.
Mariano Melgar Airbnb Guest Demographics & Profile Analysis (2026)
Guest Profile Summary for Mariano Melgar
- The typical guest profile for Airbnb in Mariano Melgar consists of primarily domestic travelers (75%), often arriving from nearby Lima, typically belonging to the Post-2000s (Gen Z/Alpha) group (50%), primarily speaking Spanish or English.
- Domestic travelers account for 75.0% of guests.
- Key international markets include Peru (75%) and United States (10.7%).
- Top languages spoken are Spanish (48.6%) followed by English (34.3%).
- A significant demographic segment is the Post-2000s (Gen Z/Alpha) group, representing 50% of guests.
Recommendations for Hosts
- Target domestic marketing efforts towards travelers from Lima and Arequipa.
- Tailor amenities and listing descriptions to appeal to the dominant Post-2000s (Gen Z/Alpha) demographic (e.g., highlight fast WiFi, smart home features, local guides).
- Highlight unique local experiences or amenities relevant to the primary guest profile.
- Consider seasonal promotions aligned with peak travel times for key origin markets.
Nearby Short-Term Rental Market Comparison
How does the Mariano Melgar Airbnb market stack up against its neighbors? Compare key performance metrics like average monthly revenue, ADR, and occupancy rates in surrounding areas to understand the broader regional STR landscape.
| Market | Active Properties | Monthly Revenue | Daily Rate | Avg. Occupancy |
|---|---|---|---|---|
| Mejía | 27 | $499 | $143.48 | 21% |
| Cayma | 174 | $317 | $41.46 | 36% |
| Mollendo | 74 | $291 | $86.24 | 25% |
| Yanque | 23 | $290 | $94.53 | 16% |
| Arequipa | 718 | $289 | $42.06 | 32% |
| Samuel Pastor | 63 | $280 | $133.01 | 25% |
| Cerro Colorado | 120 | $256 | $46.26 | 30% |
| Camaná | 13 | $255 | $100.77 | 21% |
| Yanahuara | 180 | $242 | $35.82 | 34% |
| Sachaca | 21 | $236 | $35.87 | 28% |