Chivay Airbnb Market Analysis 2025: Short Term Rental Data & Vacation Rental Statistics in Arequipa, Peru
Is Airbnb profitable in Chivay in 2025? Explore comprehensive Airbnb analytics for Chivay, Arequipa, Peru to uncover income potential. This 2025 STR market report for Chivay, based on AirROI data from November 2024 to October 2025, reveals key trends in the niche market of 19 active listings.
Whether you're considering an Airbnb investment in Chivay, optimizing your existing vacation rental, or exploring rental arbitrage opportunities, understanding the Chivay Airbnb data is crucial. Leveraging the low regulation environment is key to maximizing your short term rental income potential. Let's dive into the specifics.
Key Chivay Airbnb Performance Metrics Overview
Monthly Airbnb Revenue Variations & Income Potential in Chivay (2025)
Understanding the monthly revenue variations for Airbnb listings in Chivay is key to maximizing your short term rental income potential. Seasonality significantly impacts earnings. Our analysis, based on data from the past 12 months, shows that the peak revenue month for STRs in Chivay is typically September, while November often presents the lowest earnings, highlighting opportunities for strategic pricing adjustments during shoulder and low seasons. Explore the typical Airbnb income in Chivay across different performance tiers:
- Best-in-class properties (Top 10%) achieve $293+ monthly, often utilizing dynamic pricing and superior guest experiences.
- Strong performing properties (Top 25%) earn $188 or more, indicating effective management and desirable locations/amenities.
- Typical properties (Median) generate around $115 per month, representing the average market performance.
- Entry-level properties (Bottom 25%) see earnings around $57, often with potential for optimization.
Average Monthly Airbnb Earnings Trend in Chivay
Chivay Airbnb Occupancy Rate Trends (2025)
Maximize your bookings by understanding the Chivay STR occupancy trends. Seasonal demand shifts significantly influence how often properties are booked. Typically, Marchsees the highest demand (peak season occupancy), while November experiences the lowest (low season). Effective strategies, like adjusting minimum stays or offering promotions, can boost occupancy during slower periods. Here's how different property tiers perform in Chivay:
- Best-in-class properties (Top 10%) achieve 36%+ occupancy, indicating high desirability and potentially optimized availability.
- Strong performing properties (Top 25%) maintain 28% or higher occupancy, suggesting good market fit and guest satisfaction.
- Typical properties (Median) have an occupancy rate around 17%.
- Entry-level properties (Bottom 25%) average 8% occupancy, potentially facing higher vacancy.
Average Monthly Occupancy Rate Trend in Chivay
Average Daily Rate (ADR) Airbnb Trends in Chivay (2025)
Effective short term rental pricing strategy in Chivay involves understanding monthly ADR fluctuations. The Average Daily Rate (ADR) for Airbnb in Chivay typically peaks in October and dips lowest during December. Leveraging Airbnb dynamic pricing tools or strategies based on this seasonality can significantly boost revenue. Here's a look at the typical nightly rates achieved:
- Best-in-class properties (Top 10%) command rates of $62+ per night, often due to premium features or locations.
- Strong performing properties (Top 25%) achieve nightly rates of $35 or more.
- Typical properties (Median) charge around $22 per night.
- Entry-level properties (Bottom 25%) earn around $17 per night.
Average Daily Rate (ADR) Trend by Month in Chivay
Get Live Chivay Market Intelligence 👇
Explore Real-time Analytics
Airbnb Seasonality Analysis & Trends in Chivay (2025)
Peak Season (September, March, July)
- Revenue averages $199 per month
- Occupancy rates average 27.5%
- Daily rates average $32
Shoulder Season
- Revenue averages $140 per month
- Occupancy maintains around 19.5%
- Daily rates hold near $32
Low Season (January, June, November)
- Revenue drops to average $90 per month
- Occupancy decreases to average 11.6%
- Daily rates adjust to average $31
Seasonality Insights for Chivay
- The Airbnb seasonality in Chivay shows highly seasonal trends requiring careful strategy. While the sections above show seasonal averages, it's also insightful to look at the extremes:
- During the high season, the absolute peak month showcases Chivay's highest earning potential, with monthly revenues capable of climbing to $205, occupancy reaching a high of 32.7%, and ADRs peaking at $34.
- Conversely, the slowest single month of the year, typically falling within the low season, marks the market's lowest point. In this month, revenue might dip to $72, occupancy could drop to 8.9%, and ADRs may adjust down to $30.
- Understanding both the seasonal averages and these monthly peaks and troughs in revenue, occupancy, and ADR is crucial for maximizing your Airbnb profit potential in Chivay.
Seasonal Strategies for Maximizing Profit
- Peak Season: Maximize revenue through premium pricing and potentially longer minimum stays. Ensure high availability.
- Low Season: Offer competitive pricing, special promotions (e.g., extended stay discounts), and flexible cancellation policies. Target off-season travelers like remote workers or budget-conscious guests.
- Shoulder Seasons: Implement dynamic pricing that balances peak and low rates. Target weekend travelers or specific events. Offer slightly more flexible terms than peak season.
- Regularly analyze your own performance against these Chivay seasonality benchmarks and adjust your pricing and availability strategy accordingly.
Best Areas for Airbnb Investment in Chivay (2025)
Exploring the top neighborhoods for short-term rentals in Chivay? This section highlights key areas, outlining why they are attractive for hosts and guests, along with notable local attractions. Consider these locations based on your target guest profile and investment strategy.
| Neighborhood / Area | Why Host Here? (Target Guests & Appeal) | Key Attractions & Landmarks |
|---|---|---|
| Colca Canyon | One of the most famous tourist destinations in Peru, known for its stunning scenery, hiking opportunities, and the chance to see condors in flight. A prime location for tourists seeking nature experiences and adventure activities. | Colca Canyon, Cruz del Condor, Chivay hot springs, El Pueblo de Chivay, Camelids park |
| Chivay Town Center | The main town in the Colca Valley, Chivay offers a range of amenities for tourists including restaurants, markets, and cultural experiences. It serves as a base for exploring the Colca Canyon. | Chivay Market, Chivay Church, Thermal baths of La Calera, Local artisan shops, Cultural festivals |
| Ushuaia | A lesser-known gem close to Chivay, known for its stunning mountain views and rural charm. Ideal for travelers looking for a peaceful retreat away from busy tourist spots. | Ushuaia viewpoints, Local hiking trails, Traditional cuisine, Farm tours, Cultural immersion experiences |
| Cabanaconde | A small village located at the edge of the Colca Canyon, Cabanaconde offers direct access to hiking trails and breathtaking views. Popular with adventurers and nature enthusiasts. | Hiking trails to Colca Canyon, Cabanaconde viewpoint, Local cultural experiences, Traditional festivals, Stargazing opportunities |
| Yanque | Known for its beautiful colonial architecture and traditional dancing, Yanque is a small town ideal for tourists looking to experience local culture and history. It's also near to hot springs. | Yanque Church, Traditional dances, Hot springs nearby, Local handicrafts, Scenic viewpoints |
| Organi | A quieter area that's perfect for nature lovers and those seeking tranquility away from the main tourist crowds. Great for outdoor activities like hiking and birdwatching. | Birdwatching opportunities, Scenic landscapes, Nature trails, Peaceful atmosphere, Rural community experiences |
| Macario Condor | Famous for bird watching and adventure sports like mountain biking. It's a unique area that appeals to sport enthusiasts and nature lovers alike. | Condor sightings, Mountain biking tours, Beautiful landscapes, Cultural experiences, Photography spots |
| Sibayo | A rural community providing insight into traditional Andean life. The area is rich in culture and history, offering a unique experience for those interested in authentic local experiences. | Sibayo Church, Local farming tours, Cultural exchanges, Hiking in the countryside, Festivals and traditions |
Understanding Airbnb License Requirements & STR Laws in Chivay (2025)
While Chivay, Arequipa, Peru currently shows low STR regulations, specific Airbnb license requirements might still exist or change. Always verify the latest short term rental regulations and Airbnb license requirements directly with local government authorities for Chivay to ensure full compliance before hosting.
(Source: AirROI data, 2025, finding no licensed listings among those analyzed)
Top Performing Airbnb Properties in Chivay (2025)
Benchmark your potential! Explore examples of top-performing Airbnb properties in Chivaybased on Trailing Twelve Month (TTM) revenue. Analyze their characteristics, revenue, occupancy rate, and ADR to understand what drives success in this market.
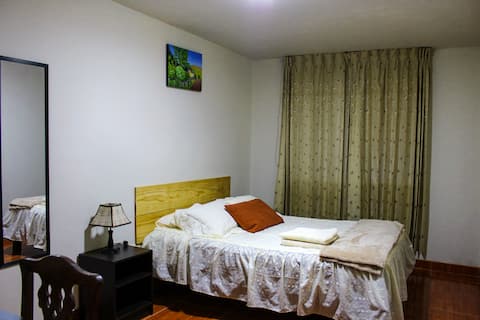
Apartamento Colca's Home
Entire Place • 2 bedrooms
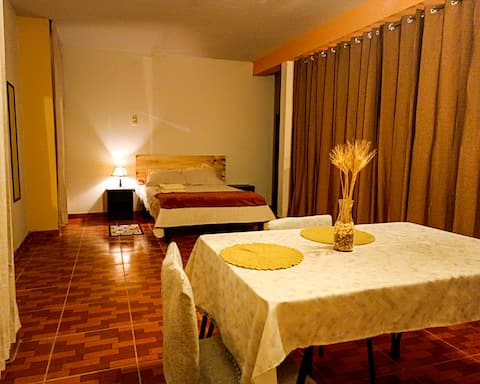
Your Apartment in the Colca
Entire Place • 1 bedroom

Little house with kitchen and garden.
Entire Place • 2 bedrooms
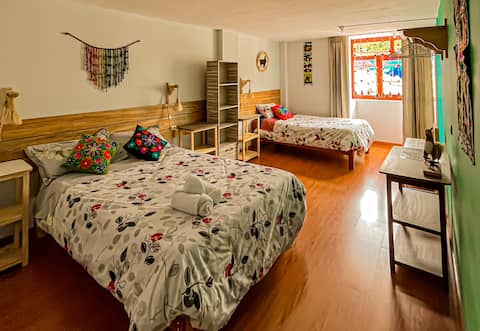
Apartment with bathroom, private kitchen.
Entire Place • 1 bedroom

Room and kitchen just for you
Entire Place • 1 bedroom

Private guest house with a nice view
Entire Place • 1 bedroom
Note: Performance varies based on location, size, amenities, seasonality, and management quality. Data reflects the past 12 months.
Top Performing Airbnb Hosts in Chivay (2025)
Learn from the best! This table showcases top-performing Airbnb hosts in Chivay based on the number of properties managed and estimated total revenue over the past year. Analyze their scale and performance metrics.
| Host Name | Properties | Grossing Revenue | Stay Reviews | Avg Rating |
|---|---|---|---|---|
| Liz | 2 | $6,303 | 70 | 4.96/5.0 |
| Alely | 4 | $6,079 | 93 | 4.92/5.0 |
| Detan | 1 | $1,432 | 29 | 4.97/5.0 |
| Hilber | 3 | $1,133 | 37 | 4.74/5.0 |
| José Luis | 2 | $1,058 | 44 | 4.62/5.0 |
| Rivelino | 1 | $829 | 38 | 4.58/5.0 |
| Host #483229144 | 1 | $563 | 1 | Not Rated |
| Veronica | 2 | $392 | 27 | 4.75/5.0 |
| Huberlinda Elena | 1 | $322 | 10 | 4.60/5.0 |
| Samana | 1 | $165 | 20 | 4.45/5.0 |
Analyzing the strategies of top hosts, such as their property selection, pricing, and guest communication, can offer valuable lessons for optimizing your own Airbnb operations in Chivay.
Dive Deeper: Advanced Chivay STR Market Data (2025)
Ready to unlock more insights? AirROI provides access to advanced metrics and comprehensive Airbnb data for Chivay. Explore detailed analytics beyond this report to refine your investment strategy, optimize pricing, and maximize your vacation rental profits.
Explore Advanced MetricsChivay Short-Term Rental Market Composition (2025): Property & Room Types
Room Type Distribution
Property Type Distribution
Market Composition Insights for Chivay
- The Chivay Airbnb market composition is heavily skewed towards Entire Home/Apt listings, which make up 52.6% of the 19 active rentals. This indicates strong guest preference for privacy and space.
- However, a notable 47.4% share for Private Rooms suggests opportunities for budget-conscious travelers or hosts renting out spare rooms.
- Looking at the property type distribution in Chivay, House properties are the most common (42.1%), reflecting the local real estate landscape.
- Houses represent a significant 42.1% portion, catering likely to families or larger groups.
- The presence of 26.3% Hotel/Boutique listings indicates integration with traditional hospitality.
Chivay Airbnb Room Capacity Analysis (2025): Bedroom Distribution
Distribution of Listings by Number of Bedrooms
Room Capacity Insights for Chivay
- The dominant room capacity in Chivay is 1 bedroom listings, making up 36.8% of the market. This suggests a strong demand for properties suitable for couples or solo travelers.
- Together, 1 bedroom and 2 bedrooms properties represent 63.1% of the active Airbnb listings in Chivay, indicating a high concentration in these sizes.
- A significant 21.1% of listings offer 3+ bedrooms, catering to larger groups and families seeking more space in Chivay.
Chivay Vacation Rental Guest Capacity Trends (2025)
Distribution of Listings by Guest Capacity
Guest Capacity Insights for Chivay
- The most common guest capacity trend in Chivay vacation rentals is listings accommodating 3 guests (26.3%). This suggests the primary traveler segment is likely small families or groups.
- Properties designed for 3 guests and 4 guests dominate the Chivay STR market, accounting for 47.4% of listings.
- 15.8% of properties accommodate 6+ guests, serving the market segment for larger families or group travel in Chivay.
- On average, properties in Chivay are equipped to host 3.0 guests.
Chivay Airbnb Booking Patterns (2025): Available vs. Booked Days
Available Days Distribution
Booked Days Distribution
Booking Pattern Insights for Chivay
- The most common availability pattern in Chivay falls within the 271-366 days range, representing 89.5% of listings. This suggests many properties have significant open periods on their calendars.
- Approximately 100.0% of listings show high availability (181+ days open annually), indicating potential for increased bookings or specific owner usage patterns.
- For booked days, the 1-30 days range is most frequent in Chivay (63.2%), reflecting common guest stay durations or potential owner blocking patterns.
Chivay Airbnb Minimum Stay Requirements Analysis
Distribution of Listings by Minimum Night Requirement
1 Night
19 listings
100% of total
Key Insights
- The most prevalent minimum stay requirement in Chivay is 1 Night, adopted by 100% of listings. This highlights the market's preference for shorter, flexible bookings.
- A strong majority (100.0%) of the Chivay Airbnb data shows acceptance of very short stays (1-2 nights), indicating a dynamic, high-turnover market.
Recommendations
- Align with the market by considering a 1 Night minimum stay, as 100% of Chivay hosts use this setting.
- Adjust minimum nights based on seasonality – potentially shorter during low season and longer during peak demand periods in Chivay.
Chivay Airbnb Cancellation Policy Trends Analysis (2025)
Flexible
15 listings
83.3% of total
Moderate
3 listings
16.7% of total
Cancellation Policy Insights for Chivay
- The prevailing Airbnb cancellation policy trend in Chivay is Flexible, used by 83.3% of listings.
- The market strongly favors guest-friendly terms, with 100.0% of listings offering Flexible or Moderate policies. This suggests guests in Chivay may expect booking flexibility.
Recommendations for Hosts
- Consider adopting a Flexible policy to align with the 83.3% market standard in Chivay.
- Given the high prevalence of Flexible policies (83.3%), offering this can enhance booking appeal, especially during shoulder seasons.
- Regularly review your cancellation policy against competitors and market demand shifts in Chivay.
Chivay STR Booking Lead Time Analysis (2025)
Average Booking Lead Time by Month
Booking Lead Time Insights for Chivay
- The overall average booking lead time for vacation rentals in Chivay is 19 days.
- Guests book furthest in advance for stays during August (average 32 days), likely coinciding with peak travel demand or local events.
- The shortest booking windows occur for stays in February (average 6 days), indicating more last-minute travel plans during this time.
- Seasonally, Summer (25 days avg.) sees the longest lead times, while Winter (10 days avg.) has the shortest, reflecting typical travel planning cycles.
Recommendations for Hosts
- Use the overall average lead time (19 days) as a baseline for your pricing and availability strategy in Chivay.
- For August stays, consider implementing length-of-stay discounts or slightly higher rates for bookings made less than 32 days out to capitalize on advance planning.
- During February, focus on last-minute booking availability and promotions, as guests book with very short notice (6 days avg.).
- Target marketing efforts for the Summer season well in advance (at least 25 days) to capture early planners.
- Monitor your own booking lead times against these Chivay averages to identify opportunities for dynamic pricing adjustments.
Popular & Essential Airbnb Amenities in Chivay (2025)
Amenity Prevalence
Amenity Insights for Chivay
- Popular amenities like Wifi, Dishes and silverware, Extra pillows and blankets are common but not universal. Offering these can provide a competitive edge.
- Warning: Wifi is not universally provided but is considered essential globally. Ensure reliable Wifi is offered.
Recommendations for Hosts
- Consider adding popular differentiators like Wifi or Dishes and silverware to increase appeal.
- Highlight unique or less common amenities you offer (e.g., hot tub, dedicated workspace, EV charger) in your listing description and photos.
- Regularly check competitor amenities in Chivay to stay competitive.
Chivay Airbnb Guest Demographics & Profile Analysis (2025)
Guest Profile Summary for Chivay
- The typical guest profile for Airbnb in Chivay consists of predominantly international visitors (83%), with top international origins including Peru, typically belonging to the Post-2000s (Gen Z/Alpha) group (50%), primarily speaking English or Spanish.
- Domestic travelers account for 16.8% of guests.
- Key international markets include France (28.7%) and Peru (16.8%).
- Top languages spoken are English (35.8%) followed by Spanish (29.9%).
- A significant demographic segment is the Post-2000s (Gen Z/Alpha) group, representing 50% of guests.
Recommendations for Hosts
- Focus marketing internationally, particularly towards travelers from Peru.
- Tailor amenities and listing descriptions to appeal to the dominant Post-2000s (Gen Z/Alpha) demographic (e.g., highlight fast WiFi, smart home features, local guides).
- Highlight unique local experiences or amenities relevant to the primary guest profile.
- Consider seasonal promotions aligned with peak travel times for key origin markets.
Nearby Short-Term Rental Market Comparison
How does the Chivay Airbnb market stack up against its neighbors? Compare key performance metrics like average monthly revenue, ADR, and occupancy rates in surrounding areas to understand the broader regional STR landscape.
| Market | Active Properties | Monthly Revenue | Daily Rate | Avg. Occupancy |
|---|---|---|---|---|
| Camaná | 13 | $355 | $107.02 | 24% |
| Samuel Pastor | 57 | $346 | $137.62 | 24% |
| Cayma | 170 | $332 | $41.67 | 36% |
| Arequipa | 620 | $327 | $43.80 | 33% |
| Sachaca | 21 | $289 | $37.55 | 27% |
| Yanahuara | 181 | $259 | $35.93 | 34% |
| Cerro Colorado | 126 | $250 | $44.19 | 29% |
| Miraflores | 63 | $235 | $28.14 | 40% |
| Mariano Melgar | 20 | $229 | $27.86 | 35% |
| José Luis Bustamante y Rivero | 111 | $228 | $35.88 | 32% |