San Lorenzo Airbnb Market Analysis 2026: Short Term Rental Data & Vacation Rental Statistics in Central Department, Paraguay
Is Airbnb profitable in San Lorenzo in 2026? Explore comprehensive Airbnb analytics for San Lorenzo, Central Department, Paraguay to uncover income potential. This 2026 STR market report for San Lorenzo, based on AirROI data from February 2025 to January 2026, reveals key trends in the niche market of 43 active listings.
Whether you're considering an Airbnb investment in San Lorenzo, optimizing your existing vacation rental, or exploring rental arbitrage opportunities, understanding the San Lorenzo Airbnb data is crucial. Leveraging the low regulation environment is key to maximizing your short term rental income potential. Let's dive into the specifics.
Key San Lorenzo Airbnb Performance Metrics Overview
Monthly Airbnb Revenue Variations & Income Potential in San Lorenzo (2026)
Understanding the monthly revenue variations for Airbnb listings in San Lorenzo is key to maximizing your short term rental income potential. Seasonality significantly impacts earnings. Our analysis, based on data from the past 12 months, shows that the peak revenue month for STRs in San Lorenzo is typically April, while January often presents the lowest earnings, highlighting opportunities for strategic pricing adjustments during shoulder and low seasons. Explore the typical Airbnb income in San Lorenzo across different performance tiers:
- Best-in-class properties (Top 10%) achieve $997+ monthly, often utilizing dynamic pricing and superior guest experiences.
- Strong performing properties (Top 25%) earn $564 or more, indicating effective management and desirable locations/amenities.
- Typical properties (Median) generate around $369 per month, representing the average market performance.
- Entry-level properties (Bottom 25%) see earnings around $183, often with potential for optimization.
Average Monthly Airbnb Earnings Trend in San Lorenzo
San Lorenzo Airbnb Occupancy Rate Trends (2026)
Maximize your bookings by understanding the San Lorenzo STR occupancy trends. Seasonal demand shifts significantly influence how often properties are booked. Typically, Februarysees the highest demand (peak season occupancy), while January experiences the lowest (low season). Effective strategies, like adjusting minimum stays or offering promotions, can boost occupancy during slower periods. Here's how different property tiers perform in San Lorenzo:
- Best-in-class properties (Top 10%) achieve 77%+ occupancy, indicating high desirability and potentially optimized availability.
- Strong performing properties (Top 25%) maintain 59% or higher occupancy, suggesting good market fit and guest satisfaction.
- Typical properties (Median) have an occupancy rate around 37%.
- Entry-level properties (Bottom 25%) average 16% occupancy, potentially facing higher vacancy.
Average Monthly Occupancy Rate Trend in San Lorenzo
Average Daily Rate (ADR) Airbnb Trends in San Lorenzo (2026)
Effective short term rental pricing strategy in San Lorenzo involves understanding monthly ADR fluctuations. The Average Daily Rate (ADR) for Airbnb in San Lorenzo typically peaks in December and dips lowest during September. Leveraging Airbnb dynamic pricing tools or strategies based on this seasonality can significantly boost revenue. Here's a look at the typical nightly rates achieved:
- Best-in-class properties (Top 10%) command rates of $62+ per night, often due to premium features or locations.
- Strong performing properties (Top 25%) achieve nightly rates of $37 or more.
- Typical properties (Median) charge around $29 per night.
- Entry-level properties (Bottom 25%) earn around $23 per night.
Average Daily Rate (ADR) Trend by Month in San Lorenzo
Get Live San Lorenzo Market Intelligence 👇

Explore Real-time Analytics
Airbnb Seasonality Analysis & Trends in San Lorenzo (2026)
Peak Season (April, March, October)
- Revenue averages $556 per month
- Occupancy rates average 43.4%
- Daily rates average $43
Shoulder Season
- Revenue averages $438 per month
- Occupancy maintains around 41.9%
- Daily rates hold near $43
Low Season (January, May, November)
- Revenue drops to average $343 per month
- Occupancy decreases to average 31.3%
- Daily rates adjust to average $43
Seasonality Insights for San Lorenzo
- The Airbnb seasonality in San Lorenzo shows highly seasonal trends requiring careful strategy. While the sections above show seasonal averages, it's also insightful to look at the extremes:
- During the high season, the absolute peak month showcases San Lorenzo's highest earning potential, with monthly revenues capable of climbing to $655, occupancy reaching a high of 49.7%, and ADRs peaking at $45.
- Conversely, the slowest single month of the year, typically falling within the low season, marks the market's lowest point. In this month, revenue might dip to $277, occupancy could drop to 26.2%, and ADRs may adjust down to $41.
- Understanding both the seasonal averages and these monthly peaks and troughs in revenue, occupancy, and ADR is crucial for maximizing your Airbnb profit potential in San Lorenzo.
Seasonal Strategies for Maximizing Profit
- Peak Season: Maximize revenue through premium pricing and potentially longer minimum stays. Ensure high availability.
- Low Season: Offer competitive pricing, special promotions (e.g., extended stay discounts), and flexible cancellation policies. Target off-season travelers like remote workers or budget-conscious guests.
- Shoulder Seasons: Implement dynamic pricing that balances peak and low rates. Target weekend travelers or specific events. Offer slightly more flexible terms than peak season.
- Regularly analyze your own performance against these San Lorenzo seasonality benchmarks and adjust your pricing and availability strategy accordingly.
Best Areas for Airbnb Investment in San Lorenzo (2026)
Exploring the top neighborhoods for short-term rentals in San Lorenzo? This section highlights key areas, outlining why they are attractive for hosts and guests, along with notable local attractions. Consider these locations based on your target guest profile and investment strategy.
| Neighborhood / Area | Why Host Here? (Target Guests & Appeal) | Key Attractions & Landmarks |
|---|---|---|
| San Lorenzo Centro | The bustling center of San Lorenzo, known for its accessibility and range of amenities. Ideal for both business travelers and families looking for comfort and convenience. | Plaza del Futuro, San Lorenzo Shopping, local markets, Cultural Center, Parish of San Lorenzo |
| Villa Aurelia | A residential area known for its family-friendly atmosphere and green spaces. Attracts visitors looking for a quiet and relaxing stay close to nature. | Parque Ñu Guasu, Cerro Cora National Park, local cafes, family parks |
| Capiatá | Located nearby, Capiatá offers a mix of urban conveniences and rural charm. Great for tourists who want to explore both San Lorenzo and the surrounding areas. | Capiatá Church, Capiatá Shopping Center, local artisanal shops, nature trails |
| Luque | A neighboring city that serves as an excellent hub for visiting both Asunción and San Lorenzo. Popular among those seeking more affordable options. | Asunción International Airport, Parque del Agua, Cultural activities, Local festivals |
| San Francisco | A quiet suburb with a strong sense of community and various local shops. Ideal for visitors looking for a longer stay. | Local markets, Community events, Parks, Traditional cuisine spots |
| Ypane | A vibrant town with a rich cultural history, attracting those interested in local Paraguayan culture and traditions. | Cultural events, Historical sites, Local artisan crafts |
| Paraguarí | A bit further but known for its natural beauty and outdoor activities. Attracts nature lovers and adventurers. | Sierra de Maracaju, Hiking trails, Local waterfalls |
| Areguá | Famous for its picturesque scenery and artistic vibe. Ideal for tourists looking for a charming getaway with plenty of photo opportunities. | Lake Areguá, Artisan markets, Historic architecture, Cultural festivals |
Understanding Airbnb License Requirements & STR Laws in San Lorenzo (2026)
While San Lorenzo, Central Department, Paraguay currently shows low STR regulations, specific Airbnb license requirements might still exist or change. Always verify the latest short term rental regulations and Airbnb license requirements directly with local government authorities for San Lorenzo to ensure full compliance before hosting.
(Source: AirROI data, 2026, based on 2% licensed listings)
Top Performing Airbnb Properties in San Lorenzo (2026)
Benchmark your potential! Explore examples of top-performing Airbnb properties in San Lorenzobased on Trailing Twelve Month (TTM) revenue. Analyze their characteristics, revenue, occupancy rate, and ADR to understand what drives success in this market.

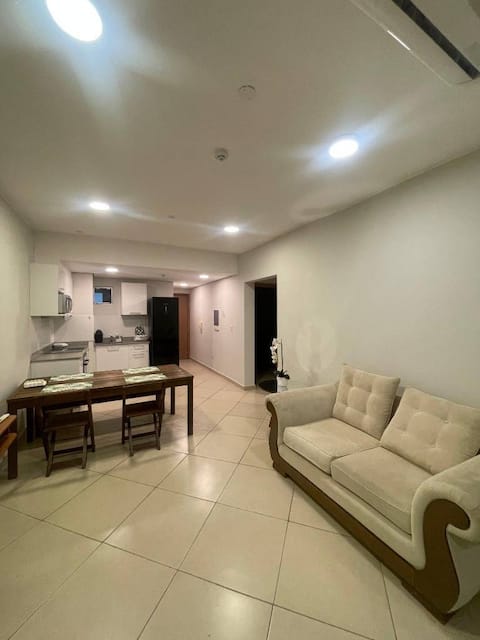
Diosa Blanca-Ideal for families-Large Space
Entire Place • 3 bedrooms
Full modern space
Entire Place • 2 bedrooms
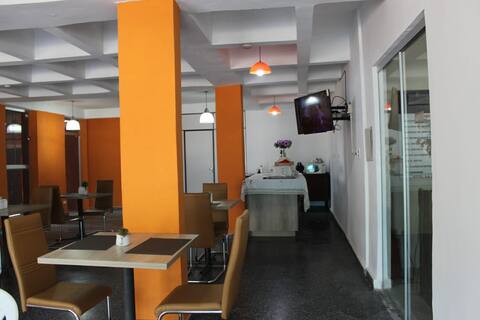
Double room in a hotel
Private Room • N/A
45 minutes from the Defensores del Chaco Stadium
Entire Place • 1 bedroom

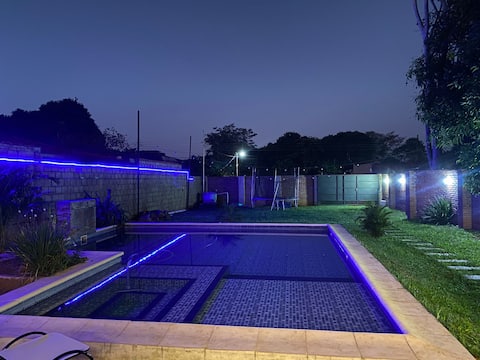
BEAUTIFUL 2 BEDROOM APARTMENT WITH PRIVATE GARAGE
Entire Place • 2 bedrooms
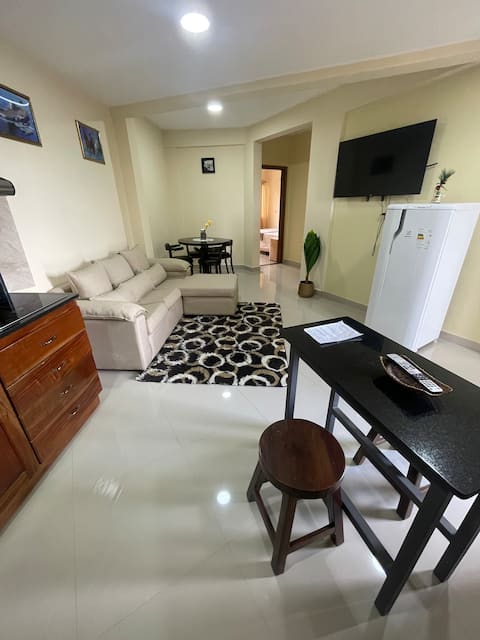
Comfortable, spacious and quiet apartment. SL (3A)
Entire Place • 2 bedrooms
Note: Performance varies based on location, size, amenities, seasonality, and management quality. Data reflects the past 12 months.
Top Performing Airbnb Hosts in San Lorenzo (2026)
Learn from the best! This table showcases top-performing Airbnb hosts in San Lorenzo based on the number of properties managed and estimated total revenue over the past year. Analyze their scale and performance metrics.
| Host Name | Properties | Grossing Revenue | Stay Reviews | Avg Rating |
|---|---|---|---|---|
| Ricardo Daniel | 7 | $23,214 | 88 | 4.69/5.0 |
| Graciela Maria | 2 | $16,300 | 2 | Not Rated |
| Hellen | 4 | $14,250 | 78 | 4.82/5.0 |
| Mercedes | 1 | $14,203 | 58 | 4.78/5.0 |
| Paola | 2 | $10,291 | 69 | 4.92/5.0 |
| Gabriel | 1 | $8,928 | 19 | 4.95/5.0 |
| Luis | 1 | $7,289 | 59 | 4.86/5.0 |
| Gustavo | 2 | $6,820 | 30 | 4.73/5.0 |
| Maio | 2 | $6,802 | 55 | 4.86/5.0 |
| Ramona | 1 | $6,304 | 45 | 4.89/5.0 |
Analyzing the strategies of top hosts, such as their property selection, pricing, and guest communication, can offer valuable lessons for optimizing your own Airbnb operations in San Lorenzo.
Dive Deeper: Advanced San Lorenzo STR Market Data (2026)
Ready to unlock more insights? AirROI provides access to advanced metrics and comprehensive Airbnb data for San Lorenzo. Explore detailed analytics beyond this report to refine your investment strategy, optimize pricing, and maximize your vacation rental profits.
Explore Advanced MetricsSan Lorenzo Short-Term Rental Market Composition (2026): Property & Room Types
Room Type Distribution
Property Type Distribution
Market Composition Insights for San Lorenzo
- The San Lorenzo Airbnb market composition is heavily skewed towards Entire Home/Apt listings, which make up 81.4% of the 43 active rentals. This indicates strong guest preference for privacy and space.
- Looking at the property type distribution in San Lorenzo, Apartment/Condo properties are the most common (74.4%), reflecting the local real estate landscape.
- Houses represent a significant 20.9% portion, catering likely to families or larger groups.
- Smaller segments like hotel/boutique (combined 4.7%) offer potential for unique stay experiences.
San Lorenzo Airbnb Room Capacity Analysis (2026): Bedroom Distribution
Distribution of Listings by Number of Bedrooms
Room Capacity Insights for San Lorenzo
- The dominant room capacity in San Lorenzo is 1 bedroom listings, making up 41.9% of the market. This suggests a strong demand for properties suitable for couples or solo travelers.
- Together, 1 bedroom and 2 bedrooms properties represent 81.4% of the active Airbnb listings in San Lorenzo, indicating a high concentration in these sizes.
- Listings with 3+ bedrooms (7.0%) represent a smaller niche, potentially indicating an underserved market for larger group accommodations in San Lorenzo.
San Lorenzo Vacation Rental Guest Capacity Trends (2026)
Distribution of Listings by Guest Capacity
Guest Capacity Insights for San Lorenzo
- The most common guest capacity trend in San Lorenzo vacation rentals is listings accommodating 4 guests (32.6%). This suggests the primary traveler segment is likely small families or groups.
- Properties designed for 4 guests and 2 guests dominate the San Lorenzo STR market, accounting for 53.5% of listings.
- On average, properties in San Lorenzo are equipped to host 3.3 guests.
San Lorenzo Airbnb Booking Patterns (2026): Available vs. Booked Days
Available Days Distribution
Booked Days Distribution
Booking Pattern Insights for San Lorenzo
- The most common availability pattern in San Lorenzo falls within the 271-366 days range, representing 48.8% of listings. This suggests many properties have significant open periods on their calendars.
- Approximately 83.7% of listings show high availability (181+ days open annually), indicating potential for increased bookings or specific owner usage patterns.
- For booked days, the 91-180 days range is most frequent in San Lorenzo (32.6%), reflecting common guest stay durations or potential owner blocking patterns.
- A notable 18.6% of properties secure long booking periods (181+ days booked per year), highlighting successful long-term rental strategies or significant owner usage.
San Lorenzo Airbnb Minimum Stay Requirements Analysis
Distribution of Listings by Minimum Night Requirement
1 Night
17 listings
39.5% of total
2 Nights
5 listings
11.6% of total
3 Nights
3 listings
7% of total
4-6 Nights
6 listings
14% of total
30+ Nights
12 listings
27.9% of total
Key Insights
- The most prevalent minimum stay requirement in San Lorenzo is 1 Night, adopted by 39.5% of listings. This highlights the market's preference for shorter, flexible bookings.
- A significant segment (27.9%) caters to monthly stays (30+ nights) in San Lorenzo, pointing to opportunities in the extended-stay market.
Recommendations
- Align with the market by considering a 1 Night minimum stay, as 39.5% of San Lorenzo hosts use this setting.
- Explore offering discounts for stays of 30+ nights to attract the 27.9% of the market seeking extended stays.
- Adjust minimum nights based on seasonality – potentially shorter during low season and longer during peak demand periods in San Lorenzo.
San Lorenzo Airbnb Cancellation Policy Trends Analysis (2026)
Flexible
25 listings
58.1% of total
Moderate
13 listings
30.2% of total
Firm
4 listings
9.3% of total
Strict
1 listings
2.3% of total
Cancellation Policy Insights for San Lorenzo
- The prevailing Airbnb cancellation policy trend in San Lorenzo is Flexible, used by 58.1% of listings.
- The market strongly favors guest-friendly terms, with 88.3% of listings offering Flexible or Moderate policies. This suggests guests in San Lorenzo may expect booking flexibility.
- Strict cancellation policies are quite rare (2.3%), potentially making listings with this policy less competitive unless justified by high demand or property type.
Recommendations for Hosts
- Consider adopting a Flexible policy to align with the 58.1% market standard in San Lorenzo.
- Given the high prevalence of Flexible policies (58.1%), offering this can enhance booking appeal, especially during shoulder seasons.
- Using a Strict policy might deter some guests, as only 2.3% of listings use it. Evaluate if potential revenue protection outweighs possible lower booking rates.
- Regularly review your cancellation policy against competitors and market demand shifts in San Lorenzo.
San Lorenzo STR Booking Lead Time Analysis (2026)
Average Booking Lead Time by Month
Booking Lead Time Insights for San Lorenzo
- The overall average booking lead time for vacation rentals in San Lorenzo is 14 days.
- Guests book furthest in advance for stays during January (average 26 days), likely coinciding with peak travel demand or local events.
- The shortest booking windows occur for stays in May (average 7 days), indicating more last-minute travel plans during this time.
- Seasonally, Winter (21 days avg.) sees the longest lead times, while Spring (10 days avg.) has the shortest, reflecting typical travel planning cycles.
Recommendations for Hosts
- Use the overall average lead time (14 days) as a baseline for your pricing and availability strategy in San Lorenzo.
- For January stays, consider implementing length-of-stay discounts or slightly higher rates for bookings made less than 26 days out to capitalize on advance planning.
- Target marketing efforts for the Winter season well in advance (at least 21 days) to capture early planners.
- Monitor your own booking lead times against these San Lorenzo averages to identify opportunities for dynamic pricing adjustments.
Popular & Essential Airbnb Amenities in San Lorenzo (2026)
Amenity Prevalence
Amenity Insights for San Lorenzo
- Essential amenities in San Lorenzo that guests expect include: Wifi, Air conditioning. Lacking these (any) could significantly impact bookings.
- Popular amenities like Free parking on premises, TV, Kitchen are common but not universal. Offering these can provide a competitive edge.
Recommendations for Hosts
- Ensure your listing includes all essential amenities for San Lorenzo: Wifi, Air conditioning.
- Prioritize adding missing essentials: Wifi, Air conditioning.
- Consider adding popular differentiators like Free parking on premises or TV to increase appeal.
- Highlight unique or less common amenities you offer (e.g., hot tub, dedicated workspace, EV charger) in your listing description and photos.
- Regularly check competitor amenities in San Lorenzo to stay competitive.
San Lorenzo Airbnb Guest Demographics & Profile Analysis (2026)
Guest Profile Summary for San Lorenzo
- The typical guest profile for Airbnb in San Lorenzo consists of predominantly international visitors (72%), with top international origins including Brazil, typically belonging to the Post-2000s (Gen Z/Alpha) group (50%), primarily speaking Spanish or English.
- Domestic travelers account for 28.4% of guests.
- Key international markets include Paraguay (28.4%) and Brazil (19.3%).
- Top languages spoken are Spanish (40.3%) followed by English (29.5%).
- A significant demographic segment is the Post-2000s (Gen Z/Alpha) group, representing 50% of guests.
Recommendations for Hosts
- Focus marketing internationally, particularly towards travelers from Brazil.
- Offer listing details and communication support in Spanish.
- Tailor amenities and listing descriptions to appeal to the dominant Post-2000s (Gen Z/Alpha) demographic (e.g., highlight fast WiFi, smart home features, local guides).
- Highlight unique local experiences or amenities relevant to the primary guest profile.
- Consider seasonal promotions aligned with peak travel times for key origin markets.
Nearby Short-Term Rental Market Comparison
How does the San Lorenzo Airbnb market stack up against its neighbors? Compare key performance metrics like average monthly revenue, ADR, and occupancy rates in surrounding areas to understand the broader regional STR landscape.
| Market | Active Properties | Monthly Revenue | Daily Rate | Avg. Occupancy |
|---|---|---|---|---|
| La Colmena | 10 | $1,728 | $144.32 | 39% |
| Asuncion | 1,280 | $587 | $49.44 | 48% |
| San Bernardino | 246 | $574 | $186.13 | 20% |
| Altos | 17 | $497 | $113.43 | 21% |
| Asunción | 233 | $402 | $50.85 | 44% |
| Paraguari district | 27 | $376 | $97.59 | 17% |
| Areguá | 27 | $366 | $113.12 | 20% |
| Ypacarai District | 34 | $354 | $122.25 | 22% |
| Formosa | 38 | $293 | $44.35 | 31% |
| Fernando de la Mora | 54 | $290 | $35.32 | 40% |