Lambaré Airbnb Market Analysis 2026: Short Term Rental Data & Vacation Rental Statistics in Central Department, Paraguay
Is Airbnb profitable in Lambaré in 2026? Explore comprehensive Airbnb analytics for Lambaré, Central Department, Paraguay to uncover income potential. This 2026 STR market report for Lambaré, based on AirROI data from February 2025 to January 2026, reveals key trends in the niche market of 21 active listings.
Whether you're considering an Airbnb investment in Lambaré, optimizing your existing vacation rental, or exploring rental arbitrage opportunities, understanding the Lambaré Airbnb data is crucial. Leveraging the low regulation environment is key to maximizing your short term rental income potential. Let's dive into the specifics.
Key Lambaré Airbnb Performance Metrics Overview
Monthly Airbnb Revenue Variations & Income Potential in Lambaré (2026)
Understanding the monthly revenue variations for Airbnb listings in Lambaré is key to maximizing your short term rental income potential. Seasonality significantly impacts earnings. Our analysis, based on data from the past 12 months, shows that the peak revenue month for STRs in Lambaré is typically April, while September often presents the lowest earnings, highlighting opportunities for strategic pricing adjustments during shoulder and low seasons. Explore the typical Airbnb income in Lambaré across different performance tiers:
- Best-in-class properties (Top 10%) achieve $889+ monthly, often utilizing dynamic pricing and superior guest experiences.
- Strong performing properties (Top 25%) earn $458 or more, indicating effective management and desirable locations/amenities.
- Typical properties (Median) generate around $184 per month, representing the average market performance.
- Entry-level properties (Bottom 25%) see earnings around $86, often with potential for optimization.
Average Monthly Airbnb Earnings Trend in Lambaré
Lambaré Airbnb Occupancy Rate Trends (2026)
Maximize your bookings by understanding the Lambaré STR occupancy trends. Seasonal demand shifts significantly influence how often properties are booked. Typically, Aprilsees the highest demand (peak season occupancy), while August experiences the lowest (low season). Effective strategies, like adjusting minimum stays or offering promotions, can boost occupancy during slower periods. Here's how different property tiers perform in Lambaré:
- Best-in-class properties (Top 10%) achieve 65%+ occupancy, indicating high desirability and potentially optimized availability.
- Strong performing properties (Top 25%) maintain 36% or higher occupancy, suggesting good market fit and guest satisfaction.
- Typical properties (Median) have an occupancy rate around 18%.
- Entry-level properties (Bottom 25%) average 9% occupancy, potentially facing higher vacancy.
Average Monthly Occupancy Rate Trend in Lambaré
Average Daily Rate (ADR) Airbnb Trends in Lambaré (2026)
Effective short term rental pricing strategy in Lambaré involves understanding monthly ADR fluctuations. The Average Daily Rate (ADR) for Airbnb in Lambaré typically peaks in October and dips lowest during August. Leveraging Airbnb dynamic pricing tools or strategies based on this seasonality can significantly boost revenue. Here's a look at the typical nightly rates achieved:
- Best-in-class properties (Top 10%) command rates of $105+ per night, often due to premium features or locations.
- Strong performing properties (Top 25%) achieve nightly rates of $66 or more.
- Typical properties (Median) charge around $33 per night.
- Entry-level properties (Bottom 25%) earn around $20 per night.
Average Daily Rate (ADR) Trend by Month in Lambaré
Get Live Lambaré Market Intelligence 👇

Explore Real-time Analytics
Airbnb Seasonality Analysis & Trends in Lambaré (2026)
Peak Season (April, December, January)
- Revenue averages $515 per month
- Occupancy rates average 29.1%
- Daily rates average $65
Shoulder Season
- Revenue averages $341 per month
- Occupancy maintains around 28.4%
- Daily rates hold near $65
Low Season (June, August, September)
- Revenue drops to average $253 per month
- Occupancy decreases to average 22.9%
- Daily rates adjust to average $62
Seasonality Insights for Lambaré
- The Airbnb seasonality in Lambaré shows highly seasonal trends requiring careful strategy. While the sections above show seasonal averages, it's also insightful to look at the extremes:
- During the high season, the absolute peak month showcases Lambaré's highest earning potential, with monthly revenues capable of climbing to $575, occupancy reaching a high of 34.8%, and ADRs peaking at $70.
- Conversely, the slowest single month of the year, typically falling within the low season, marks the market's lowest point. In this month, revenue might dip to $231, occupancy could drop to 20.3%, and ADRs may adjust down to $60.
- Understanding both the seasonal averages and these monthly peaks and troughs in revenue, occupancy, and ADR is crucial for maximizing your Airbnb profit potential in Lambaré.
Seasonal Strategies for Maximizing Profit
- Peak Season: Maximize revenue through premium pricing and potentially longer minimum stays. Ensure high availability.
- Low Season: Offer competitive pricing, special promotions (e.g., extended stay discounts), and flexible cancellation policies. Target off-season travelers like remote workers or budget-conscious guests.
- Shoulder Seasons: Implement dynamic pricing that balances peak and low rates. Target weekend travelers or specific events. Offer slightly more flexible terms than peak season.
- Regularly analyze your own performance against these Lambaré seasonality benchmarks and adjust your pricing and availability strategy accordingly.
Best Areas for Airbnb Investment in Lambaré (2026)
Exploring the top neighborhoods for short-term rentals in Lambaré? This section highlights key areas, outlining why they are attractive for hosts and guests, along with notable local attractions. Consider these locations based on your target guest profile and investment strategy.
| Neighborhood / Area | Why Host Here? (Target Guests & Appeal) | Key Attractions & Landmarks |
|---|---|---|
| Lambaré Centro | The central area of Lambaré offers easy access to local shops, restaurants, and public transportation. It's ideal for travelers who want to be in the heart of the city with plenty of amenities nearby. | Plaza de Lambaré, Shopping del Sol, Cerro Koi, Parque Ñu Guasu, Local markets |
| Punta de Mita | A popular area for visitors seeking a mix of beach relaxation and local culture. Known for its charming ambiance and proximity to water activities. | Local beaches, Restaurants and bars, Water sports activities, Fishing and boat tours |
| Loma Merlo | A quieter neighborhood that's becoming popular for its residential charm and accessibility to parks and outdoor activities. Great for families and nature lovers. | Parque Loma Merlo, Outdoor sports facilities, Community events |
| Villa Elisa | Located close to Lambaré, Villa Elisa offers a peaceful suburban vibe while still being accessible to the urban amenities of the central area. Ideal for longer stays. | Shopping in Villa Elisa, Local parks, Cafes and eateries |
| Luque | Nearby Luque is famous for its cultural sites and historical significance. It's a great area for travelers interested in Paraguayan culture and history. | Museo F. V. A. de Luque, Parroquia San Juan Bautista, Cultural festivals |
| Ñemby | A rapidly developing area that's attracting more visitors. Offers a mix of traditional Paraguayan lifestyle with new developments and is close to nature activities. | Parque Ñemby, Local artisanal markets, Historical landmarks |
| San Lorenzo | Known for its educational institutions and youthful vibe, San Lorenzo attracts students and young professionals, providing a lively atmosphere. | Universities, Cafes and student hotspots, Cultural events |
| Cerro Porteño | A vibrant area known for its passionate local culture, especially around sports, making it attractive for fans and those wanting local experiences. | Estadio General Pablo Rojas, Local eateries, Cultural festivals |
Understanding Airbnb License Requirements & STR Laws in Lambaré (2026)
While Lambaré, Central Department, Paraguay currently shows low STR regulations, specific Airbnb license requirements might still exist or change. Always verify the latest short term rental regulations and Airbnb license requirements directly with local government authorities for Lambaré to ensure full compliance before hosting.
(Source: AirROI data, 2026, finding no licensed listings among those analyzed)
Top Performing Airbnb Properties in Lambaré (2026)
Benchmark your potential! Explore examples of top-performing Airbnb properties in Lambarébased on Trailing Twelve Month (TTM) revenue. Analyze their characteristics, revenue, occupancy rate, and ADR to understand what drives success in this market.
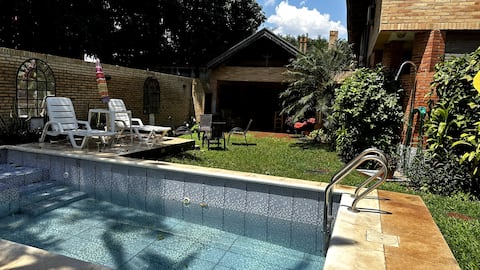
House with pool in Lambaré
Entire Place • 4 bedrooms

Lovely apartment with a pool in Lambaré.
Entire Place • 2 bedrooms

Spacious apartment on Av Cacique Lambaré
Entire Place • 2 bedrooms

Casa Palacio de López
Entire Place • 2 bedrooms

Beautiful loft on two levels overlooking the river
Entire Place • 1 bedroom

Brand new apartment
Entire Place • 2 bedrooms
Note: Performance varies based on location, size, amenities, seasonality, and management quality. Data reflects the past 12 months.
Top Performing Airbnb Hosts in Lambaré (2026)
Learn from the best! This table showcases top-performing Airbnb hosts in Lambaré based on the number of properties managed and estimated total revenue over the past year. Analyze their scale and performance metrics.
| Host Name | Properties | Grossing Revenue | Stay Reviews | Avg Rating |
|---|---|---|---|---|
| Hugo | 1 | $16,418 | 11 | 4.64/5.0 |
| Susana | 1 | $10,592 | 35 | 4.94/5.0 |
| Rocío Ibarra | 1 | $6,261 | 12 | 4.92/5.0 |
| Fabio Andrés | 1 | $3,688 | 53 | 4.96/5.0 |
| Maia | 1 | $2,668 | 9 | 5.00/5.0 |
| Romina | 1 | $2,469 | 1 | Not Rated |
| Guille | 2 | $2,393 | 59 | 4.90/5.0 |
| Gustavo | 1 | $2,308 | 11 | 4.91/5.0 |
| María Belén | 3 | $1,843 | 38 | 4.94/5.0 |
| Edith Mariel | 1 | $1,461 | 12 | 4.67/5.0 |
Analyzing the strategies of top hosts, such as their property selection, pricing, and guest communication, can offer valuable lessons for optimizing your own Airbnb operations in Lambaré.
Dive Deeper: Advanced Lambaré STR Market Data (2026)
Ready to unlock more insights? AirROI provides access to advanced metrics and comprehensive Airbnb data for Lambaré. Explore detailed analytics beyond this report to refine your investment strategy, optimize pricing, and maximize your vacation rental profits.
Explore Advanced MetricsLambaré Short-Term Rental Market Composition (2026): Property & Room Types
Room Type Distribution
Property Type Distribution
Market Composition Insights for Lambaré
- The Lambaré Airbnb market composition is heavily skewed towards Entire Home/Apt listings, which make up 61.9% of the 21 active rentals. This indicates strong guest preference for privacy and space.
- However, a notable 38.1% share for Private Rooms suggests opportunities for budget-conscious travelers or hosts renting out spare rooms.
- Looking at the property type distribution in Lambaré, Apartment/Condo properties are the most common (52.4%), reflecting the local real estate landscape.
- Houses represent a significant 38.1% portion, catering likely to families or larger groups.
- Smaller segments like others, hotel/boutique (combined 9.6%) offer potential for unique stay experiences.
Lambaré Airbnb Room Capacity Analysis (2026): Bedroom Distribution
Distribution of Listings by Number of Bedrooms
Room Capacity Insights for Lambaré
- The dominant room capacity in Lambaré is 2 bedrooms listings, making up 38.1% of the market. This suggests a strong demand for properties suitable for couples or solo travelers.
- Together, 2 bedrooms and 1 bedroom properties represent 52.4% of the active Airbnb listings in Lambaré, indicating a high concentration in these sizes.
Lambaré Vacation Rental Guest Capacity Trends (2026)
Distribution of Listings by Guest Capacity
Guest Capacity Insights for Lambaré
- The most common guest capacity trend in Lambaré vacation rentals is listings accommodating 4 guests (23.8%). This suggests the primary traveler segment is likely small families or groups.
- Properties designed for 4 guests and 3 guests dominate the Lambaré STR market, accounting for 33.3% of listings.
- 19.1% of properties accommodate 6+ guests, serving the market segment for larger families or group travel in Lambaré.
- On average, properties in Lambaré are equipped to host 3.1 guests.
Lambaré Airbnb Booking Patterns (2026): Available vs. Booked Days
Available Days Distribution
Booked Days Distribution
Booking Pattern Insights for Lambaré
- The most common availability pattern in Lambaré falls within the 271-366 days range, representing 76.2% of listings. This suggests many properties have significant open periods on their calendars.
- Approximately 90.5% of listings show high availability (181+ days open annually), indicating potential for increased bookings or specific owner usage patterns.
- For booked days, the 31-90 days range is most frequent in Lambaré (38.1%), reflecting common guest stay durations or potential owner blocking patterns.
- A notable 9.5% of properties secure long booking periods (181+ days booked per year), highlighting successful long-term rental strategies or significant owner usage.
Lambaré Airbnb Minimum Stay Requirements Analysis
Distribution of Listings by Minimum Night Requirement
1 Night
11 listings
52.4% of total
2 Nights
6 listings
28.6% of total
3 Nights
1 listings
4.8% of total
30+ Nights
3 listings
14.3% of total
Key Insights
- The most prevalent minimum stay requirement in Lambaré is 1 Night, adopted by 52.4% of listings. This highlights the market's preference for shorter, flexible bookings.
- A strong majority (81.0%) of the Lambaré Airbnb data shows acceptance of very short stays (1-2 nights), indicating a dynamic, high-turnover market.
- A significant segment (14.3%) caters to monthly stays (30+ nights) in Lambaré, pointing to opportunities in the extended-stay market.
Recommendations
- Align with the market by considering a 1 Night minimum stay, as 52.4% of Lambaré hosts use this setting.
- Explore offering discounts for stays of 30+ nights to attract the 14.3% of the market seeking extended stays.
- Adjust minimum nights based on seasonality – potentially shorter during low season and longer during peak demand periods in Lambaré.
Lambaré Airbnb Cancellation Policy Trends Analysis (2026)
Flexible
11 listings
52.4% of total
Moderate
9 listings
42.9% of total
Firm
1 listings
4.8% of total
Cancellation Policy Insights for Lambaré
- The prevailing Airbnb cancellation policy trend in Lambaré is Flexible, used by 52.4% of listings.
- The market strongly favors guest-friendly terms, with 95.3% of listings offering Flexible or Moderate policies. This suggests guests in Lambaré may expect booking flexibility.
Recommendations for Hosts
- Consider adopting a Flexible policy to align with the 52.4% market standard in Lambaré.
- Given the high prevalence of Flexible policies (52.4%), offering this can enhance booking appeal, especially during shoulder seasons.
- Regularly review your cancellation policy against competitors and market demand shifts in Lambaré.
Lambaré STR Booking Lead Time Analysis (2026)
Average Booking Lead Time by Month
Booking Lead Time Insights for Lambaré
- The overall average booking lead time for vacation rentals in Lambaré is 12 days.
- Guests book furthest in advance for stays during December (average 20 days), likely coinciding with peak travel demand or local events.
- The shortest booking windows occur for stays in May (average 4 days), indicating more last-minute travel plans during this time.
- Seasonally, Winter (16 days avg.) sees the longest lead times, while Spring (8 days avg.) has the shortest, reflecting typical travel planning cycles.
Recommendations for Hosts
- Use the overall average lead time (12 days) as a baseline for your pricing and availability strategy in Lambaré.
- During May, focus on last-minute booking availability and promotions, as guests book with very short notice (4 days avg.).
- Target marketing efforts for the Winter season well in advance (at least 16 days) to capture early planners.
- Monitor your own booking lead times against these Lambaré averages to identify opportunities for dynamic pricing adjustments.
Popular & Essential Airbnb Amenities in Lambaré (2026)
Amenity Prevalence
Amenity Insights for Lambaré
- Essential amenities in Lambaré that guests expect include: Wifi, Air conditioning, Free parking on premises. Lacking these (any) could significantly impact bookings.
- Popular amenities like TV, Heating, Kitchen are common but not universal. Offering these can provide a competitive edge.
Recommendations for Hosts
- Ensure your listing includes all essential amenities for Lambaré: Wifi, Air conditioning, Free parking on premises.
- Prioritize adding missing essentials: Free parking on premises.
- Consider adding popular differentiators like TV or Heating to increase appeal.
- Highlight unique or less common amenities you offer (e.g., hot tub, dedicated workspace, EV charger) in your listing description and photos.
- Regularly check competitor amenities in Lambaré to stay competitive.
Lambaré Airbnb Guest Demographics & Profile Analysis (2026)
Guest Profile Summary for Lambaré
- The typical guest profile for Airbnb in Lambaré consists of predominantly international visitors (85%), with top international origins including Paraguay, typically belonging to the Post-2000s (Gen Z/Alpha) group (50%), primarily speaking Spanish or English.
- Domestic travelers account for 14.7% of guests.
- Key international markets include Brazil (20.6%) and Paraguay (14.7%).
- Top languages spoken are Spanish (36.6%) followed by English (34.1%).
- A significant demographic segment is the Post-2000s (Gen Z/Alpha) group, representing 50% of guests.
Recommendations for Hosts
- Focus marketing internationally, particularly towards travelers from Paraguay.
- Offer listing details and communication support in Spanish.
- Tailor amenities and listing descriptions to appeal to the dominant Post-2000s (Gen Z/Alpha) demographic (e.g., highlight fast WiFi, smart home features, local guides).
- Highlight unique local experiences or amenities relevant to the primary guest profile.
- Consider seasonal promotions aligned with peak travel times for key origin markets.
Nearby Short-Term Rental Market Comparison
How does the Lambaré Airbnb market stack up against its neighbors? Compare key performance metrics like average monthly revenue, ADR, and occupancy rates in surrounding areas to understand the broader regional STR landscape.
| Market | Active Properties | Monthly Revenue | Daily Rate | Avg. Occupancy |
|---|---|---|---|---|
| La Colmena | 10 | $1,728 | $144.32 | 39% |
| Asuncion | 1,280 | $587 | $49.44 | 48% |
| San Bernardino | 246 | $574 | $186.13 | 20% |
| Altos | 17 | $497 | $113.43 | 21% |
| Asunción | 233 | $402 | $50.85 | 44% |
| Paraguari district | 27 | $376 | $97.59 | 17% |
| Areguá | 27 | $366 | $113.12 | 20% |
| Ypacarai District | 34 | $354 | $122.25 | 22% |
| Formosa | 38 | $293 | $44.35 | 31% |
| Fernando de la Mora | 54 | $290 | $35.32 | 40% |