Areguá Airbnb Market Analysis 2026: Short Term Rental Data & Vacation Rental Statistics in Central Department, Paraguay
Is Airbnb profitable in Areguá in 2026? Explore comprehensive Airbnb analytics for Areguá, Central Department, Paraguay to uncover income potential. This 2026 STR market report for Areguá, based on AirROI data from February 2025 to January 2026, reveals key trends in the niche market of 27 active listings.
Whether you're considering an Airbnb investment in Areguá, optimizing your existing vacation rental, or exploring rental arbitrage opportunities, understanding the Areguá Airbnb data is crucial. Leveraging the low regulation environment is key to maximizing your short term rental income potential. Let's dive into the specifics.
Key Areguá Airbnb Performance Metrics Overview
Monthly Airbnb Revenue Variations & Income Potential in Areguá (2026)
Understanding the monthly revenue variations for Airbnb listings in Areguá is key to maximizing your short term rental income potential. Seasonality significantly impacts earnings. Our analysis, based on data from the past 12 months, shows that the peak revenue month for STRs in Areguá is typically December, while July often presents the lowest earnings, highlighting opportunities for strategic pricing adjustments during shoulder and low seasons. Explore the typical Airbnb income in Areguá across different performance tiers:
- Best-in-class properties (Top 10%) achieve $1,824+ monthly, often utilizing dynamic pricing and superior guest experiences.
- Strong performing properties (Top 25%) earn $920 or more, indicating effective management and desirable locations/amenities.
- Typical properties (Median) generate around $442 per month, representing the average market performance.
- Entry-level properties (Bottom 25%) see earnings around $195, often with potential for optimization.
Average Monthly Airbnb Earnings Trend in Areguá
Areguá Airbnb Occupancy Rate Trends (2026)
Maximize your bookings by understanding the Areguá STR occupancy trends. Seasonal demand shifts significantly influence how often properties are booked. Typically, Decembersees the highest demand (peak season occupancy), while June experiences the lowest (low season). Effective strategies, like adjusting minimum stays or offering promotions, can boost occupancy during slower periods. Here's how different property tiers perform in Areguá:
- Best-in-class properties (Top 10%) achieve 50%+ occupancy, indicating high desirability and potentially optimized availability.
- Strong performing properties (Top 25%) maintain 32% or higher occupancy, suggesting good market fit and guest satisfaction.
- Typical properties (Median) have an occupancy rate around 15%.
- Entry-level properties (Bottom 25%) average 9% occupancy, potentially facing higher vacancy.
Average Monthly Occupancy Rate Trend in Areguá
Average Daily Rate (ADR) Airbnb Trends in Areguá (2026)
Effective short term rental pricing strategy in Areguá involves understanding monthly ADR fluctuations. The Average Daily Rate (ADR) for Airbnb in Areguá typically peaks in September and dips lowest during March. Leveraging Airbnb dynamic pricing tools or strategies based on this seasonality can significantly boost revenue. Here's a look at the typical nightly rates achieved:
- Best-in-class properties (Top 10%) command rates of $172+ per night, often due to premium features or locations.
- Strong performing properties (Top 25%) achieve nightly rates of $135 or more.
- Typical properties (Median) charge around $99 per night.
- Entry-level properties (Bottom 25%) earn around $59 per night.
Average Daily Rate (ADR) Trend by Month in Areguá
Get Live Areguá Market Intelligence 👇

Explore Real-time Analytics
Airbnb Seasonality Analysis & Trends in Areguá (2026)
Peak Season (December, January, October)
- Revenue averages $1,100 per month
- Occupancy rates average 27.7%
- Daily rates average $115
Shoulder Season
- Revenue averages $710 per month
- Occupancy maintains around 24.3%
- Daily rates hold near $113
Low Season (May, June, July)
- Revenue drops to average $348 per month
- Occupancy decreases to average 13.2%
- Daily rates adjust to average $111
Seasonality Insights for Areguá
- The Airbnb seasonality in Areguá shows highly seasonal trends requiring careful strategy. While the sections above show seasonal averages, it's also insightful to look at the extremes:
- During the high season, the absolute peak month showcases Areguá's highest earning potential, with monthly revenues capable of climbing to $1,376, occupancy reaching a high of 37.1%, and ADRs peaking at $124.
- Conversely, the slowest single month of the year, typically falling within the low season, marks the market's lowest point. In this month, revenue might dip to $291, occupancy could drop to 12.3%, and ADRs may adjust down to $108.
- Understanding both the seasonal averages and these monthly peaks and troughs in revenue, occupancy, and ADR is crucial for maximizing your Airbnb profit potential in Areguá.
Seasonal Strategies for Maximizing Profit
- Peak Season: Maximize revenue through premium pricing and potentially longer minimum stays. Ensure high availability.
- Low Season: Offer competitive pricing, special promotions (e.g., extended stay discounts), and flexible cancellation policies. Target off-season travelers like remote workers or budget-conscious guests.
- Shoulder Seasons: Implement dynamic pricing that balances peak and low rates. Target weekend travelers or specific events. Offer slightly more flexible terms than peak season.
- Regularly analyze your own performance against these Areguá seasonality benchmarks and adjust your pricing and availability strategy accordingly.
Best Areas for Airbnb Investment in Areguá (2026)
Exploring the top neighborhoods for short-term rentals in Areguá? This section highlights key areas, outlining why they are attractive for hosts and guests, along with notable local attractions. Consider these locations based on your target guest profile and investment strategy.
| Neighborhood / Area | Why Host Here? (Target Guests & Appeal) | Key Attractions & Landmarks |
|---|---|---|
| Centro Histórico | Areguá's historical center known for its colonial architecture and charming streets. Attracts tourists who are interested in culture, history, and local art. | Iglesia San Juan Bautista, Museo de Areguá, Plaza Pedro Juan Caballero, Art galleries, Cultural festivals |
| Laguna Salada | A scenic area with beautiful lake views, popular for eco-tourism and relaxation. Ideal for those seeking tranquility and nature-focused experiences. | Laguna Salada, Bird watching, Kayaking, Nature trails |
| Parque Ñu Guasu | A large park that offers outdoor activities and events, appealing to families and nature lovers who enjoy recreational spaces. | Walking paths, Picnic areas, Outdoor sports, Cultural events |
| Areguá Beach | A unique spot along the lake providing leisure activities for visitors. Great for those looking to relax by the water and enjoy water sports. | Swimming, Fishing, Boat rentals, Sunbathing |
| La Candelaria | A quaint neighborhood known for its artistic community and creative vibe. Popular with artists and those looking for an alternative, cultural experience. | Local art workshops, Cafés and artisan shops, Cultural events |
| Cerro Kuarahy | A hill offering panoramic views of the city and surrounding landscape, attracting tourists for hiking and scenic photography. | Hiking trails, Scenic viewpoints, Wildlife watching |
| Punta del Este | A trendy area closer to the lake, known for upscale amenities and vibrant nightlife. Perfect for younger visitors and those looking to socialize and enjoy nightlife. | Nightclubs, Restaurants, Sunset views |
| Barrio San Isidro | A residential area that offers a blend of local culture and proximity to attractions, appealing to families and long-term visitors. | Local markets, Family-friendly parks, Artisan shops |
Understanding Airbnb License Requirements & STR Laws in Areguá (2026)
While Areguá, Central Department, Paraguay currently shows low STR regulations, specific Airbnb license requirements might still exist or change. Always verify the latest short term rental regulations and Airbnb license requirements directly with local government authorities for Areguá to ensure full compliance before hosting.
(Source: AirROI data, 2026, finding no licensed listings among those analyzed)
Top Performing Airbnb Properties in Areguá (2026)
Benchmark your potential! Explore examples of top-performing Airbnb properties in Areguábased on Trailing Twelve Month (TTM) revenue. Analyze their characteristics, revenue, occupancy rate, and ADR to understand what drives success in this market.

Accommodation in an old house
Entire Place • 3 bedrooms
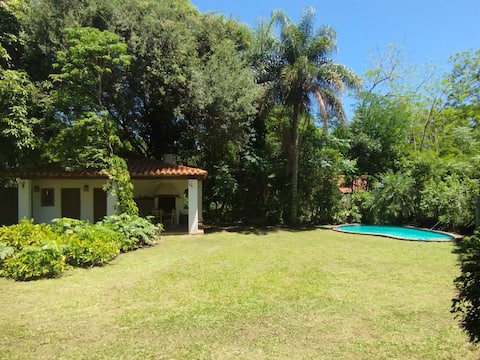
A house in Areguá
Entire Place • 3 bedrooms
Colonial-style house
Entire Place • 4 bedrooms
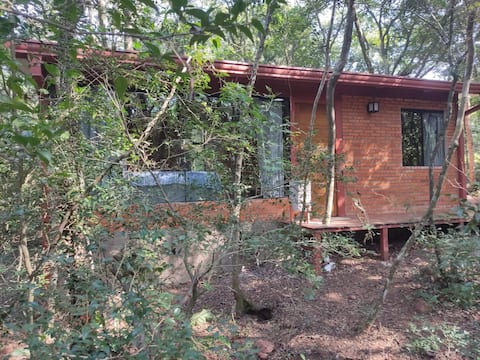
Cabin in the Woods
Entire Place • 1 bedroom

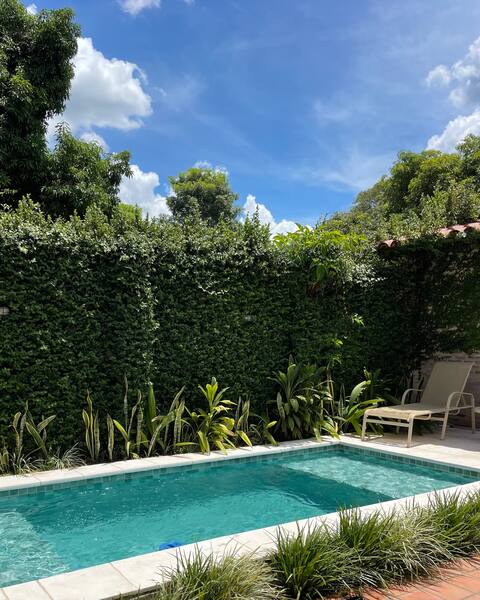
Windows on the Lake, Aregua
Entire Place • 2 bedrooms

El Bosque de Don Fernando - Aregua
Entire Place • 5 bedrooms
Note: Performance varies based on location, size, amenities, seasonality, and management quality. Data reflects the past 12 months.
Top Performing Airbnb Hosts in Areguá (2026)
Learn from the best! This table showcases top-performing Airbnb hosts in Areguá based on the number of properties managed and estimated total revenue over the past year. Analyze their scale and performance metrics.
| Host Name | Properties | Grossing Revenue | Stay Reviews | Avg Rating |
|---|---|---|---|---|
| Aguyje | 1 | $21,080 | 37 | 4.89/5.0 |
| Jessica | 1 | $16,458 | 14 | 5.00/5.0 |
| Cinthia | 1 | $15,678 | 15 | 4.60/5.0 |
| Pablo | 2 | $11,085 | 47 | 4.91/5.0 |
| Tomas Guillermo | 1 | $6,343 | 34 | 5.00/5.0 |
| Jorge | 1 | $5,830 | 7 | 4.86/5.0 |
| Osvaldo Miguel | 1 | $5,442 | 10 | 5.00/5.0 |
| Nico | 1 | $5,399 | 3 | 5.00/5.0 |
| Gisella María Elizabeth | 1 | $4,494 | 3 | 5.00/5.0 |
| Adri | 1 | $4,225 | 16 | 4.94/5.0 |
Analyzing the strategies of top hosts, such as their property selection, pricing, and guest communication, can offer valuable lessons for optimizing your own Airbnb operations in Areguá.
Dive Deeper: Advanced Areguá STR Market Data (2026)
Ready to unlock more insights? AirROI provides access to advanced metrics and comprehensive Airbnb data for Areguá. Explore detailed analytics beyond this report to refine your investment strategy, optimize pricing, and maximize your vacation rental profits.
Explore Advanced MetricsAreguá Short-Term Rental Market Composition (2026): Property & Room Types
Room Type Distribution
Property Type Distribution
Market Composition Insights for Areguá
- The Areguá Airbnb market composition is heavily skewed towards Entire Home/Apt listings, which make up 88.9% of the 27 active rentals. This indicates strong guest preference for privacy and space.
- Looking at the property type distribution in Areguá, House properties are the most common (66.7%), reflecting the local real estate landscape.
- Houses represent a significant 66.7% portion, catering likely to families or larger groups.
- Smaller segments like hotel/boutique (combined 3.7%) offer potential for unique stay experiences.
Areguá Airbnb Room Capacity Analysis (2026): Bedroom Distribution
Distribution of Listings by Number of Bedrooms
Room Capacity Insights for Areguá
- The dominant room capacity in Areguá is 2 bedrooms listings, making up 44.4% of the market. This suggests a strong demand for properties suitable for couples or solo travelers.
- Together, 2 bedrooms and 1 bedroom properties represent 70.3% of the active Airbnb listings in Areguá, indicating a high concentration in these sizes.
- A significant 25.9% of listings offer 3+ bedrooms, catering to larger groups and families seeking more space in Areguá.
Areguá Vacation Rental Guest Capacity Trends (2026)
Distribution of Listings by Guest Capacity
Guest Capacity Insights for Areguá
- The most common guest capacity trend in Areguá vacation rentals is listings accommodating 8+ guests (33.3%). This suggests the primary traveler segment is likely larger groups.
- Properties designed for 8+ guests and 4 guests dominate the Areguá STR market, accounting for 59.2% of listings.
- 51.8% of properties accommodate 6+ guests, serving the market segment for larger families or group travel in Areguá.
- On average, properties in Areguá are equipped to host 5.3 guests.
Areguá Airbnb Booking Patterns (2026): Available vs. Booked Days
Available Days Distribution
Booked Days Distribution
Booking Pattern Insights for Areguá
- The most common availability pattern in Areguá falls within the 271-366 days range, representing 88.9% of listings. This suggests many properties have significant open periods on their calendars.
- Approximately 100.0% of listings show high availability (181+ days open annually), indicating potential for increased bookings or specific owner usage patterns.
- For booked days, the 1-30 days range is most frequent in Areguá (51.9%), reflecting common guest stay durations or potential owner blocking patterns.
Areguá Airbnb Minimum Stay Requirements Analysis
Distribution of Listings by Minimum Night Requirement
1 Night
15 listings
55.6% of total
2 Nights
5 listings
18.5% of total
4-6 Nights
1 listings
3.7% of total
7-29 Nights
1 listings
3.7% of total
30+ Nights
5 listings
18.5% of total
Key Insights
- The most prevalent minimum stay requirement in Areguá is 1 Night, adopted by 55.6% of listings. This highlights the market's preference for shorter, flexible bookings.
- A strong majority (74.1%) of the Areguá Airbnb data shows acceptance of very short stays (1-2 nights), indicating a dynamic, high-turnover market.
- A significant segment (18.5%) caters to monthly stays (30+ nights) in Areguá, pointing to opportunities in the extended-stay market.
Recommendations
- Align with the market by considering a 1 Night minimum stay, as 55.6% of Areguá hosts use this setting.
- Explore offering discounts for stays of 30+ nights to attract the 18.5% of the market seeking extended stays.
- Adjust minimum nights based on seasonality – potentially shorter during low season and longer during peak demand periods in Areguá.
Areguá Airbnb Cancellation Policy Trends Analysis (2026)
Flexible
13 listings
48.1% of total
Moderate
12 listings
44.4% of total
Firm
2 listings
7.4% of total
Cancellation Policy Insights for Areguá
- The prevailing Airbnb cancellation policy trend in Areguá is Flexible, used by 48.1% of listings.
- The market strongly favors guest-friendly terms, with 92.5% of listings offering Flexible or Moderate policies. This suggests guests in Areguá may expect booking flexibility.
Recommendations for Hosts
- Consider adopting a Flexible policy to align with the 48.1% market standard in Areguá.
- Regularly review your cancellation policy against competitors and market demand shifts in Areguá.
Areguá STR Booking Lead Time Analysis (2026)
Average Booking Lead Time by Month
Booking Lead Time Insights for Areguá
- The overall average booking lead time for vacation rentals in Areguá is 19 days.
- Guests book furthest in advance for stays during September (average 29 days), likely coinciding with peak travel demand or local events.
- The shortest booking windows occur for stays in June (average 2 days), indicating more last-minute travel plans during this time.
- Seasonally, Fall (25 days avg.) sees the longest lead times, while Summer (12 days avg.) has the shortest, reflecting typical travel planning cycles.
Recommendations for Hosts
- Use the overall average lead time (19 days) as a baseline for your pricing and availability strategy in Areguá.
- During June, focus on last-minute booking availability and promotions, as guests book with very short notice (2 days avg.).
- Target marketing efforts for the Fall season well in advance (at least 25 days) to capture early planners.
- Monitor your own booking lead times against these Areguá averages to identify opportunities for dynamic pricing adjustments.
Popular & Essential Airbnb Amenities in Areguá (2026)
Amenity Prevalence
Amenity Insights for Areguá
- Essential amenities in Areguá that guests expect include: Air conditioning, Free parking on premises. Lacking these (any) could significantly impact bookings.
- Popular amenities like BBQ grill, Outdoor dining area, Refrigerator are common but not universal. Offering these can provide a competitive edge.
- A pool is a highly desired but not standard amenity, making it a key feature for attracting guests seeking leisure in Areguá.
Recommendations for Hosts
- Ensure your listing includes all essential amenities for Areguá: Air conditioning, Free parking on premises.
- Prioritize adding missing essentials: Free parking on premises.
- Consider adding popular differentiators like BBQ grill or Outdoor dining area to increase appeal.
- Highlight unique or less common amenities you offer (e.g., hot tub, dedicated workspace, EV charger) in your listing description and photos.
- Regularly check competitor amenities in Areguá to stay competitive.
Areguá Airbnb Guest Demographics & Profile Analysis (2026)
Guest Profile Summary for Areguá
- The typical guest profile for Airbnb in Areguá consists of a mix of domestic (52%) and international guests, often arriving from nearby Asuncion, typically belonging to the Post-2000s (Gen Z/Alpha) group (50%), primarily speaking English or Spanish.
- Domestic travelers account for 52.1% of guests.
- Key international markets include Paraguay (52.1%) and United States (16.7%).
- Top languages spoken are English (37.3%) followed by Spanish (36%).
- A significant demographic segment is the Post-2000s (Gen Z/Alpha) group, representing 50% of guests.
Recommendations for Hosts
- Balance marketing efforts between domestic and international channels based on the guest mix.
- Tailor amenities and listing descriptions to appeal to the dominant Post-2000s (Gen Z/Alpha) demographic (e.g., highlight fast WiFi, smart home features, local guides).
- Highlight unique local experiences or amenities relevant to the primary guest profile.
- Consider seasonal promotions aligned with peak travel times for key origin markets.
Nearby Short-Term Rental Market Comparison
How does the Areguá Airbnb market stack up against its neighbors? Compare key performance metrics like average monthly revenue, ADR, and occupancy rates in surrounding areas to understand the broader regional STR landscape.
| Market | Active Properties | Monthly Revenue | Daily Rate | Avg. Occupancy |
|---|---|---|---|---|
| La Colmena | 10 | $1,728 | $144.32 | 39% |
| Asuncion | 1,280 | $587 | $49.44 | 48% |
| San Bernardino | 246 | $574 | $186.13 | 20% |
| Altos | 17 | $497 | $113.43 | 21% |
| Asunción | 233 | $402 | $50.85 | 44% |
| Paraguari district | 27 | $376 | $97.59 | 17% |
| Ypacarai District | 34 | $354 | $122.25 | 22% |
| Formosa | 38 | $293 | $44.35 | 31% |
| Fernando de la Mora | 54 | $290 | $35.32 | 40% |
| Luque | 129 | $285 | $45.21 | 31% |