Distrito de San Carlos Airbnb Market Analysis 2026: Short Term Rental Data & Vacation Rental Statistics in Panamá Oeste, Panama
Is Airbnb profitable in Distrito de San Carlos in 2026? Explore comprehensive Airbnb analytics for Distrito de San Carlos, Panamá Oeste, Panama to uncover income potential. This 2026 STR market report for Distrito de San Carlos, based on AirROI data from February 2025 to January 2026, reveals key trends in the niche market of 75 active listings.
Whether you're considering an Airbnb investment in Distrito de San Carlos, optimizing your existing vacation rental, or exploring rental arbitrage opportunities, understanding the Distrito de San Carlos Airbnb data is crucial. Leveraging the low regulation environment is key to maximizing your short term rental income potential. Let's dive into the specifics.
Key Distrito de San Carlos Airbnb Performance Metrics Overview
Monthly Airbnb Revenue Variations & Income Potential in Distrito de San Carlos (2026)
Understanding the monthly revenue variations for Airbnb listings in Distrito de San Carlos is key to maximizing your short term rental income potential. Seasonality significantly impacts earnings. Our analysis, based on data from the past 12 months, shows that the peak revenue month for STRs in Distrito de San Carlos is typically February, while October often presents the lowest earnings, highlighting opportunities for strategic pricing adjustments during shoulder and low seasons. Explore the typical Airbnb income in Distrito de San Carlos across different performance tiers:
- Best-in-class properties (Top 10%) achieve $3,649+ monthly, often utilizing dynamic pricing and superior guest experiences.
- Strong performing properties (Top 25%) earn $2,303 or more, indicating effective management and desirable locations/amenities.
- Typical properties (Median) generate around $1,192 per month, representing the average market performance.
- Entry-level properties (Bottom 25%) see earnings around $534, often with potential for optimization.
Average Monthly Airbnb Earnings Trend in Distrito de San Carlos
Distrito de San Carlos Airbnb Occupancy Rate Trends (2026)
Maximize your bookings by understanding the Distrito de San Carlos STR occupancy trends. Seasonal demand shifts significantly influence how often properties are booked. Typically, Februarysees the highest demand (peak season occupancy), while October experiences the lowest (low season). Effective strategies, like adjusting minimum stays or offering promotions, can boost occupancy during slower periods. Here's how different property tiers perform in Distrito de San Carlos:
- Best-in-class properties (Top 10%) achieve 72%+ occupancy, indicating high desirability and potentially optimized availability.
- Strong performing properties (Top 25%) maintain 47% or higher occupancy, suggesting good market fit and guest satisfaction.
- Typical properties (Median) have an occupancy rate around 26%.
- Entry-level properties (Bottom 25%) average 13% occupancy, potentially facing higher vacancy.
Average Monthly Occupancy Rate Trend in Distrito de San Carlos
Average Daily Rate (ADR) Airbnb Trends in Distrito de San Carlos (2026)
Effective short term rental pricing strategy in Distrito de San Carlos involves understanding monthly ADR fluctuations. The Average Daily Rate (ADR) for Airbnb in Distrito de San Carlos typically peaks in February and dips lowest during October. Leveraging Airbnb dynamic pricing tools or strategies based on this seasonality can significantly boost revenue. Here's a look at the typical nightly rates achieved:
- Best-in-class properties (Top 10%) command rates of $314+ per night, often due to premium features or locations.
- Strong performing properties (Top 25%) achieve nightly rates of $219 or more.
- Typical properties (Median) charge around $153 per night.
- Entry-level properties (Bottom 25%) earn around $87 per night.
Average Daily Rate (ADR) Trend by Month in Distrito de San Carlos
Get Live Distrito de San Carlos Market Intelligence 👇

Explore Real-time Analytics
Airbnb Seasonality Analysis & Trends in Distrito de San Carlos (2026)
Peak Season (February, March, January)
- Revenue averages $2,148 per month
- Occupancy rates average 41.5%
- Daily rates average $180
Shoulder Season
- Revenue averages $1,606 per month
- Occupancy maintains around 30.9%
- Daily rates hold near $176
Low Season (July, September, October)
- Revenue drops to average $1,231 per month
- Occupancy decreases to average 26.6%
- Daily rates adjust to average $168
Seasonality Insights for Distrito de San Carlos
- The Airbnb seasonality in Distrito de San Carlos shows highly seasonal trends requiring careful strategy. While the sections above show seasonal averages, it's also insightful to look at the extremes:
- During the high season, the absolute peak month showcases Distrito de San Carlos's highest earning potential, with monthly revenues capable of climbing to $2,330, occupancy reaching a high of 47.4%, and ADRs peaking at $187.
- Conversely, the slowest single month of the year, typically falling within the low season, marks the market's lowest point. In this month, revenue might dip to $1,019, occupancy could drop to 23.4%, and ADRs may adjust down to $161.
- Understanding both the seasonal averages and these monthly peaks and troughs in revenue, occupancy, and ADR is crucial for maximizing your Airbnb profit potential in Distrito de San Carlos.
Seasonal Strategies for Maximizing Profit
- Peak Season: Maximize revenue through premium pricing and potentially longer minimum stays. Ensure high availability.
- Low Season: Offer competitive pricing, special promotions (e.g., extended stay discounts), and flexible cancellation policies. Target off-season travelers like remote workers or budget-conscious guests.
- Shoulder Seasons: Implement dynamic pricing that balances peak and low rates. Target weekend travelers or specific events. Offer slightly more flexible terms than peak season.
- Regularly analyze your own performance against these Distrito de San Carlos seasonality benchmarks and adjust your pricing and availability strategy accordingly.
Best Areas for Airbnb Investment in Distrito de San Carlos (2026)
Exploring the top neighborhoods for short-term rentals in Distrito de San Carlos? This section highlights key areas, outlining why they are attractive for hosts and guests, along with notable local attractions. Consider these locations based on your target guest profile and investment strategy.
| Neighborhood / Area | Why Host Here? (Target Guests & Appeal) | Key Attractions & Landmarks |
|---|---|---|
| Penonomé | A charming town ideal for tourists interested in local culture and history. It's a gateway to beautiful beaches and natural parks, making it attractive for a variety of visitors. | Parque Omar Torrijos, El Pueblito de Antón, Resort Playa Blanca, La Pintada, Local artisanal markets |
| El Valle de Antón | A popular vacation spot nestled in the mountains, known for its climate and natural beauty. Ideal for nature lovers, hikers, and adventure seekers. | El Valle's market, Níspero Zoo, Cerro Gaital, Aguadulce Beach, La India Dormida |
| Coronado | A beach town that has become a favorite for retirees and vacationers. Features beautiful beaches, golf courses, and a relaxing lifestyle. | Coronado Beach, The Vista Mar Golf Resort, Local shops and restaurants, Oceanfront properties, Community events |
| Gamboa | An ecotourism destination near the Panama Canal, attracting those interested in nature and wildlife. It's perfect for promoting nature-related stays. | Gumbo Limbo trail, Panama Rainforest Discovery Center, Go on a Soberania National Park hike, Birdwatching opportunities, Canal access |
| San Carlos | Known for its surf beaches and tranquil atmosphere, it attracts families and surfers alike. Great for those seeking beach activities and relaxation. | Playa El Palmar, Surfer beaches, Pueblo de San Carlos, Local seafood restaurants, Natural parks |
| Chame | A coastal town with growing tourism and a mix of beach and local culture. Great for travelers exploring the Pacific side of Panama. | Chame Beach, El Arco Beach, Local markets, Outdoor sporting activities, Clientel-friendly restaurants |
| Puerto Armuelles | A lesser known gem with beautiful beaches and a laid-back vibe. Appeals to those looking for off-the-beaten-path experiences with a local touch. | Punta Banana Beach, Local cultural events, Fishing spots, Nature walks, Turtle watching |
| David | As one of the largest cities in the province, it offers various amenities and is often used as a base for exploring the region. Ideal for urban stays with access to attractions. | Parque de las Madres, Local markets, Shopping centers, Nearby nature reserves, Cultural festivals |
Understanding Airbnb License Requirements & STR Laws in Distrito de San Carlos (2026)
While Distrito de San Carlos, Panamá Oeste, Panama currently shows low STR regulations, specific Airbnb license requirements might still exist or change. Always verify the latest short term rental regulations and Airbnb license requirements directly with local government authorities for Distrito de San Carlos to ensure full compliance before hosting.
(Source: AirROI data, 2026, based on 3% licensed listings)
Top Performing Airbnb Properties in Distrito de San Carlos (2026)
Benchmark your potential! Explore examples of top-performing Airbnb properties in Distrito de San Carlosbased on Trailing Twelve Month (TTM) revenue. Analyze their characteristics, revenue, occupancy rate, and ADR to understand what drives success in this market.
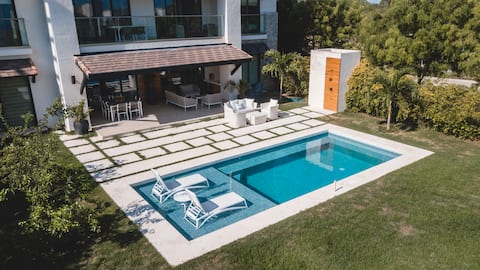
Casamar · Private Pool and Garden
Entire Place • 4 bedrooms

Private Pool Oasis in a Tropical Boutique Villa
Entire Place • 1 bedroom
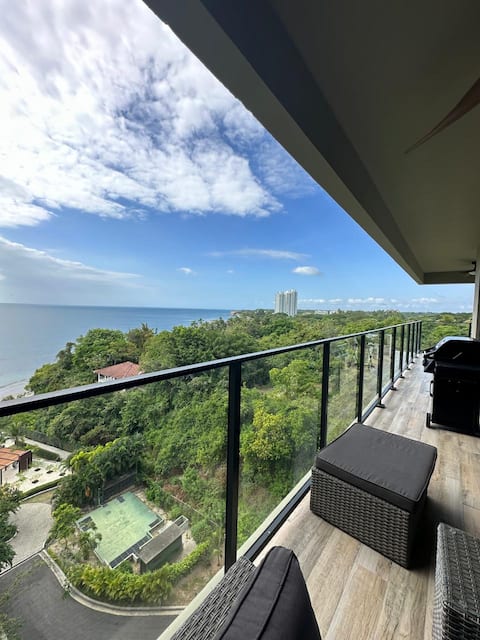
Increíble oceanfront San Carlos
Entire Place • 3 bedrooms
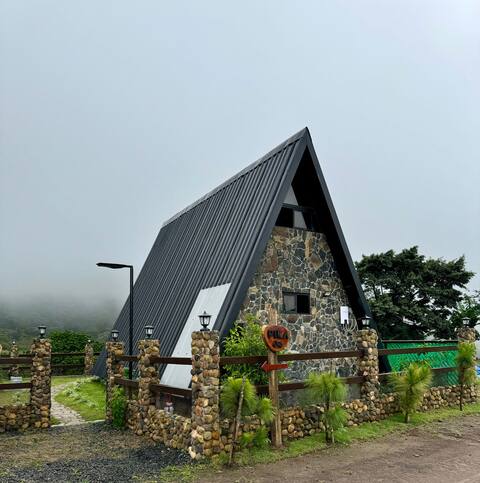
Pika Cabin 04 by Pika Cabins with Pool
Entire Place • 1 bedroom

Pika Cabin 03 by Pika Cabins with Pool
Entire Place • 1 bedroom

Casamar a wonder + Pet friendly + Beach + Aquapark
Entire Place • 2 bedrooms
Note: Performance varies based on location, size, amenities, seasonality, and management quality. Data reflects the past 12 months.
Top Performing Airbnb Hosts in Distrito de San Carlos (2026)
Learn from the best! This table showcases top-performing Airbnb hosts in Distrito de San Carlos based on the number of properties managed and estimated total revenue over the past year. Analyze their scale and performance metrics.
| Host Name | Properties | Grossing Revenue | Stay Reviews | Avg Rating |
|---|---|---|---|---|
| G.C. | 9 | $211,461 | 217 | 4.73/5.0 |
| Edwin | 2 | $71,793 | 72 | 4.60/5.0 |
| Fer | 1 | $66,740 | 43 | 4.98/5.0 |
| Geraldine | 3 | $47,650 | 44 | 4.74/5.0 |
| AcoModo | 2 | $46,487 | 14 | 4.19/5.0 |
| Pol | 1 | $43,838 | 45 | 4.93/5.0 |
| Catherine | 2 | $41,895 | 295 | 4.78/5.0 |
| Carlos | 1 | $37,661 | 48 | 4.94/5.0 |
| Michael | 1 | $30,304 | 32 | 4.94/5.0 |
| Lorena Judith | 1 | $28,030 | 2 | Not Rated |
Analyzing the strategies of top hosts, such as their property selection, pricing, and guest communication, can offer valuable lessons for optimizing your own Airbnb operations in Distrito de San Carlos.
Dive Deeper: Advanced Distrito de San Carlos STR Market Data (2026)
Ready to unlock more insights? AirROI provides access to advanced metrics and comprehensive Airbnb data for Distrito de San Carlos. Explore detailed analytics beyond this report to refine your investment strategy, optimize pricing, and maximize your vacation rental profits.
Explore Advanced MetricsDistrito de San Carlos Short-Term Rental Market Composition (2026): Property & Room Types
Room Type Distribution
Property Type Distribution
Market Composition Insights for Distrito de San Carlos
- The Distrito de San Carlos Airbnb market composition is heavily skewed towards Entire Home/Apt listings, which make up 98.7% of the 75 active rentals. This indicates strong guest preference for privacy and space.
- Looking at the property type distribution in Distrito de San Carlos, Apartment/Condo properties are the most common (48%), reflecting the local real estate landscape.
- Houses represent a significant 29.3% portion, catering likely to families or larger groups.
- The presence of 8% Hotel/Boutique listings indicates integration with traditional hospitality.
Distrito de San Carlos Airbnb Room Capacity Analysis (2026): Bedroom Distribution
Distribution of Listings by Number of Bedrooms
Room Capacity Insights for Distrito de San Carlos
- The dominant room capacity in Distrito de San Carlos is 1 bedroom listings, making up 36% of the market. This suggests a strong demand for properties suitable for couples or solo travelers.
- Together, 1 bedroom and 2 bedrooms properties represent 62.7% of the active Airbnb listings in Distrito de San Carlos, indicating a high concentration in these sizes.
- A significant 36.0% of listings offer 3+ bedrooms, catering to larger groups and families seeking more space in Distrito de San Carlos.
Distrito de San Carlos Vacation Rental Guest Capacity Trends (2026)
Distribution of Listings by Guest Capacity
Guest Capacity Insights for Distrito de San Carlos
- The most common guest capacity trend in Distrito de San Carlos vacation rentals is listings accommodating 6 guests (25.3%). This suggests the primary traveler segment is likely larger groups.
- Properties designed for 6 guests and 8+ guests dominate the Distrito de San Carlos STR market, accounting for 46.6% of listings.
- 51.9% of properties accommodate 6+ guests, serving the market segment for larger families or group travel in Distrito de San Carlos.
- On average, properties in Distrito de San Carlos are equipped to host 5.2 guests.
Distrito de San Carlos Airbnb Booking Patterns (2026): Available vs. Booked Days
Available Days Distribution
Booked Days Distribution
Booking Pattern Insights for Distrito de San Carlos
- The most common availability pattern in Distrito de San Carlos falls within the 271-366 days range, representing 69.3% of listings. This suggests many properties have significant open periods on their calendars.
- Approximately 89.3% of listings show high availability (181+ days open annually), indicating potential for increased bookings or specific owner usage patterns.
- For booked days, the 31-90 days range is most frequent in Distrito de San Carlos (42.7%), reflecting common guest stay durations or potential owner blocking patterns.
- A notable 10.6% of properties secure long booking periods (181+ days booked per year), highlighting successful long-term rental strategies or significant owner usage.
Distrito de San Carlos Airbnb Minimum Stay Requirements Analysis
Distribution of Listings by Minimum Night Requirement
1 Night
41 listings
54.7% of total
2 Nights
16 listings
21.3% of total
3 Nights
1 listings
1.3% of total
7-29 Nights
1 listings
1.3% of total
30+ Nights
16 listings
21.3% of total
Key Insights
- The most prevalent minimum stay requirement in Distrito de San Carlos is 1 Night, adopted by 54.7% of listings. This highlights the market's preference for shorter, flexible bookings.
- A strong majority (76.0%) of the Distrito de San Carlos Airbnb data shows acceptance of very short stays (1-2 nights), indicating a dynamic, high-turnover market.
- A significant segment (21.3%) caters to monthly stays (30+ nights) in Distrito de San Carlos, pointing to opportunities in the extended-stay market.
Recommendations
- Align with the market by considering a 1 Night minimum stay, as 54.7% of Distrito de San Carlos hosts use this setting.
- Explore offering discounts for stays of 30+ nights to attract the 21.3% of the market seeking extended stays.
- Adjust minimum nights based on seasonality – potentially shorter during low season and longer during peak demand periods in Distrito de San Carlos.
Distrito de San Carlos Airbnb Cancellation Policy Trends Analysis (2026)
Limited
3 listings
4% of total
Flexible
19 listings
25.3% of total
Moderate
34 listings
45.3% of total
Firm
17 listings
22.7% of total
Strict
2 listings
2.7% of total
Cancellation Policy Insights for Distrito de San Carlos
- The prevailing Airbnb cancellation policy trend in Distrito de San Carlos is Moderate, used by 45.3% of listings.
- The market strongly favors guest-friendly terms, with 70.6% of listings offering Flexible or Moderate policies. This suggests guests in Distrito de San Carlos may expect booking flexibility.
- Strict cancellation policies are quite rare (2.7%), potentially making listings with this policy less competitive unless justified by high demand or property type.
Recommendations for Hosts
- Consider adopting a Moderate policy to align with the 45.3% market standard in Distrito de San Carlos.
- Using a Strict policy might deter some guests, as only 2.7% of listings use it. Evaluate if potential revenue protection outweighs possible lower booking rates.
- Regularly review your cancellation policy against competitors and market demand shifts in Distrito de San Carlos.
Distrito de San Carlos STR Booking Lead Time Analysis (2026)
Average Booking Lead Time by Month
Booking Lead Time Insights for Distrito de San Carlos
- The overall average booking lead time for vacation rentals in Distrito de San Carlos is 24 days.
- Guests book furthest in advance for stays during December (average 49 days), likely coinciding with peak travel demand or local events.
- The shortest booking windows occur for stays in July (average 14 days), indicating more last-minute travel plans during this time.
- Seasonally, Winter (35 days avg.) sees the longest lead times, while Summer (18 days avg.) has the shortest, reflecting typical travel planning cycles.
Recommendations for Hosts
- Use the overall average lead time (24 days) as a baseline for your pricing and availability strategy in Distrito de San Carlos.
- For December stays, consider implementing length-of-stay discounts or slightly higher rates for bookings made less than 49 days out to capitalize on advance planning.
- During July, focus on last-minute booking availability and promotions, as guests book with very short notice (14 days avg.).
- Target marketing efforts for the Winter season well in advance (at least 35 days) to capture early planners.
- Monitor your own booking lead times against these Distrito de San Carlos averages to identify opportunities for dynamic pricing adjustments.
Popular & Essential Airbnb Amenities in Distrito de San Carlos (2026)
Amenity Prevalence
Amenity Insights for Distrito de San Carlos
- Essential amenities in Distrito de San Carlos that guests expect include: Free parking on premises, Wifi. Lacking these (any) could significantly impact bookings.
- Popular amenities like Kitchen, Air conditioning, TV are common but not universal. Offering these can provide a competitive edge.
Recommendations for Hosts
- Ensure your listing includes all essential amenities for Distrito de San Carlos: Free parking on premises, Wifi.
- Prioritize adding missing essentials: Free parking on premises, Wifi.
- Consider adding popular differentiators like Kitchen or Air conditioning to increase appeal.
- Highlight unique or less common amenities you offer (e.g., hot tub, dedicated workspace, EV charger) in your listing description and photos.
- Regularly check competitor amenities in Distrito de San Carlos to stay competitive.
Distrito de San Carlos Airbnb Guest Demographics & Profile Analysis (2026)
Guest Profile Summary for Distrito de San Carlos
- The typical guest profile for Airbnb in Distrito de San Carlos consists of primarily domestic travelers (71%), often arriving from nearby Panama City, typically belonging to the Post-2000s (Gen Z/Alpha) group (50%), primarily speaking Spanish or English.
- Domestic travelers account for 70.7% of guests.
- Key international markets include Panama (70.7%) and United States (12.2%).
- Top languages spoken are Spanish (47.3%) followed by English (38.2%).
- A significant demographic segment is the Post-2000s (Gen Z/Alpha) group, representing 50% of guests.
Recommendations for Hosts
- Target domestic marketing efforts towards travelers from Panama City and Panama.
- Tailor amenities and listing descriptions to appeal to the dominant Post-2000s (Gen Z/Alpha) demographic (e.g., highlight fast WiFi, smart home features, local guides).
- Highlight unique local experiences or amenities relevant to the primary guest profile.
- Consider seasonal promotions aligned with peak travel times for key origin markets.
Nearby Short-Term Rental Market Comparison
How does the Distrito de San Carlos Airbnb market stack up against its neighbors? Compare key performance metrics like average monthly revenue, ADR, and occupancy rates in surrounding areas to understand the broader regional STR landscape.
| Market | Active Properties | Monthly Revenue | Daily Rate | Avg. Occupancy |
|---|---|---|---|---|
| Buenaventura | 20 | $4,890 | $468.15 | 34% |
| Maria Chiquita | 67 | $4,328 | $406.29 | 37% |
| Las Escobas del Venado | 70 | $2,317 | $276.78 | 38% |
| Palenque | 10 | $2,139 | $507.89 | 20% |
| El Chirú | 65 | $2,076 | $348.55 | 28% |
| Playa Venao | 70 | $2,019 | $272.09 | 33% |
| San Blas Islands | 33 | $1,776 | $400.01 | 25% |
| Altos del Maria | 19 | $1,727 | $167.91 | 38% |
| Saboga | 62 | $1,721 | $341.99 | 27% |
| María Chiquita | 56 | $1,645 | $242.36 | 25% |