24 de Diciembre Airbnb Market Analysis 2026: Short Term Rental Data & Vacation Rental Statistics in Panamá Province, Panama
Is Airbnb profitable in 24 de Diciembre in 2026? Explore comprehensive Airbnb analytics for 24 de Diciembre, Panamá Province, Panama to uncover income potential. This 2026 STR market report for 24 de Diciembre, based on AirROI data from February 2025 to January 2026, reveals key trends in the niche market of 33 active listings.
Whether you're considering an Airbnb investment in 24 de Diciembre, optimizing your existing vacation rental, or exploring rental arbitrage opportunities, understanding the 24 de Diciembre Airbnb data is crucial. Leveraging the low regulation environment is key to maximizing your short term rental income potential. Let's dive into the specifics.
Key 24 de Diciembre Airbnb Performance Metrics Overview
Monthly Airbnb Revenue Variations & Income Potential in 24 de Diciembre (2026)
Understanding the monthly revenue variations for Airbnb listings in 24 de Diciembre is key to maximizing your short term rental income potential. Seasonality significantly impacts earnings. Our analysis, based on data from the past 12 months, shows that the peak revenue month for STRs in 24 de Diciembre is typically March, while June often presents the lowest earnings, highlighting opportunities for strategic pricing adjustments during shoulder and low seasons. Explore the typical Airbnb income in 24 de Diciembre across different performance tiers:
- Best-in-class properties (Top 10%) achieve $4,183+ monthly, often utilizing dynamic pricing and superior guest experiences.
- Strong performing properties (Top 25%) earn $1,837 or more, indicating effective management and desirable locations/amenities.
- Typical properties (Median) generate around $861 per month, representing the average market performance.
- Entry-level properties (Bottom 25%) see earnings around $386, often with potential for optimization.
Average Monthly Airbnb Earnings Trend in 24 de Diciembre
24 de Diciembre Airbnb Occupancy Rate Trends (2026)
Maximize your bookings by understanding the 24 de Diciembre STR occupancy trends. Seasonal demand shifts significantly influence how often properties are booked. Typically, Februarysees the highest demand (peak season occupancy), while June experiences the lowest (low season). Effective strategies, like adjusting minimum stays or offering promotions, can boost occupancy during slower periods. Here's how different property tiers perform in 24 de Diciembre:
- Best-in-class properties (Top 10%) achieve 57%+ occupancy, indicating high desirability and potentially optimized availability.
- Strong performing properties (Top 25%) maintain 45% or higher occupancy, suggesting good market fit and guest satisfaction.
- Typical properties (Median) have an occupancy rate around 22%.
- Entry-level properties (Bottom 25%) average 10% occupancy, potentially facing higher vacancy.
Average Monthly Occupancy Rate Trend in 24 de Diciembre
Average Daily Rate (ADR) Airbnb Trends in 24 de Diciembre (2026)
Effective short term rental pricing strategy in 24 de Diciembre involves understanding monthly ADR fluctuations. The Average Daily Rate (ADR) for Airbnb in 24 de Diciembre typically peaks in February and dips lowest during April. Leveraging Airbnb dynamic pricing tools or strategies based on this seasonality can significantly boost revenue. Here's a look at the typical nightly rates achieved:
- Best-in-class properties (Top 10%) command rates of $368+ per night, often due to premium features or locations.
- Strong performing properties (Top 25%) achieve nightly rates of $179 or more.
- Typical properties (Median) charge around $122 per night.
- Entry-level properties (Bottom 25%) earn around $86 per night.
Average Daily Rate (ADR) Trend by Month in 24 de Diciembre
Get Live 24 de Diciembre Market Intelligence 👇

Explore Real-time Analytics
Airbnb Seasonality Analysis & Trends in 24 de Diciembre (2026)
Peak Season (March, November, October)
- Revenue averages $2,036 per month
- Occupancy rates average 31.1%
- Daily rates average $172
Shoulder Season
- Revenue averages $1,585 per month
- Occupancy maintains around 28.5%
- Daily rates hold near $175
Low Season (June, July, September)
- Revenue drops to average $1,234 per month
- Occupancy decreases to average 25.0%
- Daily rates adjust to average $171
Seasonality Insights for 24 de Diciembre
- The Airbnb seasonality in 24 de Diciembre shows moderate seasonality with distinct peak and low periods. While the sections above show seasonal averages, it's also insightful to look at the extremes:
- During the high season, the absolute peak month showcases 24 de Diciembre's highest earning potential, with monthly revenues capable of climbing to $2,060, occupancy reaching a high of 36.8%, and ADRs peaking at $185.
- Conversely, the slowest single month of the year, typically falling within the low season, marks the market's lowest point. In this month, revenue might dip to $1,149, occupancy could drop to 23.3%, and ADRs may adjust down to $164.
- Understanding both the seasonal averages and these monthly peaks and troughs in revenue, occupancy, and ADR is crucial for maximizing your Airbnb profit potential in 24 de Diciembre.
Seasonal Strategies for Maximizing Profit
- Peak Season: Maximize revenue through premium pricing and potentially longer minimum stays. Ensure high availability.
- Low Season: Offer competitive pricing, special promotions (e.g., extended stay discounts), and flexible cancellation policies. Target off-season travelers like remote workers or budget-conscious guests.
- Shoulder Seasons: Implement dynamic pricing that balances peak and low rates. Target weekend travelers or specific events. Offer slightly more flexible terms than peak season.
- Regularly analyze your own performance against these 24 de Diciembre seasonality benchmarks and adjust your pricing and availability strategy accordingly.
Best Areas for Airbnb Investment in 24 de Diciembre (2026)
Exploring the top neighborhoods for short-term rentals in 24 de Diciembre? This section highlights key areas, outlining why they are attractive for hosts and guests, along with notable local attractions. Consider these locations based on your target guest profile and investment strategy.
| Neighborhood / Area | Why Host Here? (Target Guests & Appeal) | Key Attractions & Landmarks |
|---|---|---|
| San Francisco | A vibrant community in 24 de Diciembre, known for its local culture and proximity to Panama City. Ideal for travelers seeking authentic Panamanian experiences. | Centro Comercial Los Pueblos, Parque de la Paz, Local food markets, Artisan craft shops, Distilleries of local rum |
| Los Pueblos | A busy commercial area that attracts both locals and tourists, making it ideal for Airbnb hosting with high foot traffic. | Los Pueblos Mall, Food courts, Variety of shops, Cultural activities, Convenient access to public transport |
| Tocumen | Close to the international airport, Tocumen is a prime area for travelers arriving or departing Panama, offering convenience and accessibility. | Tocumen International Airport, Local restaurants, Nearby parks, Transport hubs to the city, Shopping areas |
| Cerro Azul | A more residential and nature-oriented area, perfect for those seeking tranquility and proximity to nature while still being close to city amenities. | Natural parks, Hiking trails, Local community events, Birdwatching, Beautiful views of the Panama Canal |
| La Mitad del Mundo | A unique geographical spot, this area attracts many tourists who are interested in the equator and its significance. | Equatorial monuments, Cultural tours, Photography opportunities, Local markets, Visitor centers |
| Pacora | A growing suburb with a mix of urban and rural charm, appealing to families and travelers looking for a local experience. | Local parks, Community festivals, Street food, Cultural heritage sites, Close-knit community vibes |
| Veracruz | A scenic coastal area with beautiful beaches and a unique fishing village atmosphere, perfect for beach lovers. | Beaches, Seafood restaurants, Water sports, Local fishing activities, Scenic views |
| Chilibre | Nestled in the hills, this area offers a blend of nature and urban living, making it appealing to both locals and tourists. | Hiking trails, Natural landscapes, Local wildlife, Community events, Panama Canal views |
Understanding Airbnb License Requirements & STR Laws in 24 de Diciembre (2026)
While 24 de Diciembre, Panamá Province, Panama currently shows low STR regulations, specific Airbnb license requirements might still exist or change. Always verify the latest short term rental regulations and Airbnb license requirements directly with local government authorities for 24 de Diciembre to ensure full compliance before hosting.
(Source: AirROI data, 2026, finding no licensed listings among those analyzed)
Top Performing Airbnb Properties in 24 de Diciembre (2026)
Benchmark your potential! Explore examples of top-performing Airbnb properties in 24 de Diciembrebased on Trailing Twelve Month (TTM) revenue. Analyze their characteristics, revenue, occupancy rate, and ADR to understand what drives success in this market.
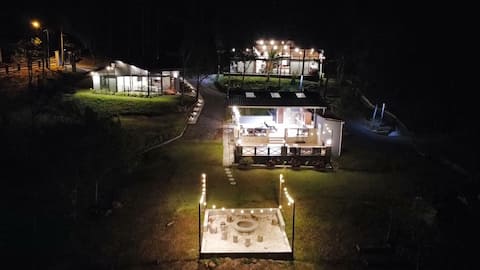
Hyde Hills 2 Luxury Mountain Cabins stunning view
Entire Place • 3 bedrooms

Hyde Hills Luxury Mountain cabin with amazing view
Entire Place • 2 bedrooms
Mountain Retreat
Entire Place • 4 bedrooms

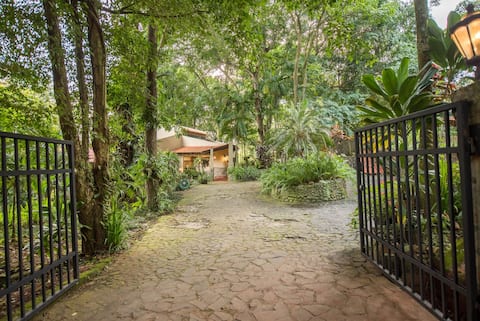
Hacienda La Perezosa in Cerro Azul
Entire Place • 4 bedrooms

Hyde hill Luxury Cabin with amazing views
Entire Place • 1 bedroom
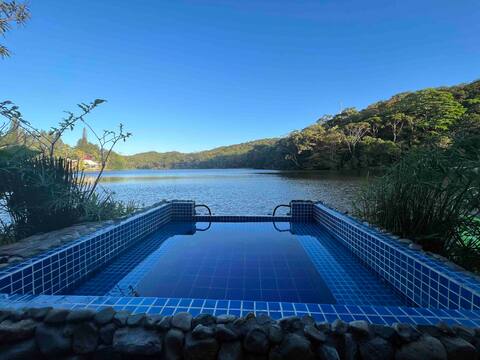
#1 Cabin on the Lake Cerro Azul
Entire Place • 1 bedroom
Note: Performance varies based on location, size, amenities, seasonality, and management quality. Data reflects the past 12 months.
Top Performing Airbnb Hosts in 24 de Diciembre (2026)
Learn from the best! This table showcases top-performing Airbnb hosts in 24 de Diciembre based on the number of properties managed and estimated total revenue over the past year. Analyze their scale and performance metrics.
| Host Name | Properties | Grossing Revenue | Stay Reviews | Avg Rating |
|---|---|---|---|---|
| Jose | 3 | $185,250 | 91 | 4.97/5.0 |
| Irina | 7 | $70,398 | 94 | 4.84/5.0 |
| Rebeca | 1 | $44,822 | 64 | 4.98/5.0 |
| Jose Maria | 1 | $41,432 | 23 | 4.96/5.0 |
| Arthur Y Mara | 2 | $27,046 | 163 | 4.91/5.0 |
| Manuel | 1 | $20,574 | 30 | 5.00/5.0 |
| Marco Antonio | 1 | $16,083 | 102 | 4.76/5.0 |
| Ariel | 1 | $13,128 | 76 | 4.67/5.0 |
| Jennifer | 1 | $10,539 | 10 | 4.50/5.0 |
| Nilsa | 1 | $8,205 | 10 | 4.90/5.0 |
Analyzing the strategies of top hosts, such as their property selection, pricing, and guest communication, can offer valuable lessons for optimizing your own Airbnb operations in 24 de Diciembre.
Dive Deeper: Advanced 24 de Diciembre STR Market Data (2026)
Ready to unlock more insights? AirROI provides access to advanced metrics and comprehensive Airbnb data for 24 de Diciembre. Explore detailed analytics beyond this report to refine your investment strategy, optimize pricing, and maximize your vacation rental profits.
Explore Advanced Metrics24 de Diciembre Short-Term Rental Market Composition (2026): Property & Room Types
Room Type Distribution
Property Type Distribution
Market Composition Insights for 24 de Diciembre
- The 24 de Diciembre Airbnb market composition is heavily skewed towards Entire Home/Apt listings, which make up 84.8% of the 33 active rentals. This indicates strong guest preference for privacy and space.
- Looking at the property type distribution in 24 de Diciembre, Outdoor/Unique properties are the most common (48.5%), reflecting the local real estate landscape.
- Houses represent a significant 33.3% portion, catering likely to families or larger groups.
- The presence of 6.1% Hotel/Boutique listings indicates integration with traditional hospitality.
- Smaller segments like others, unique stays (combined 6.0%) offer potential for unique stay experiences.
24 de Diciembre Airbnb Room Capacity Analysis (2026): Bedroom Distribution
Distribution of Listings by Number of Bedrooms
Room Capacity Insights for 24 de Diciembre
- The dominant room capacity in 24 de Diciembre is 1 bedroom listings, making up 39.4% of the market. This suggests a strong demand for properties suitable for couples or solo travelers.
- Together, 1 bedroom and 2 bedrooms properties represent 69.7% of the active Airbnb listings in 24 de Diciembre, indicating a high concentration in these sizes.
- A significant 24.3% of listings offer 3+ bedrooms, catering to larger groups and families seeking more space in 24 de Diciembre.
24 de Diciembre Vacation Rental Guest Capacity Trends (2026)
Distribution of Listings by Guest Capacity
Guest Capacity Insights for 24 de Diciembre
- The most common guest capacity trend in 24 de Diciembre vacation rentals is listings accommodating 4 guests (30.3%). This suggests the primary traveler segment is likely small families or groups.
- Properties designed for 4 guests and 8+ guests dominate the 24 de Diciembre STR market, accounting for 57.6% of listings.
- 36.4% of properties accommodate 6+ guests, serving the market segment for larger families or group travel in 24 de Diciembre.
- On average, properties in 24 de Diciembre are equipped to host 4.8 guests.
24 de Diciembre Airbnb Booking Patterns (2026): Available vs. Booked Days
Available Days Distribution
Booked Days Distribution
Booking Pattern Insights for 24 de Diciembre
- The most common availability pattern in 24 de Diciembre falls within the 271-366 days range, representing 60.6% of listings. This suggests many properties have significant open periods on their calendars.
- Approximately 87.9% of listings show high availability (181+ days open annually), indicating potential for increased bookings or specific owner usage patterns.
- For booked days, the 1-30 days range is most frequent in 24 de Diciembre (33.3%), reflecting common guest stay durations or potential owner blocking patterns.
- A notable 12.1% of properties secure long booking periods (181+ days booked per year), highlighting successful long-term rental strategies or significant owner usage.
24 de Diciembre Airbnb Minimum Stay Requirements Analysis
Distribution of Listings by Minimum Night Requirement
1 Night
23 listings
69.7% of total
2 Nights
3 listings
9.1% of total
30+ Nights
7 listings
21.2% of total
Key Insights
- The most prevalent minimum stay requirement in 24 de Diciembre is 1 Night, adopted by 69.7% of listings. This highlights the market's preference for shorter, flexible bookings.
- A strong majority (78.8%) of the 24 de Diciembre Airbnb data shows acceptance of very short stays (1-2 nights), indicating a dynamic, high-turnover market.
- A significant segment (21.2%) caters to monthly stays (30+ nights) in 24 de Diciembre, pointing to opportunities in the extended-stay market.
Recommendations
- Align with the market by considering a 1 Night minimum stay, as 69.7% of 24 de Diciembre hosts use this setting.
- Explore offering discounts for stays of 30+ nights to attract the 21.2% of the market seeking extended stays.
- Adjust minimum nights based on seasonality – potentially shorter during low season and longer during peak demand periods in 24 de Diciembre.
24 de Diciembre Airbnb Cancellation Policy Trends Analysis (2026)
Flexible
12 listings
36.4% of total
Moderate
8 listings
24.2% of total
Firm
12 listings
36.4% of total
Strict
1 listings
3% of total
Cancellation Policy Insights for 24 de Diciembre
- The prevailing Airbnb cancellation policy trend in 24 de Diciembre is Flexible, used by 36.4% of listings.
- There's a relatively balanced mix between guest-friendly (60.6%) and stricter (39.4%) policies, offering choices for different guest needs.
- Strict cancellation policies are quite rare (3%), potentially making listings with this policy less competitive unless justified by high demand or property type.
Recommendations for Hosts
- Consider adopting a Flexible policy to align with the 36.4% market standard in 24 de Diciembre.
- Using a Strict policy might deter some guests, as only 3% of listings use it. Evaluate if potential revenue protection outweighs possible lower booking rates.
- Regularly review your cancellation policy against competitors and market demand shifts in 24 de Diciembre.
24 de Diciembre STR Booking Lead Time Analysis (2026)
Average Booking Lead Time by Month
Booking Lead Time Insights for 24 de Diciembre
- The overall average booking lead time for vacation rentals in 24 de Diciembre is 20 days.
- Guests book furthest in advance for stays during December (average 42 days), likely coinciding with peak travel demand or local events.
- The shortest booking windows occur for stays in October (average 10 days), indicating more last-minute travel plans during this time.
- Seasonally, Winter (26 days avg.) sees the longest lead times, while Summer (15 days avg.) has the shortest, reflecting typical travel planning cycles.
Recommendations for Hosts
- Use the overall average lead time (20 days) as a baseline for your pricing and availability strategy in 24 de Diciembre.
- For December stays, consider implementing length-of-stay discounts or slightly higher rates for bookings made less than 42 days out to capitalize on advance planning.
- During October, focus on last-minute booking availability and promotions, as guests book with very short notice (10 days avg.).
- Target marketing efforts for the Winter season well in advance (at least 26 days) to capture early planners.
- Monitor your own booking lead times against these 24 de Diciembre averages to identify opportunities for dynamic pricing adjustments.
Popular & Essential Airbnb Amenities in 24 de Diciembre (2026)
Amenity Prevalence
Amenity Insights for 24 de Diciembre
- Essential amenities in 24 de Diciembre that guests expect include: Wifi. Lacking these (this) could significantly impact bookings.
- Popular amenities like Free parking on premises, TV, Kitchen are common but not universal. Offering these can provide a competitive edge.
Recommendations for Hosts
- Ensure your listing includes all essential amenities for 24 de Diciembre: Wifi.
- Prioritize adding missing essentials: Wifi.
- Consider adding popular differentiators like Free parking on premises or TV to increase appeal.
- Highlight unique or less common amenities you offer (e.g., hot tub, dedicated workspace, EV charger) in your listing description and photos.
- Regularly check competitor amenities in 24 de Diciembre to stay competitive.
24 de Diciembre Airbnb Guest Demographics & Profile Analysis (2026)
Guest Profile Summary for 24 de Diciembre
- The typical guest profile for Airbnb in 24 de Diciembre consists of a mix of domestic (52%) and international guests, often arriving from nearby Panama City, typically belonging to the Post-2000s (Gen Z/Alpha) group (50%), primarily speaking Spanish or English.
- Domestic travelers account for 52.1% of guests.
- Key international markets include Panama (52.1%) and United States (28.2%).
- Top languages spoken are Spanish (45.5%) followed by English (38.6%).
- A significant demographic segment is the Post-2000s (Gen Z/Alpha) group, representing 50% of guests.
Recommendations for Hosts
- Balance marketing efforts between domestic and international channels based on the guest mix.
- Tailor amenities and listing descriptions to appeal to the dominant Post-2000s (Gen Z/Alpha) demographic (e.g., highlight fast WiFi, smart home features, local guides).
- Highlight unique local experiences or amenities relevant to the primary guest profile.
- Consider seasonal promotions aligned with peak travel times for key origin markets.
Nearby Short-Term Rental Market Comparison
How does the 24 de Diciembre Airbnb market stack up against its neighbors? Compare key performance metrics like average monthly revenue, ADR, and occupancy rates in surrounding areas to understand the broader regional STR landscape.
| Market | Active Properties | Monthly Revenue | Daily Rate | Avg. Occupancy |
|---|---|---|---|---|
| Buenaventura | 20 | $4,890 | $468.15 | 34% |
| Maria Chiquita | 67 | $4,328 | $406.29 | 37% |
| Palenque | 10 | $2,139 | $507.89 | 20% |
| El Chirú | 65 | $2,076 | $348.55 | 28% |
| San Blas Islands | 33 | $1,776 | $400.01 | 25% |
| Altos del Maria | 19 | $1,727 | $167.91 | 38% |
| Saboga | 62 | $1,721 | $341.99 | 27% |
| María Chiquita | 56 | $1,645 | $242.36 | 25% |
| Narganá | 19 | $1,639 | $358.03 | 22% |
| El Chorrillo | 58 | $1,633 | $108.42 | 52% |