Las Tablas Airbnb Market Analysis 2026: Short Term Rental Data & Vacation Rental Statistics in Los Santos, Panama
Is Airbnb profitable in Las Tablas in 2026? Explore comprehensive Airbnb analytics for Las Tablas, Los Santos, Panama to uncover income potential. This 2026 STR market report for Las Tablas, based on AirROI data from February 2025 to January 2026, reveals key trends in the niche market of 38 active listings.
Whether you're considering an Airbnb investment in Las Tablas, optimizing your existing vacation rental, or exploring rental arbitrage opportunities, understanding the Las Tablas Airbnb data is crucial. Leveraging the low regulation environment is key to maximizing your short term rental income potential. Let's dive into the specifics.
Key Las Tablas Airbnb Performance Metrics Overview
Monthly Airbnb Revenue Variations & Income Potential in Las Tablas (2026)
Understanding the monthly revenue variations for Airbnb listings in Las Tablas is key to maximizing your short term rental income potential. Seasonality significantly impacts earnings. Our analysis, based on data from the past 12 months, shows that the peak revenue month for STRs in Las Tablas is typically March, while October often presents the lowest earnings, highlighting opportunities for strategic pricing adjustments during shoulder and low seasons. Explore the typical Airbnb income in Las Tablas across different performance tiers:
- Best-in-class properties (Top 10%) achieve $1,096+ monthly, often utilizing dynamic pricing and superior guest experiences.
- Strong performing properties (Top 25%) earn $456 or more, indicating effective management and desirable locations/amenities.
- Typical properties (Median) generate around $238 per month, representing the average market performance.
- Entry-level properties (Bottom 25%) see earnings around $120, often with potential for optimization.
Average Monthly Airbnb Earnings Trend in Las Tablas
Las Tablas Airbnb Occupancy Rate Trends (2026)
Maximize your bookings by understanding the Las Tablas STR occupancy trends. Seasonal demand shifts significantly influence how often properties are booked. Typically, Marchsees the highest demand (peak season occupancy), while October experiences the lowest (low season). Effective strategies, like adjusting minimum stays or offering promotions, can boost occupancy during slower periods. Here's how different property tiers perform in Las Tablas:
- Best-in-class properties (Top 10%) achieve 38%+ occupancy, indicating high desirability and potentially optimized availability.
- Strong performing properties (Top 25%) maintain 20% or higher occupancy, suggesting good market fit and guest satisfaction.
- Typical properties (Median) have an occupancy rate around 12%.
- Entry-level properties (Bottom 25%) average 6% occupancy, potentially facing higher vacancy.
Average Monthly Occupancy Rate Trend in Las Tablas
Average Daily Rate (ADR) Airbnb Trends in Las Tablas (2026)
Effective short term rental pricing strategy in Las Tablas involves understanding monthly ADR fluctuations. The Average Daily Rate (ADR) for Airbnb in Las Tablas typically peaks in January and dips lowest during July. Leveraging Airbnb dynamic pricing tools or strategies based on this seasonality can significantly boost revenue. Here's a look at the typical nightly rates achieved:
- Best-in-class properties (Top 10%) command rates of $172+ per night, often due to premium features or locations.
- Strong performing properties (Top 25%) achieve nightly rates of $109 or more.
- Typical properties (Median) charge around $69 per night.
- Entry-level properties (Bottom 25%) earn around $46 per night.
Average Daily Rate (ADR) Trend by Month in Las Tablas
Get Live Las Tablas Market Intelligence 👇

Explore Real-time Analytics
Airbnb Seasonality Analysis & Trends in Las Tablas (2026)
Peak Season (March, November, December)
- Revenue averages $606 per month
- Occupancy rates average 20.2%
- Daily rates average $95
Shoulder Season
- Revenue averages $418 per month
- Occupancy maintains around 17.0%
- Daily rates hold near $90
Low Season (May, August, October)
- Revenue drops to average $227 per month
- Occupancy decreases to average 10.4%
- Daily rates adjust to average $90
Seasonality Insights for Las Tablas
- The Airbnb seasonality in Las Tablas shows highly seasonal trends requiring careful strategy. While the sections above show seasonal averages, it's also insightful to look at the extremes:
- During the high season, the absolute peak month showcases Las Tablas's highest earning potential, with monthly revenues capable of climbing to $681, occupancy reaching a high of 24.4%, and ADRs peaking at $99.
- Conversely, the slowest single month of the year, typically falling within the low season, marks the market's lowest point. In this month, revenue might dip to $165, occupancy could drop to 6.9%, and ADRs may adjust down to $85.
- Understanding both the seasonal averages and these monthly peaks and troughs in revenue, occupancy, and ADR is crucial for maximizing your Airbnb profit potential in Las Tablas.
Seasonal Strategies for Maximizing Profit
- Peak Season: Maximize revenue through premium pricing and potentially longer minimum stays. Ensure high availability.
- Low Season: Offer competitive pricing, special promotions (e.g., extended stay discounts), and flexible cancellation policies. Target off-season travelers like remote workers or budget-conscious guests.
- Shoulder Seasons: Implement dynamic pricing that balances peak and low rates. Target weekend travelers or specific events. Offer slightly more flexible terms than peak season.
- Regularly analyze your own performance against these Las Tablas seasonality benchmarks and adjust your pricing and availability strategy accordingly.
Best Areas for Airbnb Investment in Las Tablas (2026)
Exploring the top neighborhoods for short-term rentals in Las Tablas? This section highlights key areas, outlining why they are attractive for hosts and guests, along with notable local attractions. Consider these locations based on your target guest profile and investment strategy.
| Neighborhood / Area | Why Host Here? (Target Guests & Appeal) | Key Attractions & Landmarks |
|---|---|---|
| Playa Las Tablas | Famous for its stunning beaches and vibrant local culture, this area attracts sun-seekers and cultural enthusiasts alike. It offers a relaxed atmosphere and access to various outdoor activities. | Las Tablas Beach, Local seafood restaurants, Cultural festivals, Surfing opportunities, Scenic coastal views |
| Centro de Las Tablas | The heart of Las Tablas, filled with local shops, cafes, and cultural sites. It provides guests with an authentic Panamanian experience and access to local festivities. | Plaza de Las Tablas, Local markets, Catedral de San Francisco de Asís, Town square events, Artisan shops |
| Torres de Las Tablas | A relatively quiet residential area that offers beautiful views and a peaceful environment, appealing to families and travelers seeking tranquility away from the hustle. | Scenic views, Local neighborhoods, Nature walks, Peaceful ambiance, Cultural interactions |
| Isla Cañas | Known for its pristine beaches and nature, this area is a haven for eco-tourism and is popular among bird watchers and nature lovers, offering a unique getaway experience. | Isla Cañas Beach, Turtle conservation projects, Nature tours, Bird watching opportunities, Relaxing beachfront |
| La Villa de Los Santos | A nearby town rich in history and culture, providing guests with an experience of traditional Panamanian life, complete with historic sites and local events. | Historical sites, Local festivals, Authentic cuisine, Cultural events, Friendly locals |
| Santa Clara | A coastal town close to Las Tablas, offering stunning beaches and a more tranquil setting, ideal for families and couples looking for a romantic getaway. | Santa Clara Beach, Beachfront resorts, Water sports, Relaxation spots, Sunset views |
| Cañas | An area known for its lush greenery and scenic landscapes, perfect for nature lovers looking to escape and enjoy hiking, birdwatching, and outdoor activities. | Hiking trails, Natural parks, Wildlife viewing, Rivers and waterfalls, Eco-friendly experiences |
| San Francisco | A residential area with a blend of local culture and modern amenities, attracting families and business travelers alike. It boasts convenience and comfort with access to the main attractions. | Local parks, Shopping centers, Cafes and restaurants, Family-friendly activities, Cultural events |
Understanding Airbnb License Requirements & STR Laws in Las Tablas (2026)
While Las Tablas, Los Santos, Panama currently shows low STR regulations, specific Airbnb license requirements might still exist or change. Always verify the latest short term rental regulations and Airbnb license requirements directly with local government authorities for Las Tablas to ensure full compliance before hosting.
(Source: AirROI data, 2026, finding no licensed listings among those analyzed)
Top Performing Airbnb Properties in Las Tablas (2026)
Benchmark your potential! Explore examples of top-performing Airbnb properties in Las Tablasbased on Trailing Twelve Month (TTM) revenue. Analyze their characteristics, revenue, occupancy rate, and ADR to understand what drives success in this market.
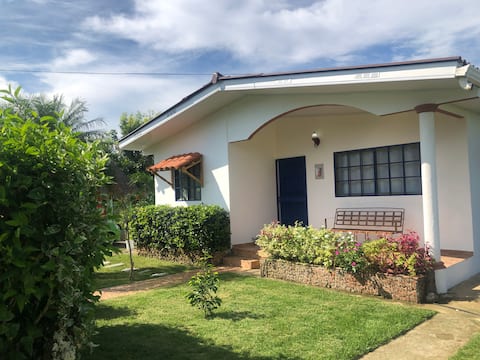
Cozy country home
Entire Place • 3 bedrooms
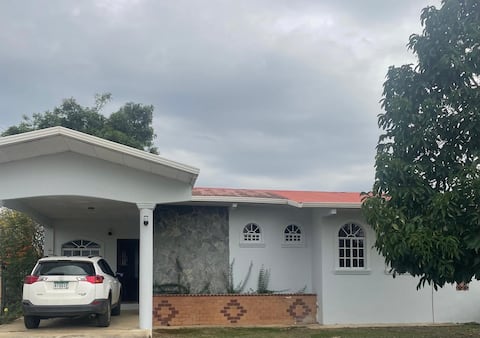
Town and Beach
Entire Place • 3 bedrooms
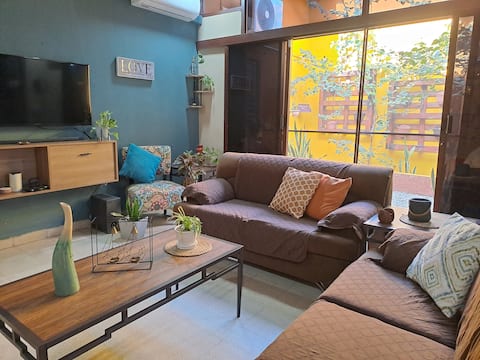
House in the center of Las Tablas
Entire Place • 3 bedrooms
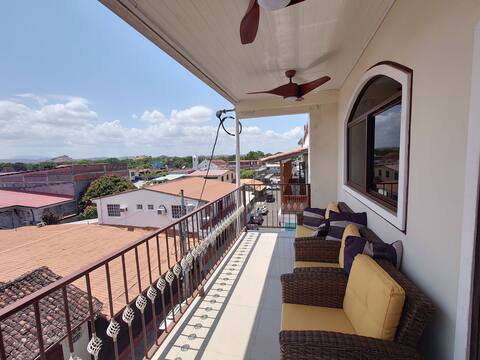
3rd floor in Las Tablas next to the Hotel Presidente
Entire Place • 2 bedrooms

House in Plaza Praga - Las Tablas
Entire Place • 2 bedrooms
Beautiful 2 Story Cozy Beach House (Fast WiFi)
Entire Place • 2 bedrooms
Note: Performance varies based on location, size, amenities, seasonality, and management quality. Data reflects the past 12 months.
Top Performing Airbnb Hosts in Las Tablas (2026)
Learn from the best! This table showcases top-performing Airbnb hosts in Las Tablas based on the number of properties managed and estimated total revenue over the past year. Analyze their scale and performance metrics.
| Host Name | Properties | Grossing Revenue | Stay Reviews | Avg Rating |
|---|---|---|---|---|
| Lida | 1 | $12,900 | 84 | 4.75/5.0 |
| Aldreith | 6 | $11,822 | 25 | 4.97/5.0 |
| Cobi | 1 | $10,605 | 5 | 5.00/5.0 |
| Euribiades | 2 | $8,581 | 4 | 5.00/5.0 |
| Lionel | 1 | $7,775 | 39 | 4.97/5.0 |
| Ana Gabriela | 3 | $6,680 | 118 | 4.75/5.0 |
| Rosnin Alcides | 1 | $5,919 | 24 | 4.71/5.0 |
| Meylin | 1 | $5,840 | 4 | 5.00/5.0 |
| Luis | 1 | $5,365 | 162 | 4.72/5.0 |
| Mario Elias | 3 | $3,893 | 22 | 4.94/5.0 |
Analyzing the strategies of top hosts, such as their property selection, pricing, and guest communication, can offer valuable lessons for optimizing your own Airbnb operations in Las Tablas.
Dive Deeper: Advanced Las Tablas STR Market Data (2026)
Ready to unlock more insights? AirROI provides access to advanced metrics and comprehensive Airbnb data for Las Tablas. Explore detailed analytics beyond this report to refine your investment strategy, optimize pricing, and maximize your vacation rental profits.
Explore Advanced MetricsLas Tablas Short-Term Rental Market Composition (2026): Property & Room Types
Room Type Distribution
Property Type Distribution
Market Composition Insights for Las Tablas
- The Las Tablas Airbnb market composition is heavily skewed towards Entire Home/Apt listings, which make up 68.4% of the 38 active rentals. This indicates strong guest preference for privacy and space.
- However, a notable 31.6% share for Private Rooms suggests opportunities for budget-conscious travelers or hosts renting out spare rooms.
- Looking at the property type distribution in Las Tablas, House properties are the most common (73.7%), reflecting the local real estate landscape.
- Houses represent a significant 73.7% portion, catering likely to families or larger groups.
Las Tablas Airbnb Room Capacity Analysis (2026): Bedroom Distribution
Distribution of Listings by Number of Bedrooms
Room Capacity Insights for Las Tablas
- The dominant room capacity in Las Tablas is 2 bedrooms listings, making up 36.8% of the market. This suggests a strong demand for properties suitable for couples or solo travelers.
- Together, 2 bedrooms and 3 bedrooms properties represent 55.2% of the active Airbnb listings in Las Tablas, indicating a high concentration in these sizes.
Las Tablas Vacation Rental Guest Capacity Trends (2026)
Distribution of Listings by Guest Capacity
Guest Capacity Insights for Las Tablas
- The most common guest capacity trend in Las Tablas vacation rentals is listings accommodating 4 guests (26.3%). This suggests the primary traveler segment is likely small families or groups.
- Properties designed for 4 guests and 6 guests dominate the Las Tablas STR market, accounting for 44.7% of listings.
- 31.6% of properties accommodate 6+ guests, serving the market segment for larger families or group travel in Las Tablas.
- On average, properties in Las Tablas are equipped to host 3.7 guests.
Las Tablas Airbnb Booking Patterns (2026): Available vs. Booked Days
Available Days Distribution
Booked Days Distribution
Booking Pattern Insights for Las Tablas
- The most common availability pattern in Las Tablas falls within the 271-366 days range, representing 97.4% of listings. This suggests many properties have significant open periods on their calendars.
- Approximately 100.0% of listings show high availability (181+ days open annually), indicating potential for increased bookings or specific owner usage patterns.
- For booked days, the 1-30 days range is most frequent in Las Tablas (57.9%), reflecting common guest stay durations or potential owner blocking patterns.
Las Tablas Airbnb Minimum Stay Requirements Analysis
Distribution of Listings by Minimum Night Requirement
1 Night
21 listings
55.3% of total
2 Nights
11 listings
28.9% of total
30+ Nights
6 listings
15.8% of total
Key Insights
- The most prevalent minimum stay requirement in Las Tablas is 1 Night, adopted by 55.3% of listings. This highlights the market's preference for shorter, flexible bookings.
- A strong majority (84.2%) of the Las Tablas Airbnb data shows acceptance of very short stays (1-2 nights), indicating a dynamic, high-turnover market.
- A significant segment (15.8%) caters to monthly stays (30+ nights) in Las Tablas, pointing to opportunities in the extended-stay market.
Recommendations
- Align with the market by considering a 1 Night minimum stay, as 55.3% of Las Tablas hosts use this setting.
- Explore offering discounts for stays of 30+ nights to attract the 15.8% of the market seeking extended stays.
- Adjust minimum nights based on seasonality – potentially shorter during low season and longer during peak demand periods in Las Tablas.
Las Tablas Airbnb Cancellation Policy Trends Analysis (2026)
Flexible
14 listings
36.8% of total
Moderate
7 listings
18.4% of total
Firm
16 listings
42.1% of total
Strict
1 listings
2.6% of total
Cancellation Policy Insights for Las Tablas
- The prevailing Airbnb cancellation policy trend in Las Tablas is Firm, used by 42.1% of listings.
- There's a relatively balanced mix between guest-friendly (55.2%) and stricter (44.7%) policies, offering choices for different guest needs.
- Strict cancellation policies are quite rare (2.6%), potentially making listings with this policy less competitive unless justified by high demand or property type.
Recommendations for Hosts
- Consider adopting a Firm policy to align with the 42.1% market standard in Las Tablas.
- Using a Strict policy might deter some guests, as only 2.6% of listings use it. Evaluate if potential revenue protection outweighs possible lower booking rates.
- Regularly review your cancellation policy against competitors and market demand shifts in Las Tablas.
Las Tablas STR Booking Lead Time Analysis (2026)
Average Booking Lead Time by Month
Booking Lead Time Insights for Las Tablas
- The overall average booking lead time for vacation rentals in Las Tablas is 44 days.
- Guests book furthest in advance for stays during January (average 72 days), likely coinciding with peak travel demand or local events.
- The shortest booking windows occur for stays in June (average 13 days), indicating more last-minute travel plans during this time.
- Seasonally, Winter (57 days avg.) sees the longest lead times, while Summer (23 days avg.) has the shortest, reflecting typical travel planning cycles.
Recommendations for Hosts
- Use the overall average lead time (44 days) as a baseline for your pricing and availability strategy in Las Tablas.
- For January stays, consider implementing length-of-stay discounts or slightly higher rates for bookings made less than 72 days out to capitalize on advance planning.
- During June, focus on last-minute booking availability and promotions, as guests book with very short notice (13 days avg.).
- Target marketing efforts for the Winter season well in advance (at least 57 days) to capture early planners.
- Monitor your own booking lead times against these Las Tablas averages to identify opportunities for dynamic pricing adjustments.
Popular & Essential Airbnb Amenities in Las Tablas (2026)
Amenity Prevalence
Amenity Insights for Las Tablas
- Popular amenities like Air conditioning, Kitchen, Free parking on premises are common but not universal. Offering these can provide a competitive edge.
- Warning: Wifi is not universally provided but is considered essential globally. Ensure reliable Wifi is offered.
Recommendations for Hosts
- Consider adding popular differentiators like Air conditioning or Kitchen to increase appeal.
- Highlight unique or less common amenities you offer (e.g., hot tub, dedicated workspace, EV charger) in your listing description and photos.
- Regularly check competitor amenities in Las Tablas to stay competitive.
Las Tablas Airbnb Guest Demographics & Profile Analysis (2026)
Guest Profile Summary for Las Tablas
- The typical guest profile for Airbnb in Las Tablas consists of a mix of domestic (63%) and international guests, often arriving from nearby Panama City, typically belonging to the Post-2000s (Gen Z/Alpha) group (50%), primarily speaking Spanish or English.
- Domestic travelers account for 63.3% of guests.
- Key international markets include Panama (63.3%) and United States (24.5%).
- Top languages spoken are Spanish (50%) followed by English (35%).
- A significant demographic segment is the Post-2000s (Gen Z/Alpha) group, representing 50% of guests.
Recommendations for Hosts
- Target domestic marketing efforts towards travelers from Panama City and Panama.
- Tailor amenities and listing descriptions to appeal to the dominant Post-2000s (Gen Z/Alpha) demographic (e.g., highlight fast WiFi, smart home features, local guides).
- Highlight unique local experiences or amenities relevant to the primary guest profile.
- Consider seasonal promotions aligned with peak travel times for key origin markets.
Nearby Short-Term Rental Market Comparison
How does the Las Tablas Airbnb market stack up against its neighbors? Compare key performance metrics like average monthly revenue, ADR, and occupancy rates in surrounding areas to understand the broader regional STR landscape.
| Market | Active Properties | Monthly Revenue | Daily Rate | Avg. Occupancy |
|---|---|---|---|---|
| Buenaventura | 20 | $4,890 | $468.15 | 34% |
| Las Escobas del Venado | 70 | $2,317 | $276.78 | 38% |
| El Chirú | 65 | $2,076 | $348.55 | 28% |
| Playa Venao | 70 | $2,019 | $272.09 | 33% |
| Altos del Maria | 19 | $1,727 | $167.91 | 38% |
| Saboga | 62 | $1,721 | $341.99 | 27% |
| El Chorrillo | 58 | $1,633 | $108.42 | 52% |
| Panamá | 478 | $1,508 | $122.32 | 49% |
| Panama City | 128 | $1,504 | $124.38 | 49% |
| Sorá | 12 | $1,443 | $193.30 | 26% |