Stryn Airbnb Market Analysis 2026: Short Term Rental Data & Vacation Rental Statistics in Vestland, Norway
Is Airbnb profitable in Stryn in 2026? Explore comprehensive Airbnb analytics for Stryn, Vestland, Norway to uncover income potential. This 2026 STR market report for Stryn, based on AirROI data from February 2025 to January 2026, reveals key trends in the market of 245 active listings.
Whether you're considering an Airbnb investment in Stryn, optimizing your existing vacation rental, or exploring rental arbitrage opportunities, understanding the Stryn Airbnb data is crucial. Leveraging the low regulation environment is key to maximizing your short term rental income potential. Let's dive into the specifics.
Key Stryn Airbnb Performance Metrics Overview
Monthly Airbnb Revenue Variations & Income Potential in Stryn (2026)
Understanding the monthly revenue variations for Airbnb listings in Stryn is key to maximizing your short term rental income potential. Seasonality significantly impacts earnings. Our analysis, based on data from the past 12 months, shows that the peak revenue month for STRs in Stryn is typically July, while January often presents the lowest earnings, highlighting opportunities for strategic pricing adjustments during shoulder and low seasons. Explore the typical Airbnb income in Stryn across different performance tiers:
- Best-in-class properties (Top 10%) achieve $5,652+ monthly, often utilizing dynamic pricing and superior guest experiences.
- Strong performing properties (Top 25%) earn $3,786 or more, indicating effective management and desirable locations/amenities.
- Typical properties (Median) generate around $2,244 per month, representing the average market performance.
- Entry-level properties (Bottom 25%) see earnings around $1,254, often with potential for optimization.
Average Monthly Airbnb Earnings Trend in Stryn
Stryn Airbnb Occupancy Rate Trends (2026)
Maximize your bookings by understanding the Stryn STR occupancy trends. Seasonal demand shifts significantly influence how often properties are booked. Typically, Julysees the highest demand (peak season occupancy), while January experiences the lowest (low season). Effective strategies, like adjusting minimum stays or offering promotions, can boost occupancy during slower periods. Here's how different property tiers perform in Stryn:
- Best-in-class properties (Top 10%) achieve 67%+ occupancy, indicating high desirability and potentially optimized availability.
- Strong performing properties (Top 25%) maintain 51% or higher occupancy, suggesting good market fit and guest satisfaction.
- Typical properties (Median) have an occupancy rate around 34%.
- Entry-level properties (Bottom 25%) average 20% occupancy, potentially facing higher vacancy.
Average Monthly Occupancy Rate Trend in Stryn
Average Daily Rate (ADR) Airbnb Trends in Stryn (2026)
Effective short term rental pricing strategy in Stryn involves understanding monthly ADR fluctuations. The Average Daily Rate (ADR) for Airbnb in Stryn typically peaks in September and dips lowest during March. Leveraging Airbnb dynamic pricing tools or strategies based on this seasonality can significantly boost revenue. Here's a look at the typical nightly rates achieved:
- Best-in-class properties (Top 10%) command rates of $521+ per night, often due to premium features or locations.
- Strong performing properties (Top 25%) achieve nightly rates of $330 or more.
- Typical properties (Median) charge around $221 per night.
- Entry-level properties (Bottom 25%) earn around $146 per night.
Average Daily Rate (ADR) Trend by Month in Stryn
Get Live Stryn Market Intelligence 👇

Explore Real-time Analytics
Airbnb Seasonality Analysis & Trends in Stryn (2026)
Peak Season (July, August, June)
- Revenue averages $5,248 per month
- Occupancy rates average 62.3%
- Daily rates average $281
Shoulder Season
- Revenue averages $2,428 per month
- Occupancy maintains around 32.2%
- Daily rates hold near $272
Low Season (January, February, November)
- Revenue drops to average $1,459 per month
- Occupancy decreases to average 20.3%
- Daily rates adjust to average $271
Seasonality Insights for Stryn
- The Airbnb seasonality in Stryn shows highly seasonal trends requiring careful strategy. While the sections above show seasonal averages, it's also insightful to look at the extremes:
- During the high season, the absolute peak month showcases Stryn's highest earning potential, with monthly revenues capable of climbing to $6,375, occupancy reaching a high of 72.0%, and ADRs peaking at $290.
- Conversely, the slowest single month of the year, typically falling within the low season, marks the market's lowest point. In this month, revenue might dip to $1,273, occupancy could drop to 14.2%, and ADRs may adjust down to $249.
- Understanding both the seasonal averages and these monthly peaks and troughs in revenue, occupancy, and ADR is crucial for maximizing your Airbnb profit potential in Stryn.
Seasonal Strategies for Maximizing Profit
- Peak Season: Maximize revenue through premium pricing and potentially longer minimum stays. Ensure high availability.
- Low Season: Offer competitive pricing, special promotions (e.g., extended stay discounts), and flexible cancellation policies. Target off-season travelers like remote workers or budget-conscious guests.
- Shoulder Seasons: Implement dynamic pricing that balances peak and low rates. Target weekend travelers or specific events. Offer slightly more flexible terms than peak season.
- Regularly analyze your own performance against these Stryn seasonality benchmarks and adjust your pricing and availability strategy accordingly.
Best Areas for Airbnb Investment in Stryn (2026)
Exploring the top neighborhoods for short-term rentals in Stryn? This section highlights key areas, outlining why they are attractive for hosts and guests, along with notable local attractions. Consider these locations based on your target guest profile and investment strategy.
| Neighborhood / Area | Why Host Here? (Target Guests & Appeal) | Key Attractions & Landmarks |
|---|---|---|
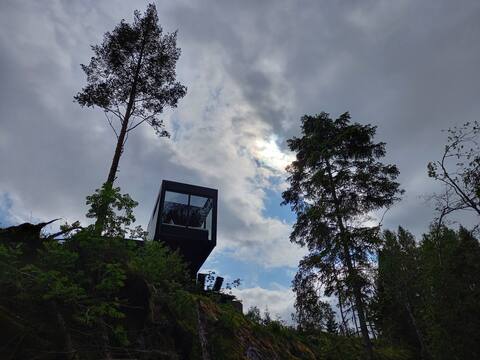
| Stryn Summer Ski Resort | A popular destination for summer skiing and outdoor activities, attracting skiers and snowboarders in the warmer months. Ideal for those who enjoy an active lifestyle and scenic mountain views. | Stryn Glacier, Summer Skiing, Hiking trails, Scenic drives, Outdoor activities |
| Loen | Known for its stunning fjord views and the Loen Skywalk, this area is very popular among tourists seeking breathtaking landscapes and adventure options like hiking and glacier walking. | Loen Skywalk, Briksdal Glacier, Fjord boat trips, Hiking trails, Beautiful fjord views |
| Olden | A picturesque village in the heart of the fjords, famous for its beautiful surroundings and access to Briksdal Glacier. A great spot for nature enthusiasts. | Briksdal Glacier, Olden Church, Fjord walks, Scenic bus tours, Photography opportunities |
| Stryn Village | The local hub with amenities such as shops, cafes, and culture, appealing to tourists who wish to experience the local lifestyle while being close to attractions. | Stryn Church, Local museums, Cafes and restaurants, Shopping opportunities, Community events |
| North Fjord | A stunning area along the fjord, it offers beautiful scenery, and visitors are often drawn to the natural beauty for relaxation and adventure activities. | Fjord cruises, Hiking paths, Sightseeing tours, Fishing spots, Nature photography |
| Nordsida | A quiet and beautiful area popular for its beautiful landscapes and proximity to the fjord, perfect for those seeking peace and nature. | Fjord views, Hiking opportunities, Tranquil surroundings, Local wildlife, Scenic viewpoints |
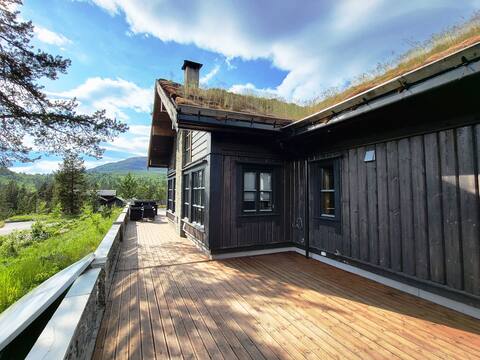
| Brekke | Known for its rural charm, Brekke offers a glimpse into traditional Norwegian life and is a great area for those looking to escape into nature. | Traditional farms, Local cultural experiences, Hiking, Nature spots, Community activities |
| Myrkdalen | A popular ski resort in the region that attracts winter sports enthusiasts, making it appealing for those looking to host during winter. | Skiing and snowboarding, Winter sports activities, Cozy accommodations, Scenic winter landscapes, Cable car rides |
Understanding Airbnb License Requirements & STR Laws in Stryn (2026)
While Stryn, Vestland, Norway currently shows low STR regulations, specific Airbnb license requirements might still exist or change. Always verify the latest short term rental regulations and Airbnb license requirements directly with local government authorities for Stryn to ensure full compliance before hosting.
(Source: AirROI data, 2026, finding no licensed listings among those analyzed)
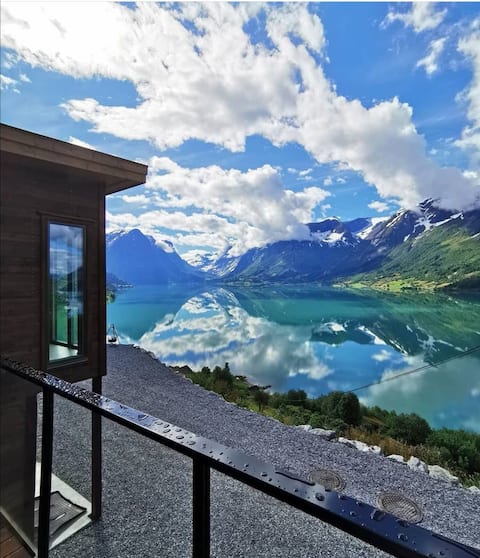
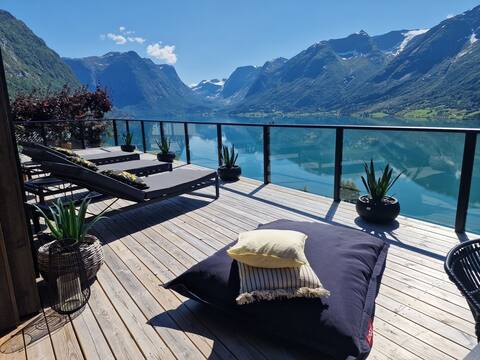
Top Performing Airbnb Properties in Stryn (2026)
Benchmark your potential! Explore examples of top-performing Airbnb properties in Strynbased on Trailing Twelve Month (TTM) revenue. Analyze their characteristics, revenue, occupancy rate, and ADR to understand what drives success in this market.

Villaopheim
Entire Place • 5 bedrooms
Flopanorama
Entire Place • 5 bedrooms
Jølet- Elvedrømmen
Entire Place • 1 bedroom

Great architect-designed holiday home
Entire Place • 6 bedrooms
Perstunet
Entire Place • 6 bedrooms
Flo Bellevue Villa with fantastic unique views!
Entire Place • 6 bedrooms
Note: Performance varies based on location, size, amenities, seasonality, and management quality. Data reflects the past 12 months.
Top Performing Airbnb Hosts in Stryn (2026)
Learn from the best! This table showcases top-performing Airbnb hosts in Stryn based on the number of properties managed and estimated total revenue over the past year. Analyze their scale and performance metrics.
| Host Name | Properties | Grossing Revenue | Stay Reviews | Avg Rating |
|---|---|---|---|---|
| Silje | 5 | $213,633 | 347 | 4.75/5.0 |
| Silje Opheim | 1 | $146,840 | 18 | 5.00/5.0 |
| Ole Christian | 1 | $144,212 | 22 | 4.77/5.0 |
| Cecilie | 4 | $141,764 | 60 | 4.97/5.0 |
| Anita | 5 | $104,235 | 161 | 4.87/5.0 |
| Torill | 1 | $98,248 | 133 | 5.00/5.0 |
| Ketil Finsås | 5 | $89,165 | 307 | 4.74/5.0 |
| Nina | 1 | $87,203 | 47 | 4.94/5.0 |
| Per Lorentz | 1 | $86,546 | 29 | 4.97/5.0 |
| Monica | 1 | $85,775 | 31 | 5.00/5.0 |
Analyzing the strategies of top hosts, such as their property selection, pricing, and guest communication, can offer valuable lessons for optimizing your own Airbnb operations in Stryn.
Dive Deeper: Advanced Stryn STR Market Data (2026)
Ready to unlock more insights? AirROI provides access to advanced metrics and comprehensive Airbnb data for Stryn. Explore detailed analytics beyond this report to refine your investment strategy, optimize pricing, and maximize your vacation rental profits.
Explore Advanced MetricsStryn Short-Term Rental Market Composition (2026): Property & Room Types
Room Type Distribution
Property Type Distribution
Market Composition Insights for Stryn
- The Stryn Airbnb market composition is heavily skewed towards Entire Home/Apt listings, which make up 97.6% of the 245 active rentals. This indicates strong guest preference for privacy and space.
- Looking at the property type distribution in Stryn, Outdoor/Unique properties are the most common (46.9%), reflecting the local real estate landscape.
- Houses represent a significant 28.6% portion, catering likely to families or larger groups.
- Smaller segments like hotel/boutique, others, unique stays (combined 4.0%) offer potential for unique stay experiences.
Stryn Airbnb Room Capacity Analysis (2026): Bedroom Distribution
Distribution of Listings by Number of Bedrooms
Room Capacity Insights for Stryn
- The dominant room capacity in Stryn is 2 bedrooms listings, making up 24.9% of the market. This suggests a strong demand for properties suitable for couples or solo travelers.
- Together, 2 bedrooms and 3 bedrooms properties represent 47.8% of the active Airbnb listings in Stryn, indicating a high concentration in these sizes.
- A significant 56.4% of listings offer 3+ bedrooms, catering to larger groups and families seeking more space in Stryn.
Stryn Vacation Rental Guest Capacity Trends (2026)
Distribution of Listings by Guest Capacity
Guest Capacity Insights for Stryn
- The most common guest capacity trend in Stryn vacation rentals is listings accommodating 8+ guests (35.9%). This suggests the primary traveler segment is likely larger groups.
- Properties designed for 8+ guests and 6 guests dominate the Stryn STR market, accounting for 56.3% of listings.
- 59.6% of properties accommodate 6+ guests, serving the market segment for larger families or group travel in Stryn.
- On average, properties in Stryn are equipped to host 5.7 guests.
Stryn Airbnb Booking Patterns (2026): Available vs. Booked Days
Available Days Distribution
Booked Days Distribution
Booking Pattern Insights for Stryn
- The most common availability pattern in Stryn falls within the 271-366 days range, representing 49.4% of listings. This suggests many properties have significant open periods on their calendars.
- Approximately 94.3% of listings show high availability (181+ days open annually), indicating potential for increased bookings or specific owner usage patterns.
- For booked days, the 91-180 days range is most frequent in Stryn (46.9%), reflecting common guest stay durations or potential owner blocking patterns.
- A notable 5.7% of properties secure long booking periods (181+ days booked per year), highlighting successful long-term rental strategies or significant owner usage.
Stryn Airbnb Minimum Stay Requirements Analysis
Distribution of Listings by Minimum Night Requirement
1 Night
46 listings
18.8% of total
2 Nights
49 listings
20% of total
3 Nights
23 listings
9.4% of total
4-6 Nights
25 listings
10.2% of total
30+ Nights
102 listings
41.6% of total
Key Insights
- The most prevalent minimum stay requirement in Stryn is 30+ Nights, adopted by 41.6% of listings. This highlights the market's preference for longer commitments.
- A significant segment (41.6%) caters to monthly stays (30+ nights) in Stryn, pointing to opportunities in the extended-stay market.
Recommendations
- Align with the market by considering a 30+ Nights minimum stay, as 41.6% of Stryn hosts use this setting.
- If feasible, allowing 1-night stays, especially midweek or during low season, could capture last-minute bookings, as only 18.8% currently do.
- Explore offering discounts for stays of 30+ nights to attract the 41.6% of the market seeking extended stays.
- Adjust minimum nights based on seasonality – potentially shorter during low season and longer during peak demand periods in Stryn.
Stryn Airbnb Cancellation Policy Trends Analysis (2026)
Super Strict 60 Days
8 listings
3.3% of total
Flexible
75 listings
30.6% of total
Moderate
68 listings
27.8% of total
Firm
74 listings
30.2% of total
Strict
20 listings
8.2% of total
Cancellation Policy Insights for Stryn
- The prevailing Airbnb cancellation policy trend in Stryn is Flexible, used by 30.6% of listings.
- There's a relatively balanced mix between guest-friendly (58.4%) and stricter (38.4%) policies, offering choices for different guest needs.
- Strict cancellation policies are quite rare (8.2%), potentially making listings with this policy less competitive unless justified by high demand or property type.
Recommendations for Hosts
- Consider adopting a Flexible policy to align with the 30.6% market standard in Stryn.
- Using a Strict policy might deter some guests, as only 8.2% of listings use it. Evaluate if potential revenue protection outweighs possible lower booking rates.
- Regularly review your cancellation policy against competitors and market demand shifts in Stryn.
Stryn STR Booking Lead Time Analysis (2026)
Average Booking Lead Time by Month
Booking Lead Time Insights for Stryn
- The overall average booking lead time for vacation rentals in Stryn is 66 days.
- Guests book furthest in advance for stays during July (average 86 days), likely coinciding with peak travel demand or local events.
- The shortest booking windows occur for stays in January (average 19 days), indicating more last-minute travel plans during this time.
- Seasonally, Summer (79 days avg.) sees the longest lead times, while Winter (48 days avg.) has the shortest, reflecting typical travel planning cycles.
Recommendations for Hosts
- Use the overall average lead time (66 days) as a baseline for your pricing and availability strategy in Stryn.
- For July stays, consider implementing length-of-stay discounts or slightly higher rates for bookings made less than 86 days out to capitalize on advance planning.
- Target marketing efforts for the Summer season well in advance (at least 79 days) to capture early planners.
- Monitor your own booking lead times against these Stryn averages to identify opportunities for dynamic pricing adjustments.
Popular & Essential Airbnb Amenities in Stryn (2026)
Amenity Prevalence
Amenity Insights for Stryn
- Essential amenities in Stryn that guests expect include: Kitchen, Smoke alarm, Free parking on premises. Lacking these (any) could significantly impact bookings.
- Popular amenities like Heating, Fire extinguisher, Refrigerator are common but not universal. Offering these can provide a competitive edge.
- Warning: Wifi is not universally provided but is considered essential globally. Ensure reliable Wifi is offered.
Recommendations for Hosts
- Ensure your listing includes all essential amenities for Stryn: Kitchen, Smoke alarm, Free parking on premises.
- Prioritize adding missing essentials: Kitchen, Smoke alarm, Free parking on premises.
- Consider adding popular differentiators like Heating or Fire extinguisher to increase appeal.
- Highlight unique or less common amenities you offer (e.g., hot tub, dedicated workspace, EV charger) in your listing description and photos.
- Regularly check competitor amenities in Stryn to stay competitive.
Stryn Airbnb Guest Demographics & Profile Analysis (2026)
Guest Profile Summary for Stryn
- The typical guest profile for Airbnb in Stryn consists of predominantly international visitors (89%), with top international origins including Norway, typically belonging to the Post-2000s (Gen Z/Alpha) group (50%), primarily speaking English or German.
- Domestic travelers account for 10.8% of guests.
- Key international markets include United States (25.1%) and Norway (10.8%).
- Top languages spoken are English (46%) followed by German (8.5%).
- A significant demographic segment is the Post-2000s (Gen Z/Alpha) group, representing 50% of guests.
Recommendations for Hosts
- Focus marketing internationally, particularly towards travelers from Norway.
- Tailor amenities and listing descriptions to appeal to the dominant Post-2000s (Gen Z/Alpha) demographic (e.g., highlight fast WiFi, smart home features, local guides).
- Highlight unique local experiences or amenities relevant to the primary guest profile.
- Consider seasonal promotions aligned with peak travel times for key origin markets.
Nearby Short-Term Rental Market Comparison
How does the Stryn Airbnb market stack up against its neighbors? Compare key performance metrics like average monthly revenue, ADR, and occupancy rates in surrounding areas to understand the broader regional STR landscape.
| Market | Active Properties | Monthly Revenue | Daily Rate | Avg. Occupancy |
|---|---|---|---|---|
| Aurlandsvangen | 21 | $4,260 | $271.74 | 63% |
| Flåm | 20 | $3,930 | $285.20 | 62% |
| Geiranger | 10 | $3,578 | $480.50 | 46% |
| Undredal | 10 | $2,919 | $237.80 | 58% |
| Aurland | 21 | $2,767 | $278.22 | 55% |
| Valldal | 15 | $2,491 | $314.00 | 44% |
| Odda | 66 | $2,122 | $199.85 | 53% |
| Loen | 12 | $2,092 | $199.93 | 48% |
| Sæbø | 17 | $2,074 | $179.10 | 49% |
| Bergenhus | 128 | $1,958 | $248.18 | 50% |