Balestrand Airbnb Market Analysis 2026: Short Term Rental Data & Vacation Rental Statistics in Vestland, Norway
Is Airbnb profitable in Balestrand in 2026? Explore comprehensive Airbnb analytics for Balestrand, Vestland, Norway to uncover income potential. This 2026 STR market report for Balestrand, based on AirROI data from February 2025 to January 2026, reveals key trends in the niche market of 24 active listings.
Whether you're considering an Airbnb investment in Balestrand, optimizing your existing vacation rental, or exploring rental arbitrage opportunities, understanding the Balestrand Airbnb data is crucial. Leveraging the low regulation environment is key to maximizing your short term rental income potential. Let's dive into the specifics.
Key Balestrand Airbnb Performance Metrics Overview
Monthly Airbnb Revenue Variations & Income Potential in Balestrand (2026)
Understanding the monthly revenue variations for Airbnb listings in Balestrand is key to maximizing your short term rental income potential. Seasonality significantly impacts earnings. Our analysis, based on data from the past 12 months, shows that the peak revenue month for STRs in Balestrand is typically July, while January often presents the lowest earnings, highlighting opportunities for strategic pricing adjustments during shoulder and low seasons. Explore the typical Airbnb income in Balestrand across different performance tiers:
- Best-in-class properties (Top 10%) achieve $4,814+ monthly, often utilizing dynamic pricing and superior guest experiences.
- Strong performing properties (Top 25%) earn $3,035 or more, indicating effective management and desirable locations/amenities.
- Typical properties (Median) generate around $1,806 per month, representing the average market performance.
- Entry-level properties (Bottom 25%) see earnings around $1,273, often with potential for optimization.
Average Monthly Airbnb Earnings Trend in Balestrand
Balestrand Airbnb Occupancy Rate Trends (2026)
Maximize your bookings by understanding the Balestrand STR occupancy trends. Seasonal demand shifts significantly influence how often properties are booked. Typically, Augustsees the highest demand (peak season occupancy), while January experiences the lowest (low season). Effective strategies, like adjusting minimum stays or offering promotions, can boost occupancy during slower periods. Here's how different property tiers perform in Balestrand:
- Best-in-class properties (Top 10%) achieve 70%+ occupancy, indicating high desirability and potentially optimized availability.
- Strong performing properties (Top 25%) maintain 62% or higher occupancy, suggesting good market fit and guest satisfaction.
- Typical properties (Median) have an occupancy rate around 43%.
- Entry-level properties (Bottom 25%) average 27% occupancy, potentially facing higher vacancy.
Average Monthly Occupancy Rate Trend in Balestrand
Average Daily Rate (ADR) Airbnb Trends in Balestrand (2026)
Effective short term rental pricing strategy in Balestrand involves understanding monthly ADR fluctuations. The Average Daily Rate (ADR) for Airbnb in Balestrand typically peaks in August and dips lowest during March. Leveraging Airbnb dynamic pricing tools or strategies based on this seasonality can significantly boost revenue. Here's a look at the typical nightly rates achieved:
- Best-in-class properties (Top 10%) command rates of $264+ per night, often due to premium features or locations.
- Strong performing properties (Top 25%) achieve nightly rates of $195 or more.
- Typical properties (Median) charge around $150 per night.
- Entry-level properties (Bottom 25%) earn around $111 per night.
Average Daily Rate (ADR) Trend by Month in Balestrand
Get Live Balestrand Market Intelligence 👇

Explore Real-time Analytics
Airbnb Seasonality Analysis & Trends in Balestrand (2026)
Peak Season (July, August, June)
- Revenue averages $4,281 per month
- Occupancy rates average 72.3%
- Daily rates average $174
Shoulder Season
- Revenue averages $2,196 per month
- Occupancy maintains around 41.2%
- Daily rates hold near $162
Low Season (January, February, November)
- Revenue drops to average $868 per month
- Occupancy decreases to average 22.0%
- Daily rates adjust to average $163
Seasonality Insights for Balestrand
- The Airbnb seasonality in Balestrand shows highly seasonal trends requiring careful strategy. While the sections above show seasonal averages, it's also insightful to look at the extremes:
- During the high season, the absolute peak month showcases Balestrand's highest earning potential, with monthly revenues capable of climbing to $4,592, occupancy reaching a high of 76.7%, and ADRs peaking at $178.
- Conversely, the slowest single month of the year, typically falling within the low season, marks the market's lowest point. In this month, revenue might dip to $726, occupancy could drop to 15.3%, and ADRs may adjust down to $146.
- Understanding both the seasonal averages and these monthly peaks and troughs in revenue, occupancy, and ADR is crucial for maximizing your Airbnb profit potential in Balestrand.
Seasonal Strategies for Maximizing Profit
- Peak Season: Maximize revenue through premium pricing and potentially longer minimum stays. Ensure high availability.
- Low Season: Offer competitive pricing, special promotions (e.g., extended stay discounts), and flexible cancellation policies. Target off-season travelers like remote workers or budget-conscious guests.
- Shoulder Seasons: Implement dynamic pricing that balances peak and low rates. Target weekend travelers or specific events. Offer slightly more flexible terms than peak season.
- Regularly analyze your own performance against these Balestrand seasonality benchmarks and adjust your pricing and availability strategy accordingly.
Best Areas for Airbnb Investment in Balestrand (2026)
Exploring the top neighborhoods for short-term rentals in Balestrand? This section highlights key areas, outlining why they are attractive for hosts and guests, along with notable local attractions. Consider these locations based on your target guest profile and investment strategy.
| Neighborhood / Area | Why Host Here? (Target Guests & Appeal) | Key Attractions & Landmarks |
|---|---|---|
| Balestrand Waterfront | The picturesque waterfront of Balestrand is a prime spot for tourists wanting direct access to the fjord. Its stunning views and proximity to boating activities make it ideal for vacationers. | Balestrand Fjord, Skjolden, Sognefjord, Kviknes Hotel, Balestrand Church |
| Kinsarvik | A charming village that offers a blend of scenic beauty and hiking opportunities. It attracts nature lovers and adventure seekers alike with its rich outdoor activities. | Bakkegardane Hiking Trail, Myrkdalen Mountain Resort, Hardangerfjord, Kinsarvik Church |
| Sognefjord | The largest fjord in Norway is a major tourist attraction, rich in cultural heritage and natural beauty. Ideal for eco-tourism and outdoor experiences. | Sognefjellet National Park, Fjærland Fjord, Nigardsbreen Glacier, Bøyabreen Glacier |
| Vangsnes | Vangsnes is known for its historical significance and stunning views across the Sognefjord, making it a perfect spot for visitors looking for tranquility and scenic beauty. | Sognefjord Viewpoint, Wikingersfjellet, Vangsnes Church |
| Fjærland | This quaint village is famous for its booksellers and beautiful landscapes. It’s a peaceful getaway known for its rich literary culture and outdoor recreation. | Norwegian Book Town, Fjærland Fjord, Lake Gjølme |
| Gaupne | Situated at the mouth of the Sognefjord, Gaupne offers attractive hiking routes and cultural sites. It is an emerging location for those seeking adventure in nature. | National Park Centre, Gaupne Church, Hiking to Molden and Mannhaug |
| Lustrabotn | A small, scenic village that serves as a gateway to nearby hiking and skiing areas. It's perfect for those looking for a secluded and serene environment. | Nearby fjord access, Luster Fjord, Hiking trails |
| Vik | A charming village featuring stunning views of the fjord and a rich Viking history. It's perfect for travelers interested in both culture and nature. | Vik Stave Church, The Viking Valley, Hiking around Vik |
Understanding Airbnb License Requirements & STR Laws in Balestrand (2026)
While Balestrand, Vestland, Norway currently shows low STR regulations, specific Airbnb license requirements might still exist or change. Always verify the latest short term rental regulations and Airbnb license requirements directly with local government authorities for Balestrand to ensure full compliance before hosting.
(Source: AirROI data, 2026, finding no licensed listings among those analyzed)
Top Performing Airbnb Properties in Balestrand (2026)
Benchmark your potential! Explore examples of top-performing Airbnb properties in Balestrandbased on Trailing Twelve Month (TTM) revenue. Analyze their characteristics, revenue, occupancy rate, and ADR to understand what drives success in this market.

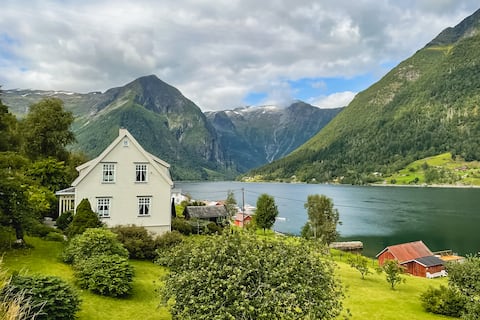
Modern house with spectacular view of Sognefjorden
Entire Place • 4 bedrooms
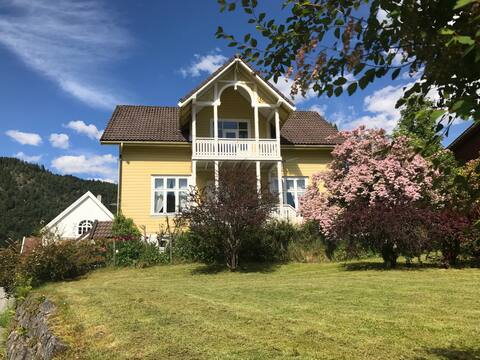
House with private lakefront & jetty in the middle of Balestrand
Entire Place • 4 bedrooms
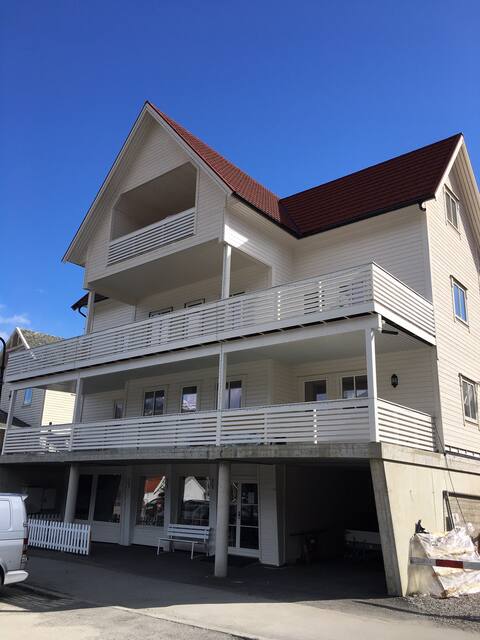
Balestrand Fjordapartments, Holmen 19B
Entire Place • 4 bedrooms
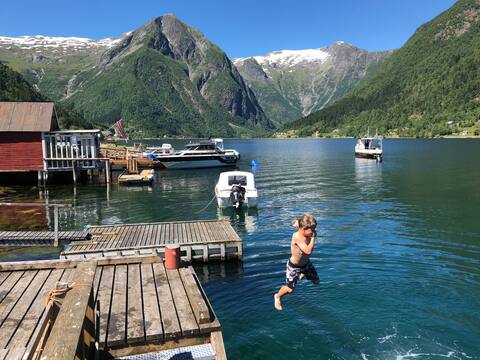
Holiday home with its own jetty and fjord access
Entire Place • 4 bedrooms
Villa Holmen
Entire Place • 5 bedrooms

Kaivegen 2
Entire Place • 3 bedrooms
Note: Performance varies based on location, size, amenities, seasonality, and management quality. Data reflects the past 12 months.
Top Performing Airbnb Hosts in Balestrand (2026)
Learn from the best! This table showcases top-performing Airbnb hosts in Balestrand based on the number of properties managed and estimated total revenue over the past year. Analyze their scale and performance metrics.
| Host Name | Properties | Grossing Revenue | Stay Reviews | Avg Rating |
|---|---|---|---|---|
| Bente Johanne | 4 | $102,050 | 356 | 4.82/5.0 |
| Kenneth | 5 | $69,269 | 693 | 4.74/5.0 |
| Sverre | 1 | $65,221 | 76 | 4.97/5.0 |
| Siv | 2 | $57,769 | 392 | 4.96/5.0 |
| Olafur | 1 | $39,431 | 19 | 5.00/5.0 |
| Eirik | 1 | $35,166 | 34 | 4.79/5.0 |
| Guna | 1 | $32,162 | 204 | 4.90/5.0 |
| Brigitte | 1 | $23,514 | 13 | 4.69/5.0 |
| Ole | 1 | $23,331 | 264 | 4.92/5.0 |
| Nadine - Interhome | 1 | $18,974 | 1 | Not Rated |
Analyzing the strategies of top hosts, such as their property selection, pricing, and guest communication, can offer valuable lessons for optimizing your own Airbnb operations in Balestrand.
Dive Deeper: Advanced Balestrand STR Market Data (2026)
Ready to unlock more insights? AirROI provides access to advanced metrics and comprehensive Airbnb data for Balestrand. Explore detailed analytics beyond this report to refine your investment strategy, optimize pricing, and maximize your vacation rental profits.
Explore Advanced MetricsBalestrand Short-Term Rental Market Composition (2026): Property & Room Types
Room Type Distribution
Property Type Distribution
Market Composition Insights for Balestrand
- The Balestrand Airbnb market composition is heavily skewed towards Entire Home/Apt listings, which make up 100% of the 24 active rentals. This indicates strong guest preference for privacy and space.
- Looking at the property type distribution in Balestrand, House properties are the most common (50%), reflecting the local real estate landscape.
- Houses represent a significant 50% portion, catering likely to families or larger groups.
- Smaller segments like outdoor/unique (combined 4.2%) offer potential for unique stay experiences.
Balestrand Airbnb Room Capacity Analysis (2026): Bedroom Distribution
Distribution of Listings by Number of Bedrooms
Room Capacity Insights for Balestrand
- The dominant room capacity in Balestrand is 1 bedroom listings, making up 20.8% of the market. This suggests a strong demand for properties suitable for couples or solo travelers.
- Together, 1 bedroom and 4 bedrooms properties represent 41.6% of the active Airbnb listings in Balestrand, indicating a high concentration in these sizes.
- A significant 45.8% of listings offer 3+ bedrooms, catering to larger groups and families seeking more space in Balestrand.
Balestrand Vacation Rental Guest Capacity Trends (2026)
Distribution of Listings by Guest Capacity
Guest Capacity Insights for Balestrand
- The most common guest capacity trend in Balestrand vacation rentals is listings accommodating 6 guests (25%). This suggests the primary traveler segment is likely larger groups.
- Properties designed for 6 guests and 4 guests dominate the Balestrand STR market, accounting for 50.0% of listings.
- 50.0% of properties accommodate 6+ guests, serving the market segment for larger families or group travel in Balestrand.
- On average, properties in Balestrand are equipped to host 5.1 guests.
Balestrand Airbnb Booking Patterns (2026): Available vs. Booked Days
Available Days Distribution
Booked Days Distribution
Booking Pattern Insights for Balestrand
- The most common availability pattern in Balestrand falls within the 181-270 days range, representing 58.3% of listings. This suggests many properties have significant open periods on their calendars.
- Approximately 91.6% of listings show high availability (181+ days open annually), indicating potential for increased bookings or specific owner usage patterns.
- For booked days, the 91-180 days range is most frequent in Balestrand (50%), reflecting common guest stay durations or potential owner blocking patterns.
- A notable 20.8% of properties secure long booking periods (181+ days booked per year), highlighting successful long-term rental strategies or significant owner usage.
Balestrand Airbnb Minimum Stay Requirements Analysis
Distribution of Listings by Minimum Night Requirement
1 Night
15 listings
62.5% of total
2 Nights
1 listings
4.2% of total
4-6 Nights
2 listings
8.3% of total
30+ Nights
6 listings
25% of total
Key Insights
- The most prevalent minimum stay requirement in Balestrand is 1 Night, adopted by 62.5% of listings. This highlights the market's preference for shorter, flexible bookings.
- A strong majority (66.7%) of the Balestrand Airbnb data shows acceptance of very short stays (1-2 nights), indicating a dynamic, high-turnover market.
- A significant segment (25%) caters to monthly stays (30+ nights) in Balestrand, pointing to opportunities in the extended-stay market.
Recommendations
- Align with the market by considering a 1 Night minimum stay, as 62.5% of Balestrand hosts use this setting.
- Explore offering discounts for stays of 30+ nights to attract the 25% of the market seeking extended stays.
- Adjust minimum nights based on seasonality – potentially shorter during low season and longer during peak demand periods in Balestrand.
Balestrand Airbnb Cancellation Policy Trends Analysis (2026)
Flexible
4 listings
16.7% of total
Moderate
9 listings
37.5% of total
Firm
10 listings
41.7% of total
Strict
1 listings
4.2% of total
Cancellation Policy Insights for Balestrand
- The prevailing Airbnb cancellation policy trend in Balestrand is Firm, used by 41.7% of listings.
- There's a relatively balanced mix between guest-friendly (54.2%) and stricter (45.9%) policies, offering choices for different guest needs.
- Strict cancellation policies are quite rare (4.2%), potentially making listings with this policy less competitive unless justified by high demand or property type.
Recommendations for Hosts
- Consider adopting a Firm policy to align with the 41.7% market standard in Balestrand.
- Using a Strict policy might deter some guests, as only 4.2% of listings use it. Evaluate if potential revenue protection outweighs possible lower booking rates.
- Regularly review your cancellation policy against competitors and market demand shifts in Balestrand.
Balestrand STR Booking Lead Time Analysis (2026)
Average Booking Lead Time by Month
Booking Lead Time Insights for Balestrand
- The overall average booking lead time for vacation rentals in Balestrand is 117 days.
- Guests book furthest in advance for stays during May (average 154 days), likely coinciding with peak travel demand or local events.
- The shortest booking windows occur for stays in November (average 52 days), indicating more last-minute travel plans during this time.
- Seasonally, Summer (131 days avg.) sees the longest lead times, while Fall (67 days avg.) has the shortest, reflecting typical travel planning cycles.
Recommendations for Hosts
- Use the overall average lead time (117 days) as a baseline for your pricing and availability strategy in Balestrand.
- For May stays, consider implementing length-of-stay discounts or slightly higher rates for bookings made less than 154 days out to capitalize on advance planning.
- Target marketing efforts for the Summer season well in advance (at least 131 days) to capture early planners.
- Monitor your own booking lead times against these Balestrand averages to identify opportunities for dynamic pricing adjustments.
Popular & Essential Airbnb Amenities in Balestrand (2026)
Amenity Prevalence
Amenity Insights for Balestrand
- Essential amenities in Balestrand that guests expect include: Kitchen, Hot water, Heating, Refrigerator, Cooking basics, Dishes and silverware, Wifi. Lacking these (any) could significantly impact bookings.
- Popular amenities like Fire extinguisher, Washer, Stove are common but not universal. Offering these can provide a competitive edge.
Recommendations for Hosts
- Ensure your listing includes all essential amenities for Balestrand: Kitchen, Hot water, Heating, Refrigerator, Cooking basics, Dishes and silverware, Wifi.
- Prioritize adding missing essentials: Hot water, Heating, Refrigerator, Cooking basics, Dishes and silverware, Wifi.
- Consider adding popular differentiators like Fire extinguisher or Washer to increase appeal.
- Highlight unique or less common amenities you offer (e.g., hot tub, dedicated workspace, EV charger) in your listing description and photos.
- Regularly check competitor amenities in Balestrand to stay competitive.
Balestrand Airbnb Guest Demographics & Profile Analysis (2026)
Guest Profile Summary for Balestrand
- The typical guest profile for Airbnb in Balestrand consists of predominantly international visitors (92%), with top international origins including Norway, typically belonging to the Post-2000s (Gen Z/Alpha) group (50%), primarily speaking English or German.
- Domestic travelers account for 7.8% of guests.
- Key international markets include United States (47.1%) and Norway (7.8%).
- Top languages spoken are English (48.3%) followed by German (7.9%).
- A significant demographic segment is the Post-2000s (Gen Z/Alpha) group, representing 50% of guests.
Recommendations for Hosts
- Focus marketing internationally, particularly towards travelers from Norway.
- Tailor amenities and listing descriptions to appeal to the dominant Post-2000s (Gen Z/Alpha) demographic (e.g., highlight fast WiFi, smart home features, local guides).
- Highlight unique local experiences or amenities relevant to the primary guest profile.
- Consider seasonal promotions aligned with peak travel times for key origin markets.
Nearby Short-Term Rental Market Comparison
How does the Balestrand Airbnb market stack up against its neighbors? Compare key performance metrics like average monthly revenue, ADR, and occupancy rates in surrounding areas to understand the broader regional STR landscape.
| Market | Active Properties | Monthly Revenue | Daily Rate | Avg. Occupancy |
|---|---|---|---|---|
| Aurlandsvangen | 21 | $4,260 | $271.74 | 63% |
| Flåm | 20 | $3,930 | $285.20 | 62% |
| Geiranger | 10 | $3,578 | $480.50 | 46% |
| Undredal | 10 | $2,919 | $237.80 | 58% |
| Aurland | 21 | $2,767 | $278.22 | 55% |
| Valldal | 15 | $2,491 | $314.00 | 44% |
| Odda | 66 | $2,122 | $199.85 | 53% |
| Loen | 12 | $2,092 | $199.93 | 48% |
| Sæbø | 17 | $2,074 | $179.10 | 49% |
| Stryn | 245 | $2,013 | $278.46 | 43% |