Rivas (Municipio) Airbnb Market Analysis 2025: Short Term Rental Data & Vacation Rental Statistics in Rivas, Nicaragua
Is Airbnb profitable in Rivas (Municipio) in 2025? Explore comprehensive Airbnb analytics for Rivas (Municipio), Rivas, Nicaragua to uncover income potential. This 2025 STR market report for Rivas (Municipio), based on AirROI data from November 2024 to October 2025, reveals key trends in the niche market of 19 active listings.
Whether you're considering an Airbnb investment in Rivas (Municipio), optimizing your existing vacation rental, or exploring rental arbitrage opportunities, understanding the Rivas (Municipio) Airbnb data is crucial. Leveraging the low regulation environment is key to maximizing your short term rental income potential. Let's dive into the specifics.
Key Rivas (Municipio) Airbnb Performance Metrics Overview
Monthly Airbnb Revenue Variations & Income Potential in Rivas (Municipio) (2025)
Understanding the monthly revenue variations for Airbnb listings in Rivas (Municipio) is key to maximizing your short term rental income potential. Seasonality significantly impacts earnings. Our analysis, based on data from the past 12 months, shows that the peak revenue month for STRs in Rivas (Municipio) is typically December, while October often presents the lowest earnings, highlighting opportunities for strategic pricing adjustments during shoulder and low seasons. Explore the typical Airbnb income in Rivas (Municipio) across different performance tiers:
- Best-in-class properties (Top 10%) achieve $916+ monthly, often utilizing dynamic pricing and superior guest experiences.
- Strong performing properties (Top 25%) earn $552 or more, indicating effective management and desirable locations/amenities.
- Typical properties (Median) generate around $173 per month, representing the average market performance.
- Entry-level properties (Bottom 25%) see earnings around $57, often with potential for optimization.
Average Monthly Airbnb Earnings Trend in Rivas (Municipio)
Rivas (Municipio) Airbnb Occupancy Rate Trends (2025)
Maximize your bookings by understanding the Rivas (Municipio) STR occupancy trends. Seasonal demand shifts significantly influence how often properties are booked. Typically, Decembersees the highest demand (peak season occupancy), while October experiences the lowest (low season). Effective strategies, like adjusting minimum stays or offering promotions, can boost occupancy during slower periods. Here's how different property tiers perform in Rivas (Municipio):
- Best-in-class properties (Top 10%) achieve 53%+ occupancy, indicating high desirability and potentially optimized availability.
- Strong performing properties (Top 25%) maintain 29% or higher occupancy, suggesting good market fit and guest satisfaction.
- Typical properties (Median) have an occupancy rate around 12%.
- Entry-level properties (Bottom 25%) average 7% occupancy, potentially facing higher vacancy.
Average Monthly Occupancy Rate Trend in Rivas (Municipio)
Average Daily Rate (ADR) Airbnb Trends in Rivas (Municipio) (2025)
Effective short term rental pricing strategy in Rivas (Municipio) involves understanding monthly ADR fluctuations. The Average Daily Rate (ADR) for Airbnb in Rivas (Municipio) typically peaks in May and dips lowest during November. Leveraging Airbnb dynamic pricing tools or strategies based on this seasonality can significantly boost revenue. Here's a look at the typical nightly rates achieved:
- Best-in-class properties (Top 10%) command rates of $125+ per night, often due to premium features or locations.
- Strong performing properties (Top 25%) achieve nightly rates of $99 or more.
- Typical properties (Median) charge around $47 per night.
- Entry-level properties (Bottom 25%) earn around $19 per night.
Average Daily Rate (ADR) Trend by Month in Rivas (Municipio)
Get Live Rivas (Municipio) Market Intelligence 👇
.png)
Explore Real-time Analytics
Airbnb Seasonality Analysis & Trends in Rivas (Municipio) (2025)
Peak Season (December, May, January)
- Revenue averages $588 per month
- Occupancy rates average 33.1%
- Daily rates average $59
Shoulder Season
- Revenue averages $348 per month
- Occupancy maintains around 19.3%
- Daily rates hold near $58
Low Season (June, September, October)
- Revenue drops to average $126 per month
- Occupancy decreases to average 14.1%
- Daily rates adjust to average $60
Seasonality Insights for Rivas (Municipio)
- The Airbnb seasonality in Rivas (Municipio) shows highly seasonal trends requiring careful strategy. While the sections above show seasonal averages, it's also insightful to look at the extremes:
- During the high season, the absolute peak month showcases Rivas (Municipio)'s highest earning potential, with monthly revenues capable of climbing to $625, occupancy reaching a high of 36.8%, and ADRs peaking at $63.
- Conversely, the slowest single month of the year, typically falling within the low season, marks the market's lowest point. In this month, revenue might dip to $82, occupancy could drop to 4.3%, and ADRs may adjust down to $56.
- Understanding both the seasonal averages and these monthly peaks and troughs in revenue, occupancy, and ADR is crucial for maximizing your Airbnb profit potential in Rivas (Municipio).
Seasonal Strategies for Maximizing Profit
- Peak Season: Maximize revenue through premium pricing and potentially longer minimum stays. Ensure high availability.
- Low Season: Offer competitive pricing, special promotions (e.g., extended stay discounts), and flexible cancellation policies. Target off-season travelers like remote workers or budget-conscious guests.
- Shoulder Seasons: Implement dynamic pricing that balances peak and low rates. Target weekend travelers or specific events. Offer slightly more flexible terms than peak season.
- Regularly analyze your own performance against these Rivas (Municipio) seasonality benchmarks and adjust your pricing and availability strategy accordingly.
Best Areas for Airbnb Investment in Rivas (Municipio) (2025)
Exploring the top neighborhoods for short-term rentals in Rivas (Municipio)? This section highlights key areas, outlining why they are attractive for hosts and guests, along with notable local attractions. Consider these locations based on your target guest profile and investment strategy.
| Neighborhood / Area | Why Host Here? (Target Guests & Appeal) | Key Attractions & Landmarks |
|---|---|---|
| San Juan del Sur | Popular beach town known for surfing, vibrant nightlife, and a laid-back atmosphere. Ideal for tourists looking for a beach escape and adventure activities. | Maderas Beach, Playa Hermosa, Nicaragua Surf School, San Juan del Sur Beach, The Mirador del Cristo de la Misericordia |
| Rivas Market | Central hub for local shopping and dining, attracting both locals and tourists. Great area for visitors wanting to experience local culture and cuisine. | Rivas Central Market, Local Restaurants, Cultural Events, Souvenir Shops, Artisan Stalls |
| Apoyo Lagoon | Stunning nature reserve with a beautiful crater lake, ideal for eco-tourism and relaxation. Attracts visitors looking for a tranquil nature retreat. | Apoyo Lagoon Natural Reserve, Kayaking, Hiking Trails, Wildlife Watching, Laguna de Apoyo Eco-Lodge |
| Ometepe Island | Unique island formed by two volcanoes, known for its natural beauty and outdoor activities. Perfect for adventurous tourists and nature lovers. | Concepción Volcano, Maderas Volcano, Ometepe Biological Reserve, San Ramón Waterfall, Moyogalpa Town |
| Nandaime | Less touristy area with rich history and potential for cultural experiences. Offers a glimpse into local Nicaraguan life outside of the main tourist hotspots. | Local Churches, Historical Sites, Traditional Markets, Community Festivals, Rural Landscape |
| El Castillo | Historic colonial town known for its scenic views and cultural heritage. Attracts visitors looking for a unique historical experience by the river. | El Castillo Fortress, Rio San Juan, Cultural Heritage Sites, Bird Watching, Fishing Tours |
| San Jorge | Coastal town with ferry access to the islands. A great launching point for island hopping and exploring Lake Nicaragua. | Ferry to Ometepe, Local Beaches, Pioneer Park, Water Sports, Fishing |
| Rivas City Center | The main urban area with access to key amenities and services. Ideal for travelers seeking convenience and a local city experience. | Central Park, Local Cafés, Shopping Areas, Cultural Events, Historical Sites |
Understanding Airbnb License Requirements & STR Laws in Rivas (Municipio) (2025)
While Rivas (Municipio), Rivas, Nicaragua currently shows low STR regulations, specific Airbnb license requirements might still exist or change. Always verify the latest short term rental regulations and Airbnb license requirements directly with local government authorities for Rivas (Municipio) to ensure full compliance before hosting.
(Source: AirROI data, 2025, finding no licensed listings among those analyzed)
Top Performing Airbnb Properties in Rivas (Municipio) (2025)
Benchmark your potential! Explore examples of top-performing Airbnb properties in Rivas (Municipio)based on Trailing Twelve Month (TTM) revenue. Analyze their characteristics, revenue, occupancy rate, and ADR to understand what drives success in this market.

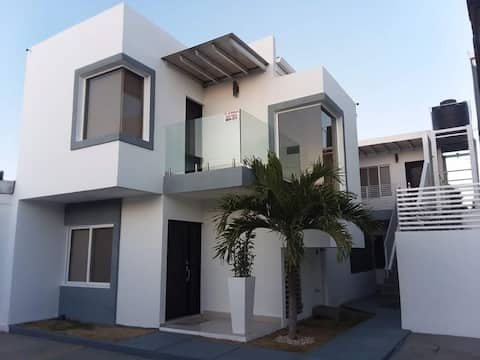
Comfortable apartment with a pool.
Entire Place • 1 bedroom
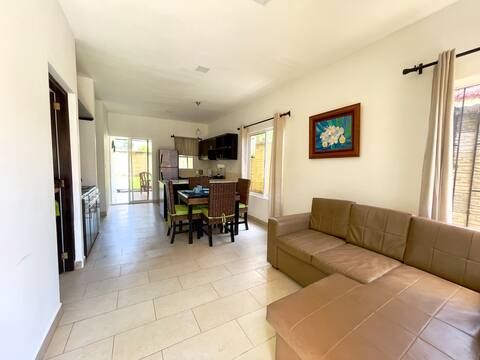
Luxury Apartment I in Rivas
Entire Place • 2 bedrooms
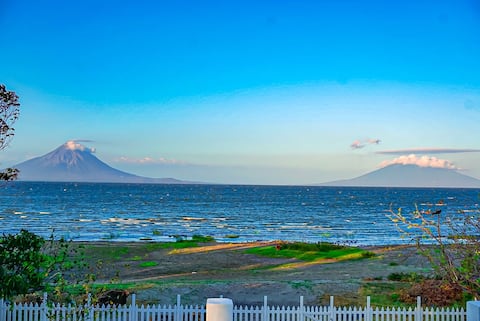
House in front of the lake and overlooking volcanoes
Entire Place • 3 bedrooms
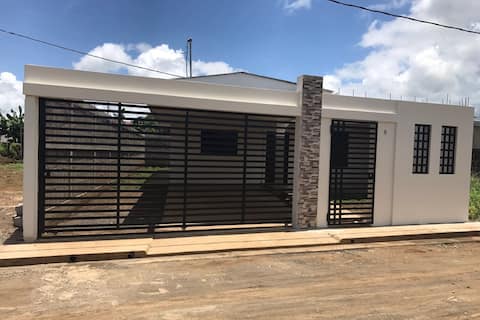
Apartment in Rivas
Entire Place • 2 bedrooms

Private room facing the lake of Nicaragua.
Entire Place • 1 bedroom
Casa Rivas
Entire Place • 3 bedrooms
Note: Performance varies based on location, size, amenities, seasonality, and management quality. Data reflects the past 12 months.
Top Performing Airbnb Hosts in Rivas (Municipio) (2025)
Learn from the best! This table showcases top-performing Airbnb hosts in Rivas (Municipio) based on the number of properties managed and estimated total revenue over the past year. Analyze their scale and performance metrics.
| Host Name | Properties | Grossing Revenue | Stay Reviews | Avg Rating |
|---|---|---|---|---|
| Karla | 2 | $8,937 | 104 | 4.79/5.0 |
| Róger | 2 | $8,472 | 38 | 5.00/5.0 |
| Jorge Humberto | 2 | $8,299 | 31 | 4.70/5.0 |
| Joaquín Ernesto | 1 | $4,948 | 11 | 5.00/5.0 |
| Ana Cecilia | 2 | $4,485 | 58 | 4.71/5.0 |
| Jorge | 1 | $2,904 | 13 | 4.92/5.0 |
| Sheyla Cristina | 1 | $2,785 | 5 | 3.80/5.0 |
| Nicolás Enrique | 1 | $2,118 | 123 | 4.80/5.0 |
| Martha | 4 | $1,588 | 139 | 4.74/5.0 |
| Julieta And Mike | 2 | $1,121 | 68 | 4.57/5.0 |
Analyzing the strategies of top hosts, such as their property selection, pricing, and guest communication, can offer valuable lessons for optimizing your own Airbnb operations in Rivas (Municipio).
Dive Deeper: Advanced Rivas (Municipio) STR Market Data (2025)
Ready to unlock more insights? AirROI provides access to advanced metrics and comprehensive Airbnb data for Rivas (Municipio). Explore detailed analytics beyond this report to refine your investment strategy, optimize pricing, and maximize your vacation rental profits.
Explore Advanced MetricsRivas (Municipio) Short-Term Rental Market Composition (2025): Property & Room Types
Room Type Distribution
Property Type Distribution
Market Composition Insights for Rivas (Municipio)
- The Rivas (Municipio) Airbnb market composition is heavily skewed towards Entire Home/Apt listings, which make up 52.6% of the 19 active rentals. This indicates strong guest preference for privacy and space.
- However, a notable 47.4% share for Private Rooms suggests opportunities for budget-conscious travelers or hosts renting out spare rooms.
- Looking at the property type distribution in Rivas (Municipio), House properties are the most common (42.1%), reflecting the local real estate landscape.
- Houses represent a significant 42.1% portion, catering likely to families or larger groups.
- The presence of 36.8% Hotel/Boutique listings indicates integration with traditional hospitality.
Rivas (Municipio) Airbnb Room Capacity Analysis (2025): Bedroom Distribution
Distribution of Listings by Number of Bedrooms
Room Capacity Insights for Rivas (Municipio)
- The dominant room capacity in Rivas (Municipio) is 1 bedroom listings, making up 31.6% of the market. This suggests a strong demand for properties suitable for couples or solo travelers.
- Together, 1 bedroom and 3 bedrooms properties represent 47.4% of the active Airbnb listings in Rivas (Municipio), indicating a high concentration in these sizes.
- A significant 31.6% of listings offer 3+ bedrooms, catering to larger groups and families seeking more space in Rivas (Municipio).
Rivas (Municipio) Vacation Rental Guest Capacity Trends (2025)
Distribution of Listings by Guest Capacity
Guest Capacity Insights for Rivas (Municipio)
- The most common guest capacity trend in Rivas (Municipio) vacation rentals is listings accommodating 6 guests (15.8%). This suggests the primary traveler segment is likely larger groups.
- Properties designed for 6 guests and 4 guests dominate the Rivas (Municipio) STR market, accounting for 31.6% of listings.
- 26.3% of properties accommodate 6+ guests, serving the market segment for larger families or group travel in Rivas (Municipio).
- On average, properties in Rivas (Municipio) are equipped to host 3.0 guests.
Rivas (Municipio) Airbnb Booking Patterns (2025): Available vs. Booked Days
Available Days Distribution
Booked Days Distribution
Booking Pattern Insights for Rivas (Municipio)
- The most common availability pattern in Rivas (Municipio) falls within the 271-366 days range, representing 84.2% of listings. This suggests many properties have significant open periods on their calendars.
- Approximately 100.0% of listings show high availability (181+ days open annually), indicating potential for increased bookings or specific owner usage patterns.
- For booked days, the 1-30 days range is most frequent in Rivas (Municipio) (47.4%), reflecting common guest stay durations or potential owner blocking patterns.
Rivas (Municipio) Airbnb Minimum Stay Requirements Analysis
Distribution of Listings by Minimum Night Requirement
1 Night
16 listings
84.2% of total
2 Nights
1 listings
5.3% of total
30+ Nights
2 listings
10.5% of total
Key Insights
- The most prevalent minimum stay requirement in Rivas (Municipio) is 1 Night, adopted by 84.2% of listings. This highlights the market's preference for shorter, flexible bookings.
- A strong majority (89.5%) of the Rivas (Municipio) Airbnb data shows acceptance of very short stays (1-2 nights), indicating a dynamic, high-turnover market.
- A significant segment (10.5%) caters to monthly stays (30+ nights) in Rivas (Municipio), pointing to opportunities in the extended-stay market.
Recommendations
- Align with the market by considering a 1 Night minimum stay, as 84.2% of Rivas (Municipio) hosts use this setting.
- Explore offering discounts for stays of 30+ nights to attract the 10.5% of the market seeking extended stays.
- Adjust minimum nights based on seasonality – potentially shorter during low season and longer during peak demand periods in Rivas (Municipio).
Rivas (Municipio) Airbnb Cancellation Policy Trends Analysis (2025)
Flexible
10 listings
52.6% of total
Moderate
3 listings
15.8% of total
Firm
3 listings
15.8% of total
Strict
3 listings
15.8% of total
Cancellation Policy Insights for Rivas (Municipio)
- The prevailing Airbnb cancellation policy trend in Rivas (Municipio) is Flexible, used by 52.6% of listings.
- There's a relatively balanced mix between guest-friendly (68.4%) and stricter (31.6%) policies, offering choices for different guest needs.
Recommendations for Hosts
- Consider adopting a Flexible policy to align with the 52.6% market standard in Rivas (Municipio).
- Given the high prevalence of Flexible policies (52.6%), offering this can enhance booking appeal, especially during shoulder seasons.
- Regularly review your cancellation policy against competitors and market demand shifts in Rivas (Municipio).
Rivas (Municipio) STR Booking Lead Time Analysis (2025)
Average Booking Lead Time by Month
Booking Lead Time Insights for Rivas (Municipio)
- The overall average booking lead time for vacation rentals in Rivas (Municipio) is 24 days.
- Guests book furthest in advance for stays during July (average 47 days), likely coinciding with peak travel demand or local events.
- The shortest booking windows occur for stays in October (average 6 days), indicating more last-minute travel plans during this time.
- Seasonally, Summer (33 days avg.) sees the longest lead times, while Fall (19 days avg.) has the shortest, reflecting typical travel planning cycles.
Recommendations for Hosts
- Use the overall average lead time (24 days) as a baseline for your pricing and availability strategy in Rivas (Municipio).
- For July stays, consider implementing length-of-stay discounts or slightly higher rates for bookings made less than 47 days out to capitalize on advance planning.
- During October, focus on last-minute booking availability and promotions, as guests book with very short notice (6 days avg.).
- Target marketing efforts for the Summer season well in advance (at least 33 days) to capture early planners.
- Monitor your own booking lead times against these Rivas (Municipio) averages to identify opportunities for dynamic pricing adjustments.
Popular & Essential Airbnb Amenities in Rivas (Municipio) (2025)
Amenity Prevalence
Amenity Insights for Rivas (Municipio)
- Essential amenities in Rivas (Municipio) that guests expect include: Wifi. Lacking these (this) could significantly impact bookings.
- Popular amenities like Free parking on premises, TV, Kitchen are common but not universal. Offering these can provide a competitive edge.
Recommendations for Hosts
- Ensure your listing includes all essential amenities for Rivas (Municipio): Wifi.
- Consider adding popular differentiators like Free parking on premises or TV to increase appeal.
- Highlight unique or less common amenities you offer (e.g., hot tub, dedicated workspace, EV charger) in your listing description and photos.
- Regularly check competitor amenities in Rivas (Municipio) to stay competitive.
Rivas (Municipio) Airbnb Guest Demographics & Profile Analysis (2025)
Guest Profile Summary for Rivas (Municipio)
- The typical guest profile for Airbnb in Rivas (Municipio) consists of predominantly international visitors (90%), with top international origins including Canada, typically belonging to the Post-2000s (Gen Z/Alpha) group (50%), primarily speaking English or Spanish.
- Domestic travelers account for 9.8% of guests.
- Key international markets include Costa Rica (30.5%) and Canada (18.3%).
- Top languages spoken are English (38.1%) followed by Spanish (30.5%).
- A significant demographic segment is the Post-2000s (Gen Z/Alpha) group, representing 50% of guests.
Recommendations for Hosts
- Focus marketing internationally, particularly towards travelers from Canada.
- Tailor amenities and listing descriptions to appeal to the dominant Post-2000s (Gen Z/Alpha) demographic (e.g., highlight fast WiFi, smart home features, local guides).
- Highlight unique local experiences or amenities relevant to the primary guest profile.
- Consider seasonal promotions aligned with peak travel times for key origin markets.
Nearby Short-Term Rental Market Comparison
How does the Rivas (Municipio) Airbnb market stack up against its neighbors? Compare key performance metrics like average monthly revenue, ADR, and occupancy rates in surrounding areas to understand the broader regional STR landscape.
| Market | Active Properties | Monthly Revenue | Daily Rate | Avg. Occupancy |
|---|---|---|---|---|
| Nacascolo | 32 | $7,159 | $1165.34 | 35% |
| Pinilla | 74 | $5,903 | $615.77 | 37% |
| Playa Tamarindo | 21 | $5,694 | $409.60 | 48% |
| Playa Langosta | 164 | $4,968 | $497.33 | 42% |
| Tamarindo | 1,232 | $4,671 | $411.22 | 44% |
| Cabo Velas | 944 | $3,808 | $400.71 | 40% |
| Tempate | 698 | $3,352 | $398.13 | 38% |
| Playa Avellana | 54 | $2,682 | $268.17 | 39% |
| Cabeceras | 33 | $2,678 | $201.64 | 46% |
| Sardinal | 1,442 | $2,366 | $246.03 | 40% |