Havelock North Airbnb Market Analysis 2026: Short Term Rental Data & Vacation Rental Statistics in Hawke's Bay, New Zealand
Is Airbnb profitable in Havelock North in 2026? Explore comprehensive Airbnb analytics for Havelock North, Hawke's Bay, New Zealand to uncover income potential. This 2026 STR market report for Havelock North, based on AirROI data from February 2025 to January 2026, reveals key trends in the market of 226 active listings.
Whether you're considering an Airbnb investment in Havelock North, optimizing your existing vacation rental, or exploring rental arbitrage opportunities, understanding the Havelock North Airbnb data is crucial. Leveraging the low regulation environment is key to maximizing your short term rental income potential. Let's dive into the specifics.
Key Havelock North Airbnb Performance Metrics Overview
Monthly Airbnb Revenue Variations & Income Potential in Havelock North (2026)
Understanding the monthly revenue variations for Airbnb listings in Havelock North is key to maximizing your short term rental income potential. Seasonality significantly impacts earnings. Our analysis, based on data from the past 12 months, shows that the peak revenue month for STRs in Havelock North is typically December, while June often presents the lowest earnings, highlighting opportunities for strategic pricing adjustments during shoulder and low seasons. Explore the typical Airbnb income in Havelock North across different performance tiers:
- Best-in-class properties (Top 10%) achieve $5,291+ monthly, often utilizing dynamic pricing and superior guest experiences.
- Strong performing properties (Top 25%) earn $3,015 or more, indicating effective management and desirable locations/amenities.
- Typical properties (Median) generate around $1,631 per month, representing the average market performance.
- Entry-level properties (Bottom 25%) see earnings around $838, often with potential for optimization.
Average Monthly Airbnb Earnings Trend in Havelock North
Havelock North Airbnb Occupancy Rate Trends (2026)
Maximize your bookings by understanding the Havelock North STR occupancy trends. Seasonal demand shifts significantly influence how often properties are booked. Typically, Februarysees the highest demand (peak season occupancy), while June experiences the lowest (low season). Effective strategies, like adjusting minimum stays or offering promotions, can boost occupancy during slower periods. Here's how different property tiers perform in Havelock North:
- Best-in-class properties (Top 10%) achieve 78%+ occupancy, indicating high desirability and potentially optimized availability.
- Strong performing properties (Top 25%) maintain 62% or higher occupancy, suggesting good market fit and guest satisfaction.
- Typical properties (Median) have an occupancy rate around 37%.
- Entry-level properties (Bottom 25%) average 18% occupancy, potentially facing higher vacancy.
Average Monthly Occupancy Rate Trend in Havelock North
Average Daily Rate (ADR) Airbnb Trends in Havelock North (2026)
Effective short term rental pricing strategy in Havelock North involves understanding monthly ADR fluctuations. The Average Daily Rate (ADR) for Airbnb in Havelock North typically peaks in January and dips lowest during August. Leveraging Airbnb dynamic pricing tools or strategies based on this seasonality can significantly boost revenue. Here's a look at the typical nightly rates achieved:
- Best-in-class properties (Top 10%) command rates of $433+ per night, often due to premium features or locations.
- Strong performing properties (Top 25%) achieve nightly rates of $304 or more.
- Typical properties (Median) charge around $189 per night.
- Entry-level properties (Bottom 25%) earn around $103 per night.
Average Daily Rate (ADR) Trend by Month in Havelock North
Get Live Havelock North Market Intelligence 👇

Explore Real-time Analytics
Airbnb Seasonality Analysis & Trends in Havelock North (2026)
Peak Season (December, February, March)
- Revenue averages $3,024 per month
- Occupancy rates average 49.7%
- Daily rates average $233
Shoulder Season
- Revenue averages $2,317 per month
- Occupancy maintains around 39.7%
- Daily rates hold near $230
Low Season (June, July, August)
- Revenue drops to average $1,843 per month
- Occupancy decreases to average 32.6%
- Daily rates adjust to average $227
Seasonality Insights for Havelock North
- The Airbnb seasonality in Havelock North shows moderate seasonality with distinct peak and low periods. While the sections above show seasonal averages, it's also insightful to look at the extremes:
- During the high season, the absolute peak month showcases Havelock North's highest earning potential, with monthly revenues capable of climbing to $3,047, occupancy reaching a high of 55.1%, and ADRs peaking at $242.
- Conversely, the slowest single month of the year, typically falling within the low season, marks the market's lowest point. In this month, revenue might dip to $1,768, occupancy could drop to 30.3%, and ADRs may adjust down to $225.
- Understanding both the seasonal averages and these monthly peaks and troughs in revenue, occupancy, and ADR is crucial for maximizing your Airbnb profit potential in Havelock North.
Seasonal Strategies for Maximizing Profit
- Peak Season: Maximize revenue through premium pricing and potentially longer minimum stays. Ensure high availability.
- Low Season: Offer competitive pricing, special promotions (e.g., extended stay discounts), and flexible cancellation policies. Target off-season travelers like remote workers or budget-conscious guests.
- Shoulder Seasons: Implement dynamic pricing that balances peak and low rates. Target weekend travelers or specific events. Offer slightly more flexible terms than peak season.
- Regularly analyze your own performance against these Havelock North seasonality benchmarks and adjust your pricing and availability strategy accordingly.
Best Areas for Airbnb Investment in Havelock North (2026)
Exploring the top neighborhoods for short-term rentals in Havelock North? This section highlights key areas, outlining why they are attractive for hosts and guests, along with notable local attractions. Consider these locations based on your target guest profile and investment strategy.
| Neighborhood / Area | Why Host Here? (Target Guests & Appeal) | Key Attractions & Landmarks |
|---|---|---|
| Havelock North Village | A charming village atmosphere with boutique shops, cafes, and restaurants. Popular among tourists for its local culture and proximity to wineries and outdoor activities. | Havelock North Domain, Craggy Range Winery, Māori Hill, Te Mata Peak, Brewery tours |
| Te Mata Peak | A stunning natural landmark that offers breathtaking views of Hawke's Bay. Ideal for outdoor enthusiasts and photographers, attracting visitors year-round. | Te Mata Peak walks, Paragliding opportunities, Scenic lookout points, Wine tasting at nearby vineyards, Adventure sports |
| Frimley | A quiet, residential area with beautiful parks and proximity to central Hastings. Attractive to families and those looking for peaceful stays close to urban conveniences. | Frimley Park, Hastings Sports Centre, local markets, pool and recreation facilities, community events |
| Clive | A small town with a relaxed vibe, located near the river and close to beaches. Great for visitors looking to explore both wilderness and local culture. | Clive River wineries, local art galleries, beach access, cycling paths, outdoor recreational activities |
| Hastings City | The bustling center of Hastings offers a mix of culture, art, and culinary delights. Ideal for urban explorers wanting to experience local life and events. | Hastings City Art Gallery, Splash Planet, local farmer's market, restaurants and cafes, cultural festivals |
| Ocean Beach | Famous for its expansive sandy beaches, it attracts those who love sun, surf, and relaxation. A perfect summer getaway destination for tourists. | Ocean Beach surf spots, beach walks, local surf schools, family-friendly accommodations, coastal scenery |
| Waimarama | Known for its stunning beach and coastal views, this area attracts beach lovers and those seeking a laid-back vacation vibe. | Waimarama Beach, scenic hikes, whale watching, local seafood restaurants, water sports |
| Riverside Drive | A picturesque and tranquil area by the river, appealing to those seeking scenic beauty and outdoor activities such as cycling and walking. | river trails, scenic picnic spots, bird watching, proximity to nature reserves, community parks |
Understanding Airbnb License Requirements & STR Laws in Havelock North (2026)
While Havelock North, Hawke's Bay, New Zealand currently shows low STR regulations, specific Airbnb license requirements might still exist or change. Always verify the latest short term rental regulations and Airbnb license requirements directly with local government authorities for Havelock North to ensure full compliance before hosting.
(Source: AirROI data, 2026, finding no licensed listings among those analyzed)
Top Performing Airbnb Properties in Havelock North (2026)
Benchmark your potential! Explore examples of top-performing Airbnb properties in Havelock Northbased on Trailing Twelve Month (TTM) revenue. Analyze their characteristics, revenue, occupancy rate, and ADR to understand what drives success in this market.
Wyatt House
Entire Place • 4 bedrooms

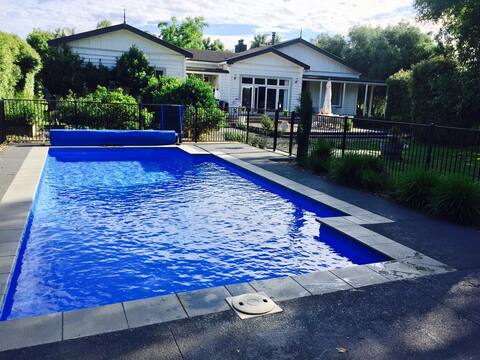
Sunny 4-Bedroom Escape with Pool & Hot Tub
Entire Place • 4 bedrooms
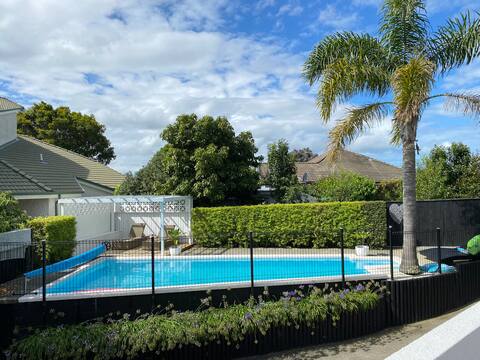
Views and a Pool
Entire Place • 5 bedrooms
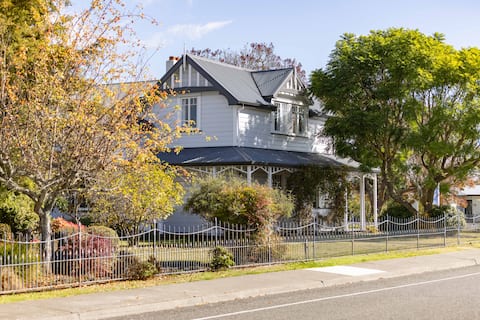
Luxury heritage home in the heart of the village
Entire Place • 5 bedrooms

The Enchanted Retreat - Luxury Glamping
Entire Place • 1 bedroom
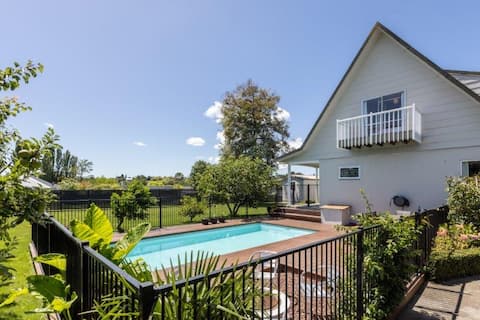
Walk to Village, Lovely Views and Spacious House
Entire Place • 5 bedrooms
Note: Performance varies based on location, size, amenities, seasonality, and management quality. Data reflects the past 12 months.
Top Performing Airbnb Hosts in Havelock North (2026)
Learn from the best! This table showcases top-performing Airbnb hosts in Havelock North based on the number of properties managed and estimated total revenue over the past year. Analyze their scale and performance metrics.
| Host Name | Properties | Grossing Revenue | Stay Reviews | Avg Rating |
|---|---|---|---|---|
| Nicki | 6 | $328,557 | 566 | 4.95/5.0 |
| Richard | 2 | $155,699 | 156 | 4.87/5.0 |
| Melissa | 1 | $114,367 | 155 | 4.96/5.0 |
| Daniel | 1 | $107,687 | 34 | 5.00/5.0 |
| Bachcare | 9 | $93,327 | 92 | 4.73/5.0 |
| Paula | 1 | $85,144 | 19 | 4.95/5.0 |
| Matt And Nic | 1 | $82,903 | 36 | 4.97/5.0 |
| Janine | 6 | $74,500 | 36 | 4.98/5.0 |
| Paul | 3 | $73,938 | 108 | 4.97/5.0 |
| Annette | 2 | $66,891 | 191 | 5.00/5.0 |
Analyzing the strategies of top hosts, such as their property selection, pricing, and guest communication, can offer valuable lessons for optimizing your own Airbnb operations in Havelock North.
Dive Deeper: Advanced Havelock North STR Market Data (2026)
Ready to unlock more insights? AirROI provides access to advanced metrics and comprehensive Airbnb data for Havelock North. Explore detailed analytics beyond this report to refine your investment strategy, optimize pricing, and maximize your vacation rental profits.
Explore Advanced MetricsHavelock North Short-Term Rental Market Composition (2026): Property & Room Types
Room Type Distribution
Property Type Distribution
Market Composition Insights for Havelock North
- The Havelock North Airbnb market composition is heavily skewed towards Entire Home/Apt listings, which make up 87.6% of the 226 active rentals. This indicates strong guest preference for privacy and space.
- Looking at the property type distribution in Havelock North, House properties are the most common (68.1%), reflecting the local real estate landscape.
- Houses represent a significant 68.1% portion, catering likely to families or larger groups.
- The presence of 16.4% Hotel/Boutique listings indicates integration with traditional hospitality.
- Smaller segments like outdoor/unique (combined 0.9%) offer potential for unique stay experiences.
Havelock North Airbnb Room Capacity Analysis (2026): Bedroom Distribution
Distribution of Listings by Number of Bedrooms
Room Capacity Insights for Havelock North
- The dominant room capacity in Havelock North is 2 bedrooms listings, making up 25.2% of the market. This suggests a strong demand for properties suitable for couples or solo travelers.
- Together, 2 bedrooms and 1 bedroom properties represent 45.6% of the active Airbnb listings in Havelock North, indicating a high concentration in these sizes.
- A significant 46.0% of listings offer 3+ bedrooms, catering to larger groups and families seeking more space in Havelock North.
Havelock North Vacation Rental Guest Capacity Trends (2026)
Distribution of Listings by Guest Capacity
Guest Capacity Insights for Havelock North
- The most common guest capacity trend in Havelock North vacation rentals is listings accommodating 8+ guests (23.5%). This suggests the primary traveler segment is likely larger groups.
- Properties designed for 8+ guests and 2 guests dominate the Havelock North STR market, accounting for 43.9% of listings.
- 43.8% of properties accommodate 6+ guests, serving the market segment for larger families or group travel in Havelock North.
- On average, properties in Havelock North are equipped to host 4.7 guests.
Havelock North Airbnb Booking Patterns (2026): Available vs. Booked Days
Available Days Distribution
Booked Days Distribution
Booking Pattern Insights for Havelock North
- The most common availability pattern in Havelock North falls within the 271-366 days range, representing 53.5% of listings. This suggests many properties have significant open periods on their calendars.
- Approximately 76.5% of listings show high availability (181+ days open annually), indicating potential for increased bookings or specific owner usage patterns.
- For booked days, the 31-90 days range is most frequent in Havelock North (36.3%), reflecting common guest stay durations or potential owner blocking patterns.
- A notable 24.4% of properties secure long booking periods (181+ days booked per year), highlighting successful long-term rental strategies or significant owner usage.
Havelock North Airbnb Minimum Stay Requirements Analysis
Distribution of Listings by Minimum Night Requirement
1 Night
52 listings
23% of total
2 Nights
82 listings
36.3% of total
3 Nights
9 listings
4% of total
4-6 Nights
12 listings
5.3% of total
7-29 Nights
2 listings
0.9% of total
30+ Nights
69 listings
30.5% of total
Key Insights
- The most prevalent minimum stay requirement in Havelock North is 2 Nights, adopted by 36.3% of listings. This highlights the market's preference for shorter, flexible bookings.
- A significant segment (30.5%) caters to monthly stays (30+ nights) in Havelock North, pointing to opportunities in the extended-stay market.
Recommendations
- Align with the market by considering a 2 Nights minimum stay, as 36.3% of Havelock North hosts use this setting.
- If feasible, allowing 1-night stays, especially midweek or during low season, could capture last-minute bookings, as only 23% currently do.
- Explore offering discounts for stays of 30+ nights to attract the 30.5% of the market seeking extended stays.
- Adjust minimum nights based on seasonality – potentially shorter during low season and longer during peak demand periods in Havelock North.
Havelock North Airbnb Cancellation Policy Trends Analysis (2026)
Super Strict 60 Days
6 listings
2.7% of total
Super Strict 30 Days
1 listings
0.4% of total
Limited
2 listings
0.9% of total
Flexible
56 listings
24.8% of total
Moderate
67 listings
29.6% of total
Firm
81 listings
35.8% of total
Strict
13 listings
5.8% of total
Cancellation Policy Insights for Havelock North
- The prevailing Airbnb cancellation policy trend in Havelock North is Firm, used by 35.8% of listings.
- There's a relatively balanced mix between guest-friendly (54.4%) and stricter (41.6%) policies, offering choices for different guest needs.
- Strict cancellation policies are quite rare (5.8%), potentially making listings with this policy less competitive unless justified by high demand or property type.
Recommendations for Hosts
- Consider adopting a Firm policy to align with the 35.8% market standard in Havelock North.
- Using a Strict policy might deter some guests, as only 5.8% of listings use it. Evaluate if potential revenue protection outweighs possible lower booking rates.
- Regularly review your cancellation policy against competitors and market demand shifts in Havelock North.
Havelock North STR Booking Lead Time Analysis (2026)
Average Booking Lead Time by Month
Booking Lead Time Insights for Havelock North
- The overall average booking lead time for vacation rentals in Havelock North is 58 days.
- Guests book furthest in advance for stays during November (average 83 days), likely coinciding with peak travel demand or local events.
- The shortest booking windows occur for stays in July (average 27 days), indicating more last-minute travel plans during this time.
- Seasonally, Winter (74 days avg.) sees the longest lead times, while Summer (29 days avg.) has the shortest, reflecting typical travel planning cycles.
Recommendations for Hosts
- Use the overall average lead time (58 days) as a baseline for your pricing and availability strategy in Havelock North.
- For November stays, consider implementing length-of-stay discounts or slightly higher rates for bookings made less than 83 days out to capitalize on advance planning.
- Target marketing efforts for the Winter season well in advance (at least 74 days) to capture early planners.
- Monitor your own booking lead times against these Havelock North averages to identify opportunities for dynamic pricing adjustments.
Popular & Essential Airbnb Amenities in Havelock North (2026)
Amenity Prevalence
Amenity Insights for Havelock North
- Essential amenities in Havelock North that guests expect include: Wifi, Free parking on premises. Lacking these (any) could significantly impact bookings.
- Popular amenities like Smoke alarm, TV, Heating are common but not universal. Offering these can provide a competitive edge.
Recommendations for Hosts
- Ensure your listing includes all essential amenities for Havelock North: Wifi, Free parking on premises.
- Prioritize adding missing essentials: Wifi, Free parking on premises.
- Consider adding popular differentiators like Smoke alarm or TV to increase appeal.
- Highlight unique or less common amenities you offer (e.g., hot tub, dedicated workspace, EV charger) in your listing description and photos.
- Regularly check competitor amenities in Havelock North to stay competitive.
Havelock North Airbnb Guest Demographics & Profile Analysis (2026)
Guest Profile Summary for Havelock North
- The typical guest profile for Airbnb in Havelock North consists of primarily domestic travelers (79%), often arriving from nearby Wellington, typically belonging to the Post-2000s (Gen Z/Alpha) group (50%), primarily speaking English or French.
- Domestic travelers account for 79.0% of guests.
- Key international markets include New Zealand (79%) and Australia (7.2%).
- Top languages spoken are English (74.5%) followed by French (5.7%).
- A significant demographic segment is the Post-2000s (Gen Z/Alpha) group, representing 50% of guests.
Recommendations for Hosts
- Target domestic marketing efforts towards travelers from Wellington and Auckland.
- Tailor amenities and listing descriptions to appeal to the dominant Post-2000s (Gen Z/Alpha) demographic (e.g., highlight fast WiFi, smart home features, local guides).
- Highlight unique local experiences or amenities relevant to the primary guest profile.
- Consider seasonal promotions aligned with peak travel times for key origin markets.
Nearby Short-Term Rental Market Comparison
How does the Havelock North Airbnb market stack up against its neighbors? Compare key performance metrics like average monthly revenue, ADR, and occupancy rates in surrounding areas to understand the broader regional STR landscape.
| Market | Active Properties | Monthly Revenue | Daily Rate | Avg. Occupancy |
|---|---|---|---|---|
| Tikitere | 15 | $2,599 | $238.84 | 48% |
| Hamurana | 28 | $2,555 | $170.74 | 50% |
| Lake Tarawera | 35 | $2,411 | $302.59 | 38% |
| Te Kūiti | 17 | $2,391 | $126.21 | 59% |
| Ngongotahā | 79 | $2,152 | $194.15 | 44% |
| Okere Falls | 32 | $2,118 | $246.61 | 37% |
| Rotorua | 689 | $2,021 | $160.41 | 47% |
| Mourea | 14 | $1,943 | $212.24 | 40% |
| Taupō | 1,004 | $1,942 | $212.13 | 40% |
| Rotoiti | 10 | $1,813 | $232.30 | 32% |