Hastings Airbnb Market Analysis 2026: Short Term Rental Data & Vacation Rental Statistics in Hawke's Bay, New Zealand
Is Airbnb profitable in Hastings in 2026? Explore comprehensive Airbnb analytics for Hastings, Hawke's Bay, New Zealand to uncover income potential. This 2026 STR market report for Hastings, based on AirROI data from February 2025 to January 2026, reveals key trends in the niche market of 173 active listings.
Whether you're considering an Airbnb investment in Hastings, optimizing your existing vacation rental, or exploring rental arbitrage opportunities, understanding the Hastings Airbnb data is crucial. Leveraging the low regulation environment is key to maximizing your short term rental income potential. Let's dive into the specifics.
Key Hastings Airbnb Performance Metrics Overview
Monthly Airbnb Revenue Variations & Income Potential in Hastings (2026)
Understanding the monthly revenue variations for Airbnb listings in Hastings is key to maximizing your short term rental income potential. Seasonality significantly impacts earnings. Our analysis, based on data from the past 12 months, shows that the peak revenue month for STRs in Hastings is typically December, while June often presents the lowest earnings, highlighting opportunities for strategic pricing adjustments during shoulder and low seasons. Explore the typical Airbnb income in Hastings across different performance tiers:
- Best-in-class properties (Top 10%) achieve $3,966+ monthly, often utilizing dynamic pricing and superior guest experiences.
- Strong performing properties (Top 25%) earn $2,404 or more, indicating effective management and desirable locations/amenities.
- Typical properties (Median) generate around $1,253 per month, representing the average market performance.
- Entry-level properties (Bottom 25%) see earnings around $596, often with potential for optimization.
Average Monthly Airbnb Earnings Trend in Hastings
Hastings Airbnb Occupancy Rate Trends (2026)
Maximize your bookings by understanding the Hastings STR occupancy trends. Seasonal demand shifts significantly influence how often properties are booked. Typically, Februarysees the highest demand (peak season occupancy), while June experiences the lowest (low season). Effective strategies, like adjusting minimum stays or offering promotions, can boost occupancy during slower periods. Here's how different property tiers perform in Hastings:
- Best-in-class properties (Top 10%) achieve 76%+ occupancy, indicating high desirability and potentially optimized availability.
- Strong performing properties (Top 25%) maintain 58% or higher occupancy, suggesting good market fit and guest satisfaction.
- Typical properties (Median) have an occupancy rate around 34%.
- Entry-level properties (Bottom 25%) average 17% occupancy, potentially facing higher vacancy.
Average Monthly Occupancy Rate Trend in Hastings
Average Daily Rate (ADR) Airbnb Trends in Hastings (2026)
Effective short term rental pricing strategy in Hastings involves understanding monthly ADR fluctuations. The Average Daily Rate (ADR) for Airbnb in Hastings typically peaks in February and dips lowest during April. Leveraging Airbnb dynamic pricing tools or strategies based on this seasonality can significantly boost revenue. Here's a look at the typical nightly rates achieved:
- Best-in-class properties (Top 10%) command rates of $349+ per night, often due to premium features or locations.
- Strong performing properties (Top 25%) achieve nightly rates of $195 or more.
- Typical properties (Median) charge around $120 per night.
- Entry-level properties (Bottom 25%) earn around $79 per night.
Average Daily Rate (ADR) Trend by Month in Hastings
Get Live Hastings Market Intelligence 👇

Explore Real-time Analytics
Airbnb Seasonality Analysis & Trends in Hastings (2026)
Peak Season (December, March, February)
- Revenue averages $2,345 per month
- Occupancy rates average 46.7%
- Daily rates average $172
Shoulder Season
- Revenue averages $1,922 per month
- Occupancy maintains around 38.0%
- Daily rates hold near $170
Low Season (June, July, September)
- Revenue drops to average $1,432 per month
- Occupancy decreases to average 31.6%
- Daily rates adjust to average $172
Seasonality Insights for Hastings
- The Airbnb seasonality in Hastings shows moderate seasonality with distinct peak and low periods. While the sections above show seasonal averages, it's also insightful to look at the extremes:
- During the high season, the absolute peak month showcases Hastings's highest earning potential, with monthly revenues capable of climbing to $2,385, occupancy reaching a high of 48.9%, and ADRs peaking at $176.
- Conversely, the slowest single month of the year, typically falling within the low season, marks the market's lowest point. In this month, revenue might dip to $1,308, occupancy could drop to 29.2%, and ADRs may adjust down to $168.
- Understanding both the seasonal averages and these monthly peaks and troughs in revenue, occupancy, and ADR is crucial for maximizing your Airbnb profit potential in Hastings.
Seasonal Strategies for Maximizing Profit
- Peak Season: Maximize revenue through premium pricing and potentially longer minimum stays. Ensure high availability.
- Low Season: Offer competitive pricing, special promotions (e.g., extended stay discounts), and flexible cancellation policies. Target off-season travelers like remote workers or budget-conscious guests.
- Shoulder Seasons: Implement dynamic pricing that balances peak and low rates. Target weekend travelers or specific events. Offer slightly more flexible terms than peak season.
- Regularly analyze your own performance against these Hastings seasonality benchmarks and adjust your pricing and availability strategy accordingly.
Best Areas for Airbnb Investment in Hastings (2026)
Exploring the top neighborhoods for short-term rentals in Hastings? This section highlights key areas, outlining why they are attractive for hosts and guests, along with notable local attractions. Consider these locations based on your target guest profile and investment strategy.
| Neighborhood / Area | Why Host Here? (Target Guests & Appeal) | Key Attractions & Landmarks |
|---|---|---|
| Hastings City Center | The vibrant hub of Hastings, offering a mix of shopping, dining, and cultural experiences. It's a great area for tourists looking to explore local attractions and enjoy festivals throughout the year. | Hastings Art Gallery, Hawke's Bay Farmers' Market, Napier-Hastings Cycle Trail, Splash Planet, Hastings City Botanic Gardens |
| Clive | A picturesque small town close to Hastings, known for its charming riverside setting and access to outdoor activities. Suitable for visitors looking for a relaxing getaway near nature. | Clive River, Clive Square, Waimataitahi Reserve, Local wineries, Cycle trails |
| Havelock North | A thriving village known for its boutique shopping, gourmet dining, and access to vineyards. Ideal for tourists wanting a more serene experience while still close to Hastings. | Te Mata Peak, Havelock North Village, Local vineyards, Wineries, Havelock North Domain |
| Cape Kidnappers | Famous for its dramatic cliffs and beautiful coastline, this area attracts nature lovers and those seeking adventure. Great for eco-tourism and exploring the natural beauty of Hawke's Bay. | Cape Kidnappers Golf Course, Gannet Colony, Walking trails, Beach access, Scenic views |
| Frimley | A peaceful residential area with parks and family-friendly amenities. Ideal for families traveling to Hastings or looking for longer stays with convenient access to the city. | Frimley Park, Shopping centers, Children's playgrounds, Local cafes, Community events |
| Taradale | A suburb of Napier, known for its wineries and parks. A great spot for travelers who wish to experience the Hawke's Bay wine region and enjoy outdoor activities. | Mission Estate Winery, Church Road Winery, Taradale Park, Local eateries, Cycling tracks |
| Ruahine | Offers a rural experience with beautiful landscapes and opportunities for outdoor activities such as hiking or biking. Perfect for guests looking for tranquility and adventure. | Ruahine Ranges, Hiking trails, Scenic viewpoints, Biking paths, Wildlife spotting |
| Waimarama Beach | A stunning beach location known for its surf, stunning scenery, and relaxed vibe. Attracts beachgoers and those looking for a summer getaway. | Waimarama Beach, Surf schools, Beachfront cafes, Walking tracks, Scenic lookouts |
Understanding Airbnb License Requirements & STR Laws in Hastings (2026)
While Hastings, Hawke's Bay, New Zealand currently shows low STR regulations, specific Airbnb license requirements might still exist or change. Always verify the latest short term rental regulations and Airbnb license requirements directly with local government authorities for Hastings to ensure full compliance before hosting.
(Source: AirROI data, 2026, finding no licensed listings among those analyzed)
Top Performing Airbnb Properties in Hastings (2026)
Benchmark your potential! Explore examples of top-performing Airbnb properties in Hastingsbased on Trailing Twelve Month (TTM) revenue. Analyze their characteristics, revenue, occupancy rate, and ADR to understand what drives success in this market.
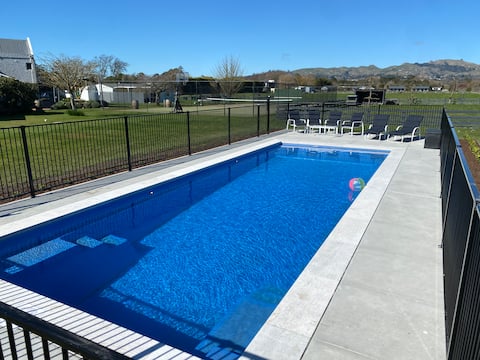
Tuki Views House with Pool, Spa and Tennis Court
Entire Place • 4 bedrooms
Lodge On St Georges
Entire Place • 8 bedrooms

Huge 5+ bed home with pool, perfect for 2 families
Entire Place • 5 bedrooms

Luxury above the Tuki Tuki
Entire Place • 5 bedrooms
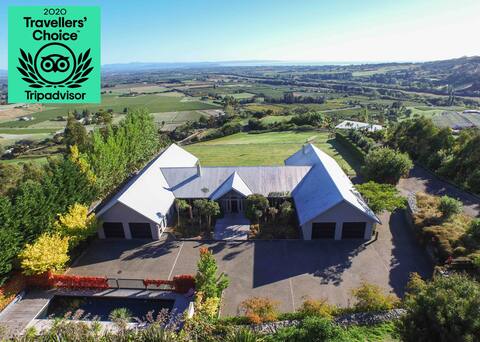
Highcliff
Entire Place • 5 bedrooms

3 Bed Oasis in Central Hastings
Entire Place • 3 bedrooms
Note: Performance varies based on location, size, amenities, seasonality, and management quality. Data reflects the past 12 months.
Top Performing Airbnb Hosts in Hastings (2026)
Learn from the best! This table showcases top-performing Airbnb hosts in Hastings based on the number of properties managed and estimated total revenue over the past year. Analyze their scale and performance metrics.
| Host Name | Properties | Grossing Revenue | Stay Reviews | Avg Rating |
|---|---|---|---|---|
| Diane | 1 | $140,839 | 81 | 4.98/5.0 |
| Highcliff | 2 | $101,438 | 246 | 4.80/5.0 |
| Kate | 1 | $97,312 | 7 | 5.00/5.0 |
| Brendan | 1 | $88,244 | 27 | 4.81/5.0 |
| Tim | 4 | $86,751 | 378 | 4.84/5.0 |
| Nicki | 2 | $80,686 | 151 | 4.93/5.0 |
| Belinda Jill | 1 | $76,718 | 5 | 5.00/5.0 |
| Jane | 3 | $64,331 | 158 | 4.93/5.0 |
| Mark | 1 | $60,262 | 70 | 5.00/5.0 |
| Phoebe | 2 | $53,284 | 33 | 4.96/5.0 |
Analyzing the strategies of top hosts, such as their property selection, pricing, and guest communication, can offer valuable lessons for optimizing your own Airbnb operations in Hastings.
Dive Deeper: Advanced Hastings STR Market Data (2026)
Ready to unlock more insights? AirROI provides access to advanced metrics and comprehensive Airbnb data for Hastings. Explore detailed analytics beyond this report to refine your investment strategy, optimize pricing, and maximize your vacation rental profits.
Explore Advanced MetricsHastings Short-Term Rental Market Composition (2026): Property & Room Types
Room Type Distribution
Property Type Distribution
Market Composition Insights for Hastings
- The Hastings Airbnb market composition is heavily skewed towards Entire Home/Apt listings, which make up 83.8% of the 173 active rentals. This indicates strong guest preference for privacy and space.
- Looking at the property type distribution in Hastings, House properties are the most common (64.2%), reflecting the local real estate landscape.
- Houses represent a significant 64.2% portion, catering likely to families or larger groups.
- The presence of 18.5% Hotel/Boutique listings indicates integration with traditional hospitality.
- Smaller segments like outdoor/unique, apartment/condo, unique stays (combined 9.2%) offer potential for unique stay experiences.
Hastings Airbnb Room Capacity Analysis (2026): Bedroom Distribution
Distribution of Listings by Number of Bedrooms
Room Capacity Insights for Hastings
- The dominant room capacity in Hastings is 1 bedroom listings, making up 27.7% of the market. This suggests a strong demand for properties suitable for couples or solo travelers.
- Together, 1 bedroom and 2 bedrooms properties represent 52.0% of the active Airbnb listings in Hastings, indicating a high concentration in these sizes.
- A significant 30.1% of listings offer 3+ bedrooms, catering to larger groups and families seeking more space in Hastings.
Hastings Vacation Rental Guest Capacity Trends (2026)
Distribution of Listings by Guest Capacity
Guest Capacity Insights for Hastings
- The most common guest capacity trend in Hastings vacation rentals is listings accommodating 2 guests (29.5%). This suggests the primary traveler segment is likely couples or solo travelers.
- Properties designed for 2 guests and 4 guests dominate the Hastings STR market, accounting for 50.9% of listings.
- 26.5% of properties accommodate 6+ guests, serving the market segment for larger families or group travel in Hastings.
- On average, properties in Hastings are equipped to host 3.7 guests.
Hastings Airbnb Booking Patterns (2026): Available vs. Booked Days
Available Days Distribution
Booked Days Distribution
Booking Pattern Insights for Hastings
- The most common availability pattern in Hastings falls within the 271-366 days range, representing 48% of listings. This suggests many properties have significant open periods on their calendars.
- Approximately 84.4% of listings show high availability (181+ days open annually), indicating potential for increased bookings or specific owner usage patterns.
- For booked days, the 91-180 days range is most frequent in Hastings (37.6%), reflecting common guest stay durations or potential owner blocking patterns.
- A notable 17.4% of properties secure long booking periods (181+ days booked per year), highlighting successful long-term rental strategies or significant owner usage.
Hastings Airbnb Minimum Stay Requirements Analysis
Distribution of Listings by Minimum Night Requirement
1 Night
59 listings
34.1% of total
2 Nights
71 listings
41% of total
3 Nights
6 listings
3.5% of total
4-6 Nights
2 listings
1.2% of total
7-29 Nights
1 listings
0.6% of total
30+ Nights
34 listings
19.7% of total
Key Insights
- The most prevalent minimum stay requirement in Hastings is 2 Nights, adopted by 41% of listings. This highlights the market's preference for shorter, flexible bookings.
- A strong majority (75.1%) of the Hastings Airbnb data shows acceptance of very short stays (1-2 nights), indicating a dynamic, high-turnover market.
- A significant segment (19.7%) caters to monthly stays (30+ nights) in Hastings, pointing to opportunities in the extended-stay market.
Recommendations
- Align with the market by considering a 2 Nights minimum stay, as 41% of Hastings hosts use this setting.
- Explore offering discounts for stays of 30+ nights to attract the 19.7% of the market seeking extended stays.
- Adjust minimum nights based on seasonality – potentially shorter during low season and longer during peak demand periods in Hastings.
Hastings Airbnb Cancellation Policy Trends Analysis (2026)
Limited
2 listings
1.2% of total
Super Strict 60 Days
6 listings
3.5% of total
Flexible
52 listings
30.1% of total
Moderate
67 listings
38.7% of total
Firm
38 listings
22% of total
Strict
8 listings
4.6% of total
Cancellation Policy Insights for Hastings
- The prevailing Airbnb cancellation policy trend in Hastings is Moderate, used by 38.7% of listings.
- There's a relatively balanced mix between guest-friendly (68.8%) and stricter (26.6%) policies, offering choices for different guest needs.
- Strict cancellation policies are quite rare (4.6%), potentially making listings with this policy less competitive unless justified by high demand or property type.
Recommendations for Hosts
- Consider adopting a Moderate policy to align with the 38.7% market standard in Hastings.
- Using a Strict policy might deter some guests, as only 4.6% of listings use it. Evaluate if potential revenue protection outweighs possible lower booking rates.
- Regularly review your cancellation policy against competitors and market demand shifts in Hastings.
Hastings STR Booking Lead Time Analysis (2026)
Average Booking Lead Time by Month
Booking Lead Time Insights for Hastings
- The overall average booking lead time for vacation rentals in Hastings is 52 days.
- Guests book furthest in advance for stays during December (average 88 days), likely coinciding with peak travel demand or local events.
- The shortest booking windows occur for stays in June (average 26 days), indicating more last-minute travel plans during this time.
- Seasonally, Winter (69 days avg.) sees the longest lead times, while Summer (32 days avg.) has the shortest, reflecting typical travel planning cycles.
Recommendations for Hosts
- Use the overall average lead time (52 days) as a baseline for your pricing and availability strategy in Hastings.
- For December stays, consider implementing length-of-stay discounts or slightly higher rates for bookings made less than 88 days out to capitalize on advance planning.
- Target marketing efforts for the Winter season well in advance (at least 69 days) to capture early planners.
- Monitor your own booking lead times against these Hastings averages to identify opportunities for dynamic pricing adjustments.
Popular & Essential Airbnb Amenities in Hastings (2026)
Amenity Prevalence
Amenity Insights for Hastings
- Essential amenities in Hastings that guests expect include: Wifi, Smoke alarm. Lacking these (any) could significantly impact bookings.
- Popular amenities like Free parking on premises, TV, Heating are common but not universal. Offering these can provide a competitive edge.
Recommendations for Hosts
- Ensure your listing includes all essential amenities for Hastings: Wifi, Smoke alarm.
- Prioritize adding missing essentials: Wifi, Smoke alarm.
- Consider adding popular differentiators like Free parking on premises or TV to increase appeal.
- Highlight unique or less common amenities you offer (e.g., hot tub, dedicated workspace, EV charger) in your listing description and photos.
- Regularly check competitor amenities in Hastings to stay competitive.
Hastings Airbnb Guest Demographics & Profile Analysis (2026)
Guest Profile Summary for Hastings
- The typical guest profile for Airbnb in Hastings consists of primarily domestic travelers (79%), often arriving from nearby Wellington, typically belonging to the Post-2000s (Gen Z/Alpha) group (50%), primarily speaking English or German.
- Domestic travelers account for 78.8% of guests.
- Key international markets include New Zealand (78.8%) and Australia (7.4%).
- Top languages spoken are English (67.7%) followed by German (5.8%).
- A significant demographic segment is the Post-2000s (Gen Z/Alpha) group, representing 50% of guests.
Recommendations for Hosts
- Target domestic marketing efforts towards travelers from Wellington and Auckland.
- Tailor amenities and listing descriptions to appeal to the dominant Post-2000s (Gen Z/Alpha) demographic (e.g., highlight fast WiFi, smart home features, local guides).
- Highlight unique local experiences or amenities relevant to the primary guest profile.
- Consider seasonal promotions aligned with peak travel times for key origin markets.
Nearby Short-Term Rental Market Comparison
How does the Hastings Airbnb market stack up against its neighbors? Compare key performance metrics like average monthly revenue, ADR, and occupancy rates in surrounding areas to understand the broader regional STR landscape.
| Market | Active Properties | Monthly Revenue | Daily Rate | Avg. Occupancy |
|---|---|---|---|---|
| Tikitere | 15 | $2,599 | $238.84 | 48% |
| Hamurana | 28 | $2,555 | $170.74 | 50% |
| Lake Tarawera | 35 | $2,411 | $302.59 | 38% |
| Te Kūiti | 17 | $2,391 | $126.21 | 59% |
| Ngongotahā | 79 | $2,152 | $194.15 | 44% |
| Okere Falls | 32 | $2,118 | $246.61 | 37% |
| Rotorua | 689 | $2,021 | $160.41 | 47% |
| Mourea | 14 | $1,943 | $212.24 | 40% |
| Taupō | 1,004 | $1,942 | $212.13 | 40% |
| Rotoiti | 10 | $1,813 | $232.31 | 32% |