Cadzand Airbnb Market Analysis 2026: Short Term Rental Data & Vacation Rental Statistics in Zeeland, Netherlands
Is Airbnb profitable in Cadzand in 2026? Explore comprehensive Airbnb analytics for Cadzand, Zeeland, Netherlands to uncover income potential. This 2026 STR market report for Cadzand, based on AirROI data from February 2025 to January 2026, reveals key trends in the niche market of 123 active listings.
Whether you're considering an Airbnb investment in Cadzand, optimizing your existing vacation rental, or exploring rental arbitrage opportunities, understanding the Cadzand Airbnb data is crucial. Navigating the high regulation landscape is key to maximizing your short term rental income potential. Let's dive into the specifics.
Key Cadzand Airbnb Performance Metrics Overview
Monthly Airbnb Revenue Variations & Income Potential in Cadzand (2026)
Understanding the monthly revenue variations for Airbnb listings in Cadzand is key to maximizing your short term rental income potential. Seasonality significantly impacts earnings. Our analysis, based on data from the past 12 months, shows that the peak revenue month for STRs in Cadzand is typically August, while January often presents the lowest earnings, highlighting opportunities for strategic pricing adjustments during shoulder and low seasons. Explore the typical Airbnb income in Cadzand across different performance tiers:
- Best-in-class properties (Top 10%) achieve $6,369+ monthly, often utilizing dynamic pricing and superior guest experiences.
- Strong performing properties (Top 25%) earn $4,595 or more, indicating effective management and desirable locations/amenities.
- Typical properties (Median) generate around $2,778 per month, representing the average market performance.
- Entry-level properties (Bottom 25%) see earnings around $1,502, often with potential for optimization.
Average Monthly Airbnb Earnings Trend in Cadzand
Cadzand Airbnb Occupancy Rate Trends (2026)
Maximize your bookings by understanding the Cadzand STR occupancy trends. Seasonal demand shifts significantly influence how often properties are booked. Typically, Augustsees the highest demand (peak season occupancy), while January experiences the lowest (low season). Effective strategies, like adjusting minimum stays or offering promotions, can boost occupancy during slower periods. Here's how different property tiers perform in Cadzand:
- Best-in-class properties (Top 10%) achieve 68%+ occupancy, indicating high desirability and potentially optimized availability.
- Strong performing properties (Top 25%) maintain 53% or higher occupancy, suggesting good market fit and guest satisfaction.
- Typical properties (Median) have an occupancy rate around 36%.
- Entry-level properties (Bottom 25%) average 20% occupancy, potentially facing higher vacancy.
Average Monthly Occupancy Rate Trend in Cadzand
Average Daily Rate (ADR) Airbnb Trends in Cadzand (2026)
Effective short term rental pricing strategy in Cadzand involves understanding monthly ADR fluctuations. The Average Daily Rate (ADR) for Airbnb in Cadzand typically peaks in July and dips lowest during March. Leveraging Airbnb dynamic pricing tools or strategies based on this seasonality can significantly boost revenue. Here's a look at the typical nightly rates achieved:
- Best-in-class properties (Top 10%) command rates of $462+ per night, often due to premium features or locations.
- Strong performing properties (Top 25%) achieve nightly rates of $330 or more.
- Typical properties (Median) charge around $243 per night.
- Entry-level properties (Bottom 25%) earn around $177 per night.
Average Daily Rate (ADR) Trend by Month in Cadzand
Get Live Cadzand Market Intelligence 👇

Explore Real-time Analytics
Airbnb Seasonality Analysis & Trends in Cadzand (2026)
Peak Season (August, July, April)
- Revenue averages $5,764 per month
- Occupancy rates average 58.7%
- Daily rates average $306
Shoulder Season
- Revenue averages $3,238 per month
- Occupancy maintains around 36.9%
- Daily rates hold near $283
Low Season (January, February, November)
- Revenue drops to average $1,545 per month
- Occupancy decreases to average 19.4%
- Daily rates adjust to average $269
Seasonality Insights for Cadzand
- The Airbnb seasonality in Cadzand shows highly seasonal trends requiring careful strategy. While the sections above show seasonal averages, it's also insightful to look at the extremes:
- During the high season, the absolute peak month showcases Cadzand's highest earning potential, with monthly revenues capable of climbing to $6,903, occupancy reaching a high of 66.9%, and ADRs peaking at $324.
- Conversely, the slowest single month of the year, typically falling within the low season, marks the market's lowest point. In this month, revenue might dip to $1,263, occupancy could drop to 12.2%, and ADRs may adjust down to $240.
- Understanding both the seasonal averages and these monthly peaks and troughs in revenue, occupancy, and ADR is crucial for maximizing your Airbnb profit potential in Cadzand.
Seasonal Strategies for Maximizing Profit
- Peak Season: Maximize revenue through premium pricing and potentially longer minimum stays. Ensure high availability.
- Low Season: Offer competitive pricing, special promotions (e.g., extended stay discounts), and flexible cancellation policies. Target off-season travelers like remote workers or budget-conscious guests.
- Shoulder Seasons: Implement dynamic pricing that balances peak and low rates. Target weekend travelers or specific events. Offer slightly more flexible terms than peak season.
- Regularly analyze your own performance against these Cadzand seasonality benchmarks and adjust your pricing and availability strategy accordingly.
Best Areas for Airbnb Investment in Cadzand (2026)
Exploring the top neighborhoods for short-term rentals in Cadzand? This section highlights key areas, outlining why they are attractive for hosts and guests, along with notable local attractions. Consider these locations based on your target guest profile and investment strategy.
| Neighborhood / Area | Why Host Here? (Target Guests & Appeal) | Key Attractions & Landmarks |
|---|---|---|
| Cadzand-Bad | Popular beach resort area known for its beautiful sandy beaches and Dunes. Attracts tourists seeking a relaxing seaside experience with various water sports and beach activities. | Cadzand Beach, Molen van Cadzand, Nature Reserve de Zwarte Polder, Hiking and cycling trails, Dune areas, Local seafood restaurants |
| Cadzand village | A quaint, traditional Dutch village that offers a calm atmosphere and picturesque streets. Great for families and those looking for a peaceful retreat. | Historic village center, Cultural events, Local artisan shops, Scenic countryside, Biking routes, Nearby farms |
| Nieuwvliet | A small village near Cadzand known for its laid-back vibe and proximity to the beach. Ideal for tourists looking for a quieter alternative to busier beach areas. | Nieuwvliet Beach, Natural landscapes, Cycling paths, Local eateries, Nearby wetlands, Outdoor activities |
| Zoutelande | Beautiful coastal village that's slightly inland and close to larger tourist destinations. Offers a charming village atmosphere with excellent beach access. | Zoutelande Beach, Dune landscapes, Restaurants and cafes, Cycling and walking paths, Events and festivals, Nearby nature areas |
| Oostburg | A town a bit further inland known for its accessibility and local amenities. Suitable for tourists who want to explore Zeeland with a homey base. | Historic town center, Local markets, Restaurants, Cycling routes to Cadzand, Proximity to nature reserves, Art and culture events |
| Sluis | Charming border town known for its shopping and dining scene, plus its proximity to the Belgian border. Attracts tourists interested in both Dutch and Belgian culture. | Shopping streets, Historical landmarks, Cafes and bakeries, Local festivals, Canal walks, Art galleries |
| Knokke-Heist | A popular upscale beach destination just across the border in Belgium. Attracts high-end travelers with its luxury accommodations and vibrant nightlife. | Knokke Beach, Art galleries, Luxury shops, Fine dining, Golf courses, Water sports |
| Westkapelle | A small town known for its beautiful beaches and unique coastal character. Great for tourists looking for a balance of relaxation and outdoor activities. | Westkapelle Beach, Historic lighthouse, Walking paths along the coast, Local cuisine, Windmills, Scenic views |
Understanding Airbnb License Requirements & STR Laws in Cadzand (2026)
Yes, Cadzand, Zeeland, Netherlands enforces high STR regulations. Obtaining a license and ensuring compliance is almost certainly required according to current 2026 STR laws. Always verify the latest short term rental regulations and Airbnb license requirements directly with local government authorities for Cadzand to ensure full compliance before hosting.
(Source: AirROI data, 2026, based on 92% licensed listings)
Top Performing Airbnb Properties in Cadzand (2026)
Benchmark your potential! Explore examples of top-performing Airbnb properties in Cadzandbased on Trailing Twelve Month (TTM) revenue. Analyze their characteristics, revenue, occupancy rate, and ADR to understand what drives success in this market.
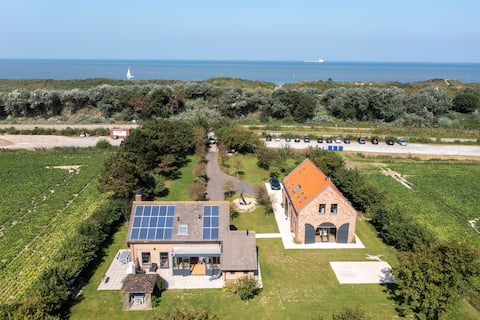
't Zwarte Anker, Surrounded by Nature
Entire Place • 9 bedrooms

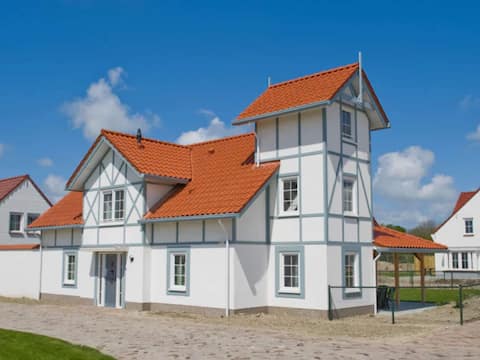
Beautiful family beach house on the dunes
Entire Place • 5 bedrooms
Villa in Cadzand-Bad near North Sea Beach
Entire Place • 7 bedrooms
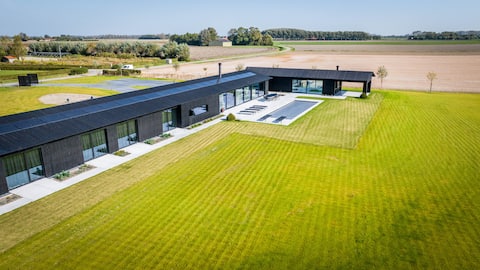
CasaRita, Design villa with pool
Entire Place • 5 bedrooms

Beautiful penthouse with spectacular sea view
Entire Place • 2 bedrooms
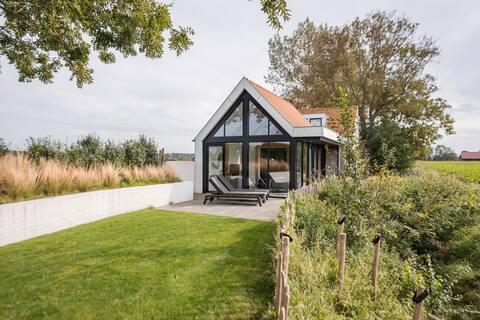
Renovated dike house 900 m from the beach
Entire Place • 4 bedrooms
Note: Performance varies based on location, size, amenities, seasonality, and management quality. Data reflects the past 12 months.
Top Performing Airbnb Hosts in Cadzand (2026)
Learn from the best! This table showcases top-performing Airbnb hosts in Cadzand based on the number of properties managed and estimated total revenue over the past year. Analyze their scale and performance metrics.
| Host Name | Properties | Grossing Revenue | Stay Reviews | Avg Rating |
|---|---|---|---|---|
| Room Of Cadzand | 34 | $1,120,397 | 633 | 4.71/5.0 |
| Diana - BELVILLA | 13 | $328,766 | 65 | 3.98/5.0 |
| Danielle | 3 | $261,978 | 101 | 4.76/5.0 |
| Leticia And Gaetan | 1 | $235,318 | 32 | 5.00/5.0 |
| Anna From HUSWELL | 5 | $229,142 | 60 | 4.33/5.0 |
| Villa Mer | 18 | $207,070 | 34 | 4.40/5.0 |
| Immo De Nijs | 3 | $118,409 | 18 | 4.79/5.0 |
| Hello | 5 | $114,334 | 23 | 4.18/5.0 |
| Monique | 2 | $83,398 | 261 | 4.74/5.0 |
| Johan | 1 | $78,164 | 161 | 4.69/5.0 |
Analyzing the strategies of top hosts, such as their property selection, pricing, and guest communication, can offer valuable lessons for optimizing your own Airbnb operations in Cadzand.
Dive Deeper: Advanced Cadzand STR Market Data (2026)
Ready to unlock more insights? AirROI provides access to advanced metrics and comprehensive Airbnb data for Cadzand. Explore detailed analytics beyond this report to refine your investment strategy, optimize pricing, and maximize your vacation rental profits.
Explore Advanced MetricsCadzand Short-Term Rental Market Composition (2026): Property & Room Types
Room Type Distribution
Property Type Distribution
Market Composition Insights for Cadzand
- The Cadzand Airbnb market composition is heavily skewed towards Entire Home/Apt listings, which make up 98.4% of the 123 active rentals. This indicates strong guest preference for privacy and space.
- Looking at the property type distribution in Cadzand, Apartment/Condo properties are the most common (64.2%), reflecting the local real estate landscape.
- Houses represent a significant 35% portion, catering likely to families or larger groups.
- Smaller segments like others (combined 0.8%) offer potential for unique stay experiences.
Cadzand Airbnb Room Capacity Analysis (2026): Bedroom Distribution
Distribution of Listings by Number of Bedrooms
Room Capacity Insights for Cadzand
- The dominant room capacity in Cadzand is 2 bedrooms listings, making up 42.3% of the market. This suggests a strong demand for properties suitable for couples or solo travelers.
- Together, 2 bedrooms and 3 bedrooms properties represent 65.1% of the active Airbnb listings in Cadzand, indicating a high concentration in these sizes.
- A significant 41.5% of listings offer 3+ bedrooms, catering to larger groups and families seeking more space in Cadzand.
Cadzand Vacation Rental Guest Capacity Trends (2026)
Distribution of Listings by Guest Capacity
Guest Capacity Insights for Cadzand
- The most common guest capacity trend in Cadzand vacation rentals is listings accommodating 4 guests (31.7%). This suggests the primary traveler segment is likely small families or groups.
- Properties designed for 4 guests and 6 guests dominate the Cadzand STR market, accounting for 54.5% of listings.
- 44.7% of properties accommodate 6+ guests, serving the market segment for larger families or group travel in Cadzand.
- On average, properties in Cadzand are equipped to host 5.1 guests.
Cadzand Airbnb Booking Patterns (2026): Available vs. Booked Days
Available Days Distribution
Booked Days Distribution
Booking Pattern Insights for Cadzand
- The most common availability pattern in Cadzand falls within the 271-366 days range, representing 49.6% of listings. This suggests many properties have significant open periods on their calendars.
- Approximately 86.2% of listings show high availability (181+ days open annually), indicating potential for increased bookings or specific owner usage patterns.
- For booked days, the 91-180 days range is most frequent in Cadzand (36.6%), reflecting common guest stay durations or potential owner blocking patterns.
- A notable 15.4% of properties secure long booking periods (181+ days booked per year), highlighting successful long-term rental strategies or significant owner usage.
Cadzand Airbnb Minimum Stay Requirements Analysis
Distribution of Listings by Minimum Night Requirement
1 Night
11 listings
9% of total
2 Nights
12 listings
9.8% of total
3 Nights
2 listings
1.6% of total
4-6 Nights
9 listings
7.4% of total
7-29 Nights
2 listings
1.6% of total
30+ Nights
86 listings
70.5% of total
Key Insights
- The most prevalent minimum stay requirement in Cadzand is 30+ Nights, adopted by 70.5% of listings. This highlights the market's preference for longer commitments.
- Very short stays (1-2 nights) are less common (18.8%), suggesting hosts prefer slightly longer bookings to optimize turnover.
- A significant segment (70.5%) caters to monthly stays (30+ nights) in Cadzand, pointing to opportunities in the extended-stay market.
Recommendations
- Align with the market by considering a 30+ Nights minimum stay, as 70.5% of Cadzand hosts use this setting.
- If feasible, allowing 1-night stays, especially midweek or during low season, could capture last-minute bookings, as only 9% currently do.
- Explore offering discounts for stays of 30+ nights to attract the 70.5% of the market seeking extended stays.
- Adjust minimum nights based on seasonality – potentially shorter during low season and longer during peak demand periods in Cadzand.
Cadzand Airbnb Cancellation Policy Trends Analysis (2026)
Super Strict 60 Days
26 listings
21.3% of total
Super Strict 30 Days
2 listings
1.6% of total
Limited
2 listings
1.6% of total
Flexible
1 listings
0.8% of total
Moderate
15 listings
12.3% of total
Firm
67 listings
54.9% of total
Strict
9 listings
7.4% of total
Cancellation Policy Insights for Cadzand
- The prevailing Airbnb cancellation policy trend in Cadzand is Firm, used by 54.9% of listings.
- A majority (62.3%) of hosts in Cadzand utilize Firm or Strict policies, indicating a market where hosts prioritize booking security.
- Strict cancellation policies are quite rare (7.4%), potentially making listings with this policy less competitive unless justified by high demand or property type.
Recommendations for Hosts
- Consider adopting a Firm policy to align with the 54.9% market standard in Cadzand.
- Using a Strict policy might deter some guests, as only 7.4% of listings use it. Evaluate if potential revenue protection outweighs possible lower booking rates.
- Regularly review your cancellation policy against competitors and market demand shifts in Cadzand.
Cadzand STR Booking Lead Time Analysis (2026)
Average Booking Lead Time by Month
Booking Lead Time Insights for Cadzand
- The overall average booking lead time for vacation rentals in Cadzand is 67 days.
- Guests book furthest in advance for stays during August (average 112 days), likely coinciding with peak travel demand or local events.
- The shortest booking windows occur for stays in February (average 29 days), indicating more last-minute travel plans during this time.
- Seasonally, Summer (99 days avg.) sees the longest lead times, while Winter (40 days avg.) has the shortest, reflecting typical travel planning cycles.
Recommendations for Hosts
- Use the overall average lead time (67 days) as a baseline for your pricing and availability strategy in Cadzand.
- For August stays, consider implementing length-of-stay discounts or slightly higher rates for bookings made less than 112 days out to capitalize on advance planning.
- Target marketing efforts for the Summer season well in advance (at least 99 days) to capture early planners.
- Monitor your own booking lead times against these Cadzand averages to identify opportunities for dynamic pricing adjustments.
Popular & Essential Airbnb Amenities in Cadzand (2026)
Amenity Prevalence
Amenity Insights for Cadzand
- Essential amenities in Cadzand that guests expect include: Wifi, Coffee maker, TV, Kitchen, Heating. Lacking these (any) could significantly impact bookings.
- Popular amenities like Dishwasher, Free parking on premises, Dishes and silverware are common but not universal. Offering these can provide a competitive edge.
Recommendations for Hosts
- Ensure your listing includes all essential amenities for Cadzand: Wifi, Coffee maker, TV, Kitchen, Heating.
- Prioritize adding missing essentials: Wifi, Coffee maker, TV, Kitchen, Heating.
- Consider adding popular differentiators like Dishwasher or Free parking on premises to increase appeal.
- Highlight unique or less common amenities you offer (e.g., hot tub, dedicated workspace, EV charger) in your listing description and photos.
- Regularly check competitor amenities in Cadzand to stay competitive.
Cadzand Airbnb Guest Demographics & Profile Analysis (2026)
Guest Profile Summary for Cadzand
- The typical guest profile for Airbnb in Cadzand consists of predominantly international visitors (83%), with top international origins including Belgium, typically belonging to the Post-2000s (Gen Z/Alpha) group (50%), primarily speaking English or German.
- Domestic travelers account for 17.1% of guests.
- Key international markets include Germany (54.5%) and Belgium (19.4%).
- Top languages spoken are English (37.2%) followed by German (29%).
- A significant demographic segment is the Post-2000s (Gen Z/Alpha) group, representing 50% of guests.
Recommendations for Hosts
- Focus marketing internationally, particularly towards travelers from Belgium.
- Tailor amenities and listing descriptions to appeal to the dominant Post-2000s (Gen Z/Alpha) demographic (e.g., highlight fast WiFi, smart home features, local guides).
- Highlight unique local experiences or amenities relevant to the primary guest profile.
- Consider seasonal promotions aligned with peak travel times for key origin markets.
Nearby Short-Term Rental Market Comparison
How does the Cadzand Airbnb market stack up against its neighbors? Compare key performance metrics like average monthly revenue, ADR, and occupancy rates in surrounding areas to understand the broader regional STR landscape.
| Market | Active Properties | Monthly Revenue | Daily Rate | Avg. Occupancy |
|---|---|---|---|---|
| Raamsdonksveer | 16 | $7,756 | $736.17 | 38% |
| Kockengen | 11 | $6,027 | $485.77 | 53% |
| Lo-Reninge | 13 | $5,989 | $454.03 | 42% |
| Mont-de-l'Enclus | 10 | $5,398 | $407.81 | 36% |
| Merksplas | 12 | $5,367 | $356.64 | 43% |
| Zerkegem | 10 | $4,846 | $437.72 | 57% |
| Bentveld | 15 | $4,727 | $517.02 | 50% |
| Anzegem | 10 | $4,425 | $460.61 | 35% |
| Incourt | 13 | $4,412 | $303.48 | 52% |
| Zwanenburg | 22 | $4,111 | $255.87 | 61% |