Ouddorp Airbnb Market Analysis 2026: Short Term Rental Data & Vacation Rental Statistics in South Holland, Netherlands
Is Airbnb profitable in Ouddorp in 2026? Explore comprehensive Airbnb analytics for Ouddorp, South Holland, Netherlands to uncover income potential. This 2026 STR market report for Ouddorp, based on AirROI data from February 2025 to January 2026, reveals key trends in the niche market of 191 active listings.
Whether you're considering an Airbnb investment in Ouddorp, optimizing your existing vacation rental, or exploring rental arbitrage opportunities, understanding the Ouddorp Airbnb data is crucial. Leveraging the low regulation environment is key to maximizing your short term rental income potential. Let's dive into the specifics.
Key Ouddorp Airbnb Performance Metrics Overview
Monthly Airbnb Revenue Variations & Income Potential in Ouddorp (2026)
Understanding the monthly revenue variations for Airbnb listings in Ouddorp is key to maximizing your short term rental income potential. Seasonality significantly impacts earnings. Our analysis, based on data from the past 12 months, shows that the peak revenue month for STRs in Ouddorp is typically August, while January often presents the lowest earnings, highlighting opportunities for strategic pricing adjustments during shoulder and low seasons. Explore the typical Airbnb income in Ouddorp across different performance tiers:
- Best-in-class properties (Top 10%) achieve $6,089+ monthly, often utilizing dynamic pricing and superior guest experiences.
- Strong performing properties (Top 25%) earn $3,965 or more, indicating effective management and desirable locations/amenities.
- Typical properties (Median) generate around $2,502 per month, representing the average market performance.
- Entry-level properties (Bottom 25%) see earnings around $1,513, often with potential for optimization.
Average Monthly Airbnb Earnings Trend in Ouddorp
Ouddorp Airbnb Occupancy Rate Trends (2026)
Maximize your bookings by understanding the Ouddorp STR occupancy trends. Seasonal demand shifts significantly influence how often properties are booked. Typically, Augustsees the highest demand (peak season occupancy), while January experiences the lowest (low season). Effective strategies, like adjusting minimum stays or offering promotions, can boost occupancy during slower periods. Here's how different property tiers perform in Ouddorp:
- Best-in-class properties (Top 10%) achieve 77%+ occupancy, indicating high desirability and potentially optimized availability.
- Strong performing properties (Top 25%) maintain 61% or higher occupancy, suggesting good market fit and guest satisfaction.
- Typical properties (Median) have an occupancy rate around 42%.
- Entry-level properties (Bottom 25%) average 24% occupancy, potentially facing higher vacancy.
Average Monthly Occupancy Rate Trend in Ouddorp
Average Daily Rate (ADR) Airbnb Trends in Ouddorp (2026)
Effective short term rental pricing strategy in Ouddorp involves understanding monthly ADR fluctuations. The Average Daily Rate (ADR) for Airbnb in Ouddorp typically peaks in July and dips lowest during March. Leveraging Airbnb dynamic pricing tools or strategies based on this seasonality can significantly boost revenue. Here's a look at the typical nightly rates achieved:
- Best-in-class properties (Top 10%) command rates of $541+ per night, often due to premium features or locations.
- Strong performing properties (Top 25%) achieve nightly rates of $341 or more.
- Typical properties (Median) charge around $194 per night.
- Entry-level properties (Bottom 25%) earn around $140 per night.
Average Daily Rate (ADR) Trend by Month in Ouddorp
Get Live Ouddorp Market Intelligence 👇

Explore Real-time Analytics
Airbnb Seasonality Analysis & Trends in Ouddorp (2026)
Peak Season (August, July, June)
- Revenue averages $5,246 per month
- Occupancy rates average 61.5%
- Daily rates average $321
Shoulder Season
- Revenue averages $3,202 per month
- Occupancy maintains around 44.5%
- Daily rates hold near $278
Low Season (January, February, December)
- Revenue drops to average $1,670 per month
- Occupancy decreases to average 23.8%
- Daily rates adjust to average $258
Seasonality Insights for Ouddorp
- The Airbnb seasonality in Ouddorp shows highly seasonal trends requiring careful strategy. While the sections above show seasonal averages, it's also insightful to look at the extremes:
- During the high season, the absolute peak month showcases Ouddorp's highest earning potential, with monthly revenues capable of climbing to $5,744, occupancy reaching a high of 67.4%, and ADRs peaking at $326.
- Conversely, the slowest single month of the year, typically falling within the low season, marks the market's lowest point. In this month, revenue might dip to $1,347, occupancy could drop to 17.5%, and ADRs may adjust down to $248.
- Understanding both the seasonal averages and these monthly peaks and troughs in revenue, occupancy, and ADR is crucial for maximizing your Airbnb profit potential in Ouddorp.
Seasonal Strategies for Maximizing Profit
- Peak Season: Maximize revenue through premium pricing and potentially longer minimum stays. Ensure high availability.
- Low Season: Offer competitive pricing, special promotions (e.g., extended stay discounts), and flexible cancellation policies. Target off-season travelers like remote workers or budget-conscious guests.
- Shoulder Seasons: Implement dynamic pricing that balances peak and low rates. Target weekend travelers or specific events. Offer slightly more flexible terms than peak season.
- Regularly analyze your own performance against these Ouddorp seasonality benchmarks and adjust your pricing and availability strategy accordingly.
Best Areas for Airbnb Investment in Ouddorp (2026)
Exploring the top neighborhoods for short-term rentals in Ouddorp? This section highlights key areas, outlining why they are attractive for hosts and guests, along with notable local attractions. Consider these locations based on your target guest profile and investment strategy.
| Neighborhood / Area | Why Host Here? (Target Guests & Appeal) | Key Attractions & Landmarks |
|---|---|---|
| Ouddorp Beach | Famous for its beautiful sandy beaches and family-friendly atmosphere, making it perfect for vacationers looking for relaxation and seaside activities. | Ouddorp Beach, De Grevelingen, Ouddorpse Hals, North Beach, Watersports activities like kitesurfing and windsurfing |
| Ouddorp Village | A charming town center filled with local shops, cafes, and restaurants. A great spot for visitors wanting to experience Dutch culture and hospitality. | Village center, Local markets, Café De Drinkende Zwaan, St. Nicholas Church, Historic Windmill |
| Grevelingen Sea | Ideal for water sports enthusiasts and nature lovers, this area offers stunning views and a variety of outdoor activities, enhancing the guest experience. | Grevelingen Lake, sailing and kayaking opportunities, nature reserves, birdwatching spots, beachside cycling paths |
| Dunes of Ouddorp | Known for its natural beauty and serene environment. Perfect for guests seeking tranquility and outdoor adventures such as hiking and cycling. | Ouddorp Dunes National Park, dune trails, picnic areas, wildlife watching, beautiful landscapes |
| Land van Flakkee | Rich in natural landscapes and farmland, this area is great for guests interested in agricultural tourism and rural experiences. | Flakkee meadows, Farms visit tours, Cycling routes, Nature trails, Scenic views |
| Historic Sites | The area is home to several historical landmarks that attract visitors interested in the heritage and history of the region. | the Old Lighthouse, Historic Churches, Local Museums, Cultural Events, Heritage Trails |
| Nature Reserves | Surrounded by various nature reserves, this area is perfect for ecotourism and attracting nature lovers. | Kwade Hoek nature reserve, Vesting Haringvliet, Wildlife habitat, Walking trails, Waterfront areas |
| Campsites and Holiday Parks | Offers a range of accommodation options from luxury glamping to traditional camping, catering to different types of tourists. | Camping sites, Holiday parks with amenities, Recreational facilities, Outdoor swimming pools, Family-friendly attractions |
Understanding Airbnb License Requirements & STR Laws in Ouddorp (2026)
While Ouddorp, South Holland, Netherlands currently shows low STR regulations, specific Airbnb license requirements might still exist or change. Always verify the latest short term rental regulations and Airbnb license requirements directly with local government authorities for Ouddorp to ensure full compliance before hosting.
(Source: AirROI data, 2026, finding no licensed listings among those analyzed)
Top Performing Airbnb Properties in Ouddorp (2026)
Benchmark your potential! Explore examples of top-performing Airbnb properties in Ouddorpbased on Trailing Twelve Month (TTM) revenue. Analyze their characteristics, revenue, occupancy rate, and ADR to understand what drives success in this market.
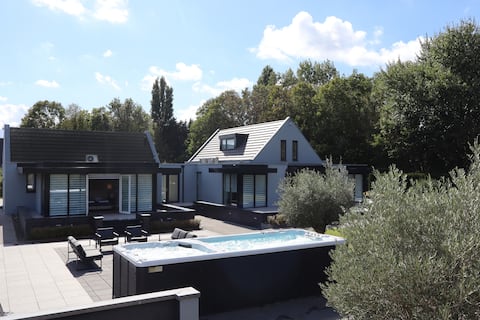
Landgoed Hermitage - Villa Minerva - XXL Jacuzzi
Entire Place • 6 bedrooms
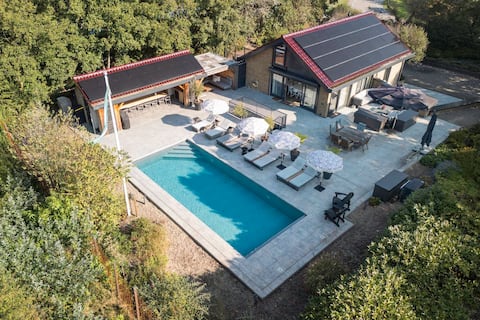
West Nieuwlandseweg 25A - Pool Villa Zilt & Zoet
Entire Place • 7 bedrooms

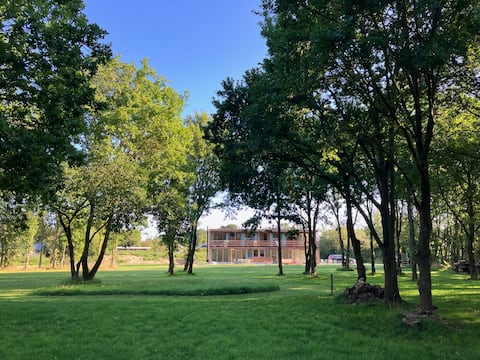
Group Stay: Former Police Station (4 bed rooms)
Entire Place • 4 bedrooms
Zeewaarts Ouddorp
Entire Place • 4 bedrooms

Panorama Penthouse VIP | 8 Pers. (Villa 54)
Entire Place • 4 bedrooms

Cozy home in Ouddorp with WiFi
Entire Place • 4 bedrooms
Note: Performance varies based on location, size, amenities, seasonality, and management quality. Data reflects the past 12 months.
Top Performing Airbnb Hosts in Ouddorp (2026)
Learn from the best! This table showcases top-performing Airbnb hosts in Ouddorp based on the number of properties managed and estimated total revenue over the past year. Analyze their scale and performance metrics.
| Host Name | Properties | Grossing Revenue | Stay Reviews | Avg Rating |
|---|---|---|---|---|
| Marian | 44 | $1,508,445 | 228 | 4.65/5.0 |
| Berend | 2 | $302,137 | 69 | 4.65/5.0 |
| Dennis | 9 | $291,347 | 107 | 4.90/5.0 |
| Martin En Hilde | 7 | $285,333 | 275 | 4.50/5.0 |
| Center Parcs Europe | 12 | $207,524 | 69 | 4.17/5.0 |
| Diana | 4 | $124,714 | 35 | 4.61/5.0 |
| Joost | 1 | $112,800 | 21 | 5.00/5.0 |
| Alice | 3 | $88,972 | 161 | 4.71/5.0 |
| Novasol | 1 | $88,535 | 6 | 3.67/5.0 |
| Ingrid | 2 | $81,043 | 196 | 4.92/5.0 |
Analyzing the strategies of top hosts, such as their property selection, pricing, and guest communication, can offer valuable lessons for optimizing your own Airbnb operations in Ouddorp.
Dive Deeper: Advanced Ouddorp STR Market Data (2026)
Ready to unlock more insights? AirROI provides access to advanced metrics and comprehensive Airbnb data for Ouddorp. Explore detailed analytics beyond this report to refine your investment strategy, optimize pricing, and maximize your vacation rental profits.
Explore Advanced MetricsOuddorp Short-Term Rental Market Composition (2026): Property & Room Types
Room Type Distribution
Property Type Distribution
Market Composition Insights for Ouddorp
- The Ouddorp Airbnb market composition is heavily skewed towards Entire Home/Apt listings, which make up 94.2% of the 191 active rentals. This indicates strong guest preference for privacy and space.
- Looking at the property type distribution in Ouddorp, House properties are the most common (78%), reflecting the local real estate landscape.
- Houses represent a significant 78% portion, catering likely to families or larger groups.
- The presence of 7.3% Hotel/Boutique listings indicates integration with traditional hospitality.
- Smaller segments like others (combined 2.1%) offer potential for unique stay experiences.
Ouddorp Airbnb Room Capacity Analysis (2026): Bedroom Distribution
Distribution of Listings by Number of Bedrooms
Room Capacity Insights for Ouddorp
- The dominant room capacity in Ouddorp is 3 bedrooms listings, making up 38.7% of the market. This suggests a strong demand for properties suitable for families or small groups.
- Together, 3 bedrooms and 2 bedrooms properties represent 68.0% of the active Airbnb listings in Ouddorp, indicating a high concentration in these sizes.
- A significant 52.3% of listings offer 3+ bedrooms, catering to larger groups and families seeking more space in Ouddorp.
Ouddorp Vacation Rental Guest Capacity Trends (2026)
Distribution of Listings by Guest Capacity
Guest Capacity Insights for Ouddorp
- The most common guest capacity trend in Ouddorp vacation rentals is listings accommodating 4 guests (31.9%). This suggests the primary traveler segment is likely small families or groups.
- Properties designed for 4 guests and 6 guests dominate the Ouddorp STR market, accounting for 60.2% of listings.
- 43.0% of properties accommodate 6+ guests, serving the market segment for larger families or group travel in Ouddorp.
- On average, properties in Ouddorp are equipped to host 4.9 guests.
Ouddorp Airbnb Booking Patterns (2026): Available vs. Booked Days
Available Days Distribution
Booked Days Distribution
Booking Pattern Insights for Ouddorp
- The most common availability pattern in Ouddorp falls within the 271-366 days range, representing 42.9% of listings. This suggests many properties have significant open periods on their calendars.
- Approximately 75.9% of listings show high availability (181+ days open annually), indicating potential for increased bookings or specific owner usage patterns.
- For booked days, the 91-180 days range is most frequent in Ouddorp (34.6%), reflecting common guest stay durations or potential owner blocking patterns.
- A notable 25.7% of properties secure long booking periods (181+ days booked per year), highlighting successful long-term rental strategies or significant owner usage.
Ouddorp Airbnb Minimum Stay Requirements Analysis
Distribution of Listings by Minimum Night Requirement
1 Night
39 listings
20.4% of total
2 Nights
18 listings
9.4% of total
3 Nights
11 listings
5.8% of total
4-6 Nights
22 listings
11.5% of total
7-29 Nights
2 listings
1% of total
30+ Nights
99 listings
51.8% of total
Key Insights
- The most prevalent minimum stay requirement in Ouddorp is 30+ Nights, adopted by 51.8% of listings. This highlights the market's preference for longer commitments.
- A significant segment (51.8%) caters to monthly stays (30+ nights) in Ouddorp, pointing to opportunities in the extended-stay market.
Recommendations
- Align with the market by considering a 30+ Nights minimum stay, as 51.8% of Ouddorp hosts use this setting.
- If feasible, allowing 1-night stays, especially midweek or during low season, could capture last-minute bookings, as only 20.4% currently do.
- Explore offering discounts for stays of 30+ nights to attract the 51.8% of the market seeking extended stays.
- Adjust minimum nights based on seasonality – potentially shorter during low season and longer during peak demand periods in Ouddorp.
Ouddorp Airbnb Cancellation Policy Trends Analysis (2026)
Super Strict 60 Days
8 listings
4.2% of total
Limited
46 listings
24.2% of total
Flexible
16 listings
8.4% of total
Moderate
34 listings
17.9% of total
Firm
79 listings
41.6% of total
Strict
7 listings
3.7% of total
Cancellation Policy Insights for Ouddorp
- The prevailing Airbnb cancellation policy trend in Ouddorp is Firm, used by 41.6% of listings.
- There's a relatively balanced mix between guest-friendly (26.3%) and stricter (45.3%) policies, offering choices for different guest needs.
- Strict cancellation policies are quite rare (3.7%), potentially making listings with this policy less competitive unless justified by high demand or property type.
Recommendations for Hosts
- Consider adopting a Firm policy to align with the 41.6% market standard in Ouddorp.
- Using a Strict policy might deter some guests, as only 3.7% of listings use it. Evaluate if potential revenue protection outweighs possible lower booking rates.
- Regularly review your cancellation policy against competitors and market demand shifts in Ouddorp.
Ouddorp STR Booking Lead Time Analysis (2026)
Average Booking Lead Time by Month
Booking Lead Time Insights for Ouddorp
- The overall average booking lead time for vacation rentals in Ouddorp is 74 days.
- Guests book furthest in advance for stays during June (average 112 days), likely coinciding with peak travel demand or local events.
- The shortest booking windows occur for stays in February (average 36 days), indicating more last-minute travel plans during this time.
- Seasonally, Summer (107 days avg.) sees the longest lead times, while Winter (51 days avg.) has the shortest, reflecting typical travel planning cycles.
Recommendations for Hosts
- Use the overall average lead time (74 days) as a baseline for your pricing and availability strategy in Ouddorp.
- For June stays, consider implementing length-of-stay discounts or slightly higher rates for bookings made less than 112 days out to capitalize on advance planning.
- Target marketing efforts for the Summer season well in advance (at least 107 days) to capture early planners.
- Monitor your own booking lead times against these Ouddorp averages to identify opportunities for dynamic pricing adjustments.
Popular & Essential Airbnb Amenities in Ouddorp (2026)
Amenity Prevalence
Amenity Insights for Ouddorp
- Popular amenities like Heating, Wifi, TV are common but not universal. Offering these can provide a competitive edge.
- Warning: Wifi is not universally provided but is considered essential globally. Ensure reliable Wifi is offered.
Recommendations for Hosts
- Consider adding popular differentiators like Heating or Wifi to increase appeal.
- Highlight unique or less common amenities you offer (e.g., hot tub, dedicated workspace, EV charger) in your listing description and photos.
- Regularly check competitor amenities in Ouddorp to stay competitive.
Ouddorp Airbnb Guest Demographics & Profile Analysis (2026)
Guest Profile Summary for Ouddorp
- The typical guest profile for Airbnb in Ouddorp consists of predominantly international visitors (77%), with top international origins including Netherlands, typically belonging to the Post-2000s (Gen Z/Alpha) group (50%), primarily speaking English or German.
- Domestic travelers account for 23.2% of guests.
- Key international markets include Germany (59.1%) and Netherlands (23.2%).
- Top languages spoken are English (38.5%) followed by German (30.5%).
- A significant demographic segment is the Post-2000s (Gen Z/Alpha) group, representing 50% of guests.
Recommendations for Hosts
- Focus marketing internationally, particularly towards travelers from Netherlands.
- Tailor amenities and listing descriptions to appeal to the dominant Post-2000s (Gen Z/Alpha) demographic (e.g., highlight fast WiFi, smart home features, local guides).
- Highlight unique local experiences or amenities relevant to the primary guest profile.
- Consider seasonal promotions aligned with peak travel times for key origin markets.
Nearby Short-Term Rental Market Comparison
How does the Ouddorp Airbnb market stack up against its neighbors? Compare key performance metrics like average monthly revenue, ADR, and occupancy rates in surrounding areas to understand the broader regional STR landscape.
| Market | Active Properties | Monthly Revenue | Daily Rate | Avg. Occupancy |
|---|---|---|---|---|
| Raamsdonksveer | 16 | $7,756 | $736.17 | 38% |
| Kockengen | 11 | $6,027 | $485.77 | 53% |
| Lo-Reninge | 13 | $5,989 | $454.03 | 42% |
| Mont-de-l'Enclus | 10 | $5,398 | $407.81 | 36% |
| Merksplas | 12 | $5,367 | $356.64 | 43% |
| Zerkegem | 10 | $4,846 | $437.72 | 57% |
| Bentveld | 15 | $4,727 | $517.02 | 50% |
| Anzegem | 10 | $4,425 | $460.61 | 35% |
| Incourt | 13 | $4,412 | $303.48 | 52% |
| Zwanenburg | 22 | $4,111 | $255.87 | 61% |