Uitdam Airbnb Market Analysis 2025: Short Term Rental Data & Vacation Rental Statistics in North Holland, Netherlands
Is Airbnb profitable in Uitdam in 2025? Explore comprehensive Airbnb analytics for Uitdam, North Holland, Netherlands to uncover income potential. This 2025 STR market report for Uitdam, based on AirROI data from September 2024 to August 2025, reveals key trends in the niche market of 19 active listings.
Whether you're considering an Airbnb investment in Uitdam, optimizing your existing vacation rental, or exploring rental arbitrage opportunities, understanding the Uitdam Airbnb data is crucial. Leveraging the low regulation environment is key to maximizing your short term rental income potential. Let's dive into the specifics.
Key Uitdam Airbnb Performance Metrics Overview
Monthly Airbnb Revenue Variations & Income Potential in Uitdam (2025)
Understanding the monthly revenue variations for Airbnb listings in Uitdam is key to maximizing your short term rental income potential. Seasonality significantly impacts earnings. Our analysis, based on data from the past 12 months, shows that the peak revenue month for STRs in Uitdam is typically August, while February often presents the lowest earnings, highlighting opportunities for strategic pricing adjustments during shoulder and low seasons. Explore the typical Airbnb income in Uitdam across different performance tiers:
- Best-in-class properties (Top 10%) achieve $3,915+ monthly, often utilizing dynamic pricing and superior guest experiences.
- Strong performing properties (Top 25%) earn $3,015 or more, indicating effective management and desirable locations/amenities.
- Typical properties (Median) generate around $1,756 per month, representing the average market performance.
- Entry-level properties (Bottom 25%) see earnings around $839, often with potential for optimization.
Average Monthly Airbnb Earnings Trend in Uitdam
Uitdam Airbnb Occupancy Rate Trends (2025)
Maximize your bookings by understanding the Uitdam STR occupancy trends. Seasonal demand shifts significantly influence how often properties are booked. Typically, Aprilsees the highest demand (peak season occupancy), while February experiences the lowest (low season). Effective strategies, like adjusting minimum stays or offering promotions, can boost occupancy during slower periods. Here's how different property tiers perform in Uitdam:
- Best-in-class properties (Top 10%) achieve 39%+ occupancy, indicating high desirability and potentially optimized availability.
- Strong performing properties (Top 25%) maintain 23% or higher occupancy, suggesting good market fit and guest satisfaction.
- Typical properties (Median) have an occupancy rate around 15%.
- Entry-level properties (Bottom 25%) average 8% occupancy, potentially facing higher vacancy.
Average Monthly Occupancy Rate Trend in Uitdam
Average Daily Rate (ADR) Airbnb Trends in Uitdam (2025)
Effective short term rental pricing strategy in Uitdam involves understanding monthly ADR fluctuations. The Average Daily Rate (ADR) for Airbnb in Uitdam typically peaks in August and dips lowest during November. Leveraging Airbnb dynamic pricing tools or strategies based on this seasonality can significantly boost revenue. Here's a look at the typical nightly rates achieved:
- Best-in-class properties (Top 10%) command rates of $696+ per night, often due to premium features or locations.
- Strong performing properties (Top 25%) achieve nightly rates of $594 or more.
- Typical properties (Median) charge around $481 per night.
- Entry-level properties (Bottom 25%) earn around $332 per night.
Average Daily Rate (ADR) Trend by Month in Uitdam
Get Live Uitdam Market Intelligence 👇

Explore Real-time Analytics
Airbnb Seasonality Analysis & Trends in Uitdam (2025)
Peak Season (August, April, October)
- Revenue averages $3,225 per month
- Occupancy rates average 26.5%
- Daily rates average $527
Shoulder Season
- Revenue averages $2,041 per month
- Occupancy maintains around 19.7%
- Daily rates hold near $477
Low Season (January, February, November)
- Revenue drops to average $955 per month
- Occupancy decreases to average 8.3%
- Daily rates adjust to average $364
Seasonality Insights for Uitdam
- The Airbnb seasonality in Uitdam shows highly seasonal trends requiring careful strategy. While the sections above show seasonal averages, it's also insightful to look at the extremes:
- During the high season, the absolute peak month showcases Uitdam's highest earning potential, with monthly revenues capable of climbing to $3,388, occupancy reaching a high of 30.5%, and ADRs peaking at $633.
- Conversely, the slowest single month of the year, typically falling within the low season, marks the market's lowest point. In this month, revenue might dip to $350, occupancy could drop to 4.5%, and ADRs may adjust down to $351.
- Understanding both the seasonal averages and these monthly peaks and troughs in revenue, occupancy, and ADR is crucial for maximizing your Airbnb profit potential in Uitdam.
Seasonal Strategies for Maximizing Profit
- Peak Season: Maximize revenue through premium pricing and potentially longer minimum stays. Ensure high availability.
- Low Season: Offer competitive pricing, special promotions (e.g., extended stay discounts), and flexible cancellation policies. Target off-season travelers like remote workers or budget-conscious guests.
- Shoulder Seasons: Implement dynamic pricing that balances peak and low rates. Target weekend travelers or specific events. Offer slightly more flexible terms than peak season.
- Regularly analyze your own performance against these Uitdam seasonality benchmarks and adjust your pricing and availability strategy accordingly.
Best Areas for Airbnb Investment in Uitdam (2025)
Exploring the top neighborhoods for short-term rentals in Uitdam? This section highlights key areas, outlining why they are attractive for hosts and guests, along with notable local attractions. Consider these locations based on your target guest profile and investment strategy.
| Neighborhood / Area | Why Host Here? (Target Guests & Appeal) | Key Attractions & Landmarks |
|---|---|---|
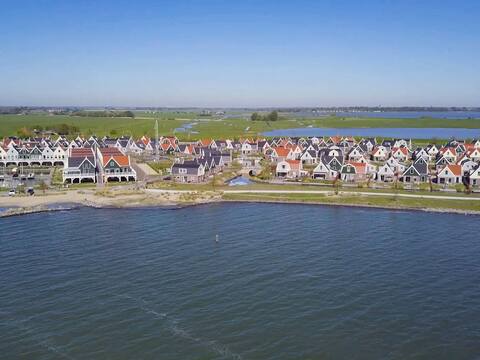
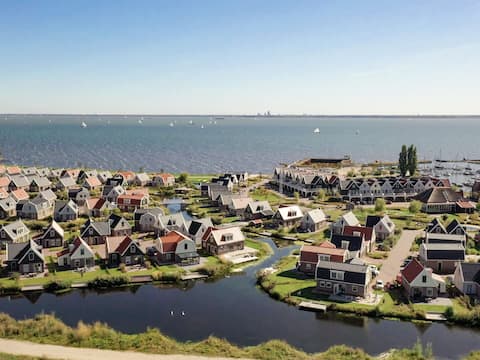
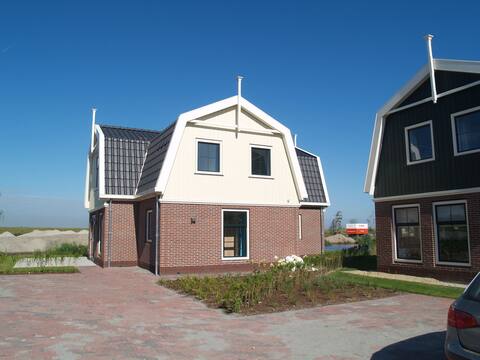
| Uitdam Village | A quiet and charming village located by the IJmeer, perfect for travelers seeking a peaceful getaway. | IJmeer Lake, Recreation area Waterlands, Nearby Amsterdam's attractions, Local restaurants, Biking routes through nature |
| Waterland Region | Known for its picturesque landscapes and traditional Dutch villages, this area attracts both nature lovers and tourists. | The Waterland Heritage, Wormerland, Historical windmills, Biking and walking trails, Cultural events |
| Amsterdam North | Just across the IJ River, Amsterdam North has a burgeoning arts scene and offers a unique perspective of Amsterdam. | Eye Filmmuseum, NDSM Wharf, Amsterdam North Ferry, Cultural festivals, Vibrant local restaurants |
| Durgerdam | A small village with direct access to the IJsselmeer, ideal for water sports enthusiasts and nature lovers. | IJsselmeer beach, Scenic walking trails, Traditional Dutch houses, Water sports facilities, Great restaurants along the water |
| Zunderdorp | A charming rural village with beautiful views and a peaceful atmosphere, great for a rural escape from city life. | Authentic Dutch countryside, Local farms, Biking routes, Scenic canals, Restaurants featuring local produce |
| Broek in Waterland | Famous for its historic buildings and natural beauty, offering a mix of cultural attractions and outdoor activities. | Ancient church, Historical buildings, Rural landscape, Canal tours, Local art galleries |
| Holysloot | A small village with a tranquil environment, attractive for guests looking for serenity and nature. | Nature reserves, Canal activities, Scenic views, Outdoor picnic spots, Biking paths |
| Amsterdam City Center | While a bit further, Amsterdam's city center is a prime location, drawing tourists to famous sights and nightlife. | Rijksmuseum, Van Gogh Museum, Dam Square, Canal cruises, Vibrant nightlife |
Understanding Airbnb License Requirements & STR Laws in Uitdam (2025)
While Uitdam, North Holland, Netherlands currently shows low STR regulations, specific Airbnb license requirements might still exist or change. Always verify the latest short term rental regulations and Airbnb license requirements directly with local government authorities for Uitdam to ensure full compliance before hosting.
(Source: AirROI data, 2025, finding no licensed listings among those analyzed)
Top Performing Airbnb Properties in Uitdam (2025)
Benchmark your potential! Explore examples of top-performing Airbnb properties in Uitdambased on Trailing Twelve Month (TTM) revenue. Analyze their characteristics, revenue, occupancy rate, and ADR to understand what drives success in this market.
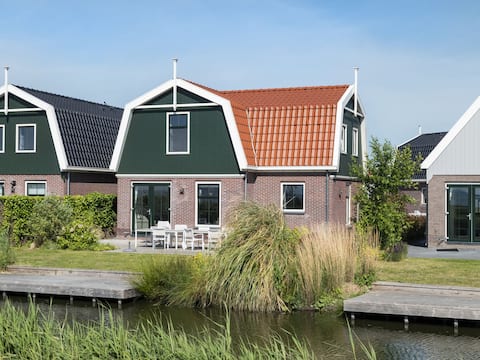
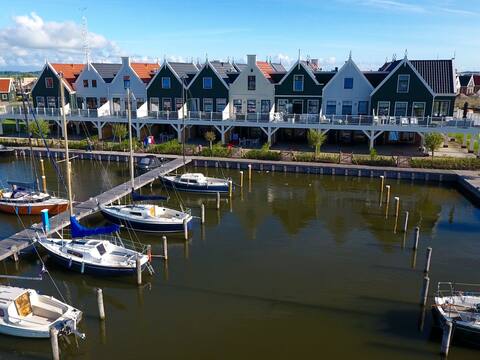
Nice holiday home on the Markermeer
Entire Place • 3 bedrooms
Spacious holiday home on the Markermeer
Entire Place • 5 bedrooms
Holiday home with sauna near Amsterdam
Entire Place • 6 bedrooms
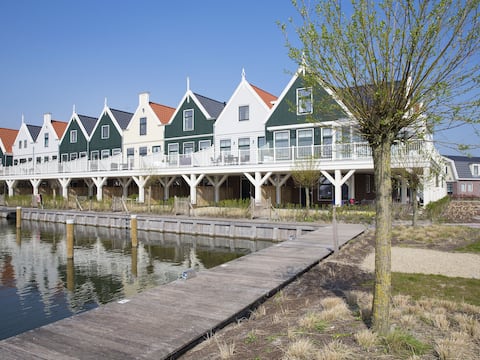
Spacious holiday home near Amsterdam
Entire Place • 4 bedrooms
Holiday home on the Markermeer near Amsterdam
Entire Place • 6 bedrooms
Spacious holiday home near Amsterdam
Entire Place • 2 bedrooms
Note: Performance varies based on location, size, amenities, seasonality, and management quality. Data reflects the past 12 months.
Top Performing Airbnb Hosts in Uitdam (2025)
Learn from the best! This table showcases top-performing Airbnb hosts in Uitdam based on the number of properties managed and estimated total revenue over the past year. Analyze their scale and performance metrics.
| Host Name | Properties | Grossing Revenue | Stay Reviews | Avg Rating |
|---|---|---|---|---|
| Diana - BELVILLA | 14 | $188,862 | 95 | 3.74/5.0 |
| Liesbeth | 2 | $12,407 | 12 | 5.00/5.0 |
| Bas | 1 | $8,925 | 3 | 5.00/5.0 |
| BoresMeike | 1 | $6,802 | 5 | 4.20/5.0 |
| Host #110572758 | 1 | $4,067 | 2 | Not Rated |
Analyzing the strategies of top hosts, such as their property selection, pricing, and guest communication, can offer valuable lessons for optimizing your own Airbnb operations in Uitdam.
Dive Deeper: Advanced Uitdam STR Market Data (2025)
Ready to unlock more insights? AirROI provides access to advanced metrics and comprehensive Airbnb data for Uitdam. Explore detailed analytics beyond this report to refine your investment strategy, optimize pricing, and maximize your vacation rental profits.
Explore Advanced MetricsUitdam Short-Term Rental Market Composition (2025): Property & Room Types
Room Type Distribution
Property Type Distribution
Market Composition Insights for Uitdam
- The Uitdam Airbnb market composition is heavily skewed towards Entire Home/Apt listings, which make up 89.5% of the 19 active rentals. This indicates strong guest preference for privacy and space.
- Looking at the property type distribution in Uitdam, House properties are the most common (68.4%), reflecting the local real estate landscape.
- Houses represent a significant 68.4% portion, catering likely to families or larger groups.
- The presence of 10.5% Hotel/Boutique listings indicates integration with traditional hospitality.
Uitdam Airbnb Room Capacity Analysis (2025): Bedroom Distribution
Distribution of Listings by Number of Bedrooms
Room Capacity Insights for Uitdam
- The dominant room capacity in Uitdam is 5+ bedrooms listings, making up 31.6% of the market. This suggests a strong demand for properties suitable for families or small groups.
- Together, 5+ bedrooms and 3 bedrooms properties represent 63.2% of the active Airbnb listings in Uitdam, indicating a high concentration in these sizes.
- A significant 79.0% of listings offer 3+ bedrooms, catering to larger groups and families seeking more space in Uitdam.
Uitdam Vacation Rental Guest Capacity Trends (2025)
Distribution of Listings by Guest Capacity
Guest Capacity Insights for Uitdam
- The most common guest capacity trend in Uitdam vacation rentals is listings accommodating 8+ guests (47.4%). This suggests the primary traveler segment is likely larger groups.
- Properties designed for 8+ guests and 6 guests dominate the Uitdam STR market, accounting for 73.7% of listings.
- 73.7% of properties accommodate 6+ guests, serving the market segment for larger families or group travel in Uitdam.
- On average, properties in Uitdam are equipped to host 6.1 guests.
Uitdam Airbnb Booking Patterns (2025): Available vs. Booked Days
Available Days Distribution
Booked Days Distribution
Booking Pattern Insights for Uitdam
- The most common availability pattern in Uitdam falls within the 271-366 days range, representing 100% of listings. This suggests many properties have significant open periods on their calendars.
- Approximately 100.0% of listings show high availability (181+ days open annually), indicating potential for increased bookings or specific owner usage patterns.
- For booked days, the 1-30 days range is most frequent in Uitdam (57.9%), reflecting common guest stay durations or potential owner blocking patterns.
Uitdam Airbnb Minimum Stay Requirements Analysis
Distribution of Listings by Minimum Night Requirement
1 Night
4 listings
26.7% of total
2 Nights
3 listings
20% of total
7-29 Nights
3 listings
20% of total
30+ Nights
5 listings
33.3% of total
Key Insights
- The most prevalent minimum stay requirement in Uitdam is 30+ Nights, adopted by 33.3% of listings. This highlights the market's preference for longer commitments.
- A significant segment (33.3%) caters to monthly stays (30+ nights) in Uitdam, pointing to opportunities in the extended-stay market.
Recommendations
- Align with the market by considering a 30+ Nights minimum stay, as 33.3% of Uitdam hosts use this setting.
- If feasible, allowing 1-night stays, especially midweek or during low season, could capture last-minute bookings, as only 26.7% currently do.
- Explore offering discounts for stays of 30+ nights to attract the 33.3% of the market seeking extended stays.
- Adjust minimum nights based on seasonality – potentially shorter during low season and longer during peak demand periods in Uitdam.
Uitdam Airbnb Cancellation Policy Trends Analysis (2025)
Flexible
1 listings
8.3% of total
Moderate
2 listings
16.7% of total
Firm
2 listings
16.7% of total
Strict
7 listings
58.3% of total
Cancellation Policy Insights for Uitdam
- The prevailing Airbnb cancellation policy trend in Uitdam is Strict, used by 58.3% of listings.
- A majority (75.0%) of hosts in Uitdam utilize Firm or Strict policies, indicating a market where hosts prioritize booking security.
Recommendations for Hosts
- Consider adopting a Strict policy to align with the 58.3% market standard in Uitdam.
- With 58.3% using Strict terms, this is a viable option in Uitdam, particularly for high-value properties or during peak demand periods.
- Regularly review your cancellation policy against competitors and market demand shifts in Uitdam.
Uitdam STR Booking Lead Time Analysis (2025)
Average Booking Lead Time by Month
Booking Lead Time Insights for Uitdam
- The overall average booking lead time for vacation rentals in Uitdam is 50 days.
- Guests book furthest in advance for stays during December (average 111 days), likely coinciding with peak travel demand or local events.
- The shortest booking windows occur for stays in February (average 1 days), indicating more last-minute travel plans during this time.
- Seasonally, Summer (81 days avg.) sees the longest lead times, while Spring (38 days avg.) has the shortest, reflecting typical travel planning cycles.
Recommendations for Hosts
- Use the overall average lead time (50 days) as a baseline for your pricing and availability strategy in Uitdam.
- For December stays, consider implementing length-of-stay discounts or slightly higher rates for bookings made less than 111 days out to capitalize on advance planning.
- During February, focus on last-minute booking availability and promotions, as guests book with very short notice (1 days avg.).
- Target marketing efforts for the Summer season well in advance (at least 81 days) to capture early planners.
- Monitor your own booking lead times against these Uitdam averages to identify opportunities for dynamic pricing adjustments.
Popular & Essential Airbnb Amenities in Uitdam (2025)
Amenity Prevalence
Amenity Insights for Uitdam
- Essential amenities in Uitdam that guests expect include: Heating, Wifi, TV. Lacking these (any) could significantly impact bookings.
- Popular amenities like Hangers, Coffee maker, Kitchen are common but not universal. Offering these can provide a competitive edge.
Recommendations for Hosts
- Ensure your listing includes all essential amenities for Uitdam: Heating, Wifi, TV.
- Consider adding popular differentiators like Hangers or Coffee maker to increase appeal.
- Highlight unique or less common amenities you offer (e.g., hot tub, dedicated workspace, EV charger) in your listing description and photos.
- Regularly check competitor amenities in Uitdam to stay competitive.
Uitdam Airbnb Guest Demographics & Profile Analysis (2025)
Guest Profile Summary for Uitdam
- The typical guest profile for Airbnb in Uitdam consists of predominantly international visitors (91%), with top international origins including Norway, typically belonging to the Post-2000s (Gen Z/Alpha) group (50%), primarily speaking English or German.
- Domestic travelers account for 9.1% of guests.
- Key international markets include Germany (36.4%) and Norway (9.1%).
- Top languages spoken are English (46.2%) followed by German (23.1%).
- A significant demographic segment is the Post-2000s (Gen Z/Alpha) group, representing 50% of guests.
Recommendations for Hosts
- Focus marketing internationally, particularly towards travelers from Norway.
- Tailor amenities and listing descriptions to appeal to the dominant Post-2000s (Gen Z/Alpha) demographic (e.g., highlight fast WiFi, smart home features, local guides).
- Highlight unique local experiences or amenities relevant to the primary guest profile.
- Consider seasonal promotions aligned with peak travel times for key origin markets.
Nearby Short-Term Rental Market Comparison
How does the Uitdam Airbnb market stack up against its neighbors? Compare key performance metrics like average monthly revenue, ADR, and occupancy rates in surrounding areas to understand the broader regional STR landscape.
| Market | Active Properties | Monthly Revenue | Daily Rate | Avg. Occupancy |
|---|---|---|---|---|
| Kockengen | 12 | $6,953 | $439.20 | 57% |
| Raamsdonksveer | 15 | $6,670 | $680.88 | 41% |
| Merksplas | 12 | $5,582 | $344.86 | 46% |
| Haghorst | 11 | $5,533 | $462.57 | 40% |
| Bentveld | 14 | $4,725 | $434.62 | 54% |
| Baarlo | 22 | $4,600 | $307.18 | 50% |
| Wormer | 10 | $4,218 | $230.81 | 61% |
| Oud Ade | 18 | $4,153 | $280.17 | 53% |
| Zwanenburg | 21 | $3,998 | $225.17 | 67% |
| Aerdenhout | 21 | $3,856 | $658.55 | 48% |