Sint Maartensvlotbrug Airbnb Market Analysis 2026: Short Term Rental Data & Vacation Rental Statistics in North Holland, Netherlands
Is Airbnb profitable in Sint Maartensvlotbrug in 2026? Explore comprehensive Airbnb analytics for Sint Maartensvlotbrug, North Holland, Netherlands to uncover income potential. This 2026 STR market report for Sint Maartensvlotbrug, based on AirROI data from February 2025 to January 2026, reveals key trends in the niche market of 156 active listings.
Whether you're considering an Airbnb investment in Sint Maartensvlotbrug, optimizing your existing vacation rental, or exploring rental arbitrage opportunities, understanding the Sint Maartensvlotbrug Airbnb data is crucial. Leveraging the low regulation environment is key to maximizing your short term rental income potential. Let's dive into the specifics.
Key Sint Maartensvlotbrug Airbnb Performance Metrics Overview
Monthly Airbnb Revenue Variations & Income Potential in Sint Maartensvlotbrug (2026)
Understanding the monthly revenue variations for Airbnb listings in Sint Maartensvlotbrug is key to maximizing your short term rental income potential. Seasonality significantly impacts earnings. Our analysis, based on data from the past 12 months, shows that the peak revenue month for STRs in Sint Maartensvlotbrug is typically August, while January often presents the lowest earnings, highlighting opportunities for strategic pricing adjustments during shoulder and low seasons. Explore the typical Airbnb income in Sint Maartensvlotbrug across different performance tiers:
- Best-in-class properties (Top 10%) achieve $3,771+ monthly, often utilizing dynamic pricing and superior guest experiences.
- Strong performing properties (Top 25%) earn $2,730 or more, indicating effective management and desirable locations/amenities.
- Typical properties (Median) generate around $1,683 per month, representing the average market performance.
- Entry-level properties (Bottom 25%) see earnings around $816, often with potential for optimization.
Average Monthly Airbnb Earnings Trend in Sint Maartensvlotbrug
Sint Maartensvlotbrug Airbnb Occupancy Rate Trends (2026)
Maximize your bookings by understanding the Sint Maartensvlotbrug STR occupancy trends. Seasonal demand shifts significantly influence how often properties are booked. Typically, Augustsees the highest demand (peak season occupancy), while January experiences the lowest (low season). Effective strategies, like adjusting minimum stays or offering promotions, can boost occupancy during slower periods. Here's how different property tiers perform in Sint Maartensvlotbrug:
- Best-in-class properties (Top 10%) achieve 76%+ occupancy, indicating high desirability and potentially optimized availability.
- Strong performing properties (Top 25%) maintain 57% or higher occupancy, suggesting good market fit and guest satisfaction.
- Typical properties (Median) have an occupancy rate around 32%.
- Entry-level properties (Bottom 25%) average 15% occupancy, potentially facing higher vacancy.
Average Monthly Occupancy Rate Trend in Sint Maartensvlotbrug
Average Daily Rate (ADR) Airbnb Trends in Sint Maartensvlotbrug (2026)
Effective short term rental pricing strategy in Sint Maartensvlotbrug involves understanding monthly ADR fluctuations. The Average Daily Rate (ADR) for Airbnb in Sint Maartensvlotbrug typically peaks in July and dips lowest during February. Leveraging Airbnb dynamic pricing tools or strategies based on this seasonality can significantly boost revenue. Here's a look at the typical nightly rates achieved:
- Best-in-class properties (Top 10%) command rates of $254+ per night, often due to premium features or locations.
- Strong performing properties (Top 25%) achieve nightly rates of $192 or more.
- Typical properties (Median) charge around $158 per night.
- Entry-level properties (Bottom 25%) earn around $133 per night.
Average Daily Rate (ADR) Trend by Month in Sint Maartensvlotbrug
Get Live Sint Maartensvlotbrug Market Intelligence 👇

Explore Real-time Analytics
Airbnb Seasonality Analysis & Trends in Sint Maartensvlotbrug (2026)
Peak Season (August, July, April)
- Revenue averages $3,098 per month
- Occupancy rates average 53.2%
- Daily rates average $189
Shoulder Season
- Revenue averages $1,937 per month
- Occupancy maintains around 37.5%
- Daily rates hold near $176
Low Season (January, February, December)
- Revenue drops to average $1,115 per month
- Occupancy decreases to average 21.1%
- Daily rates adjust to average $162
Seasonality Insights for Sint Maartensvlotbrug
- The Airbnb seasonality in Sint Maartensvlotbrug shows highly seasonal trends requiring careful strategy. While the sections above show seasonal averages, it's also insightful to look at the extremes:
- During the high season, the absolute peak month showcases Sint Maartensvlotbrug's highest earning potential, with monthly revenues capable of climbing to $3,645, occupancy reaching a high of 57.9%, and ADRs peaking at $201.
- Conversely, the slowest single month of the year, typically falling within the low season, marks the market's lowest point. In this month, revenue might dip to $785, occupancy could drop to 15.0%, and ADRs may adjust down to $149.
- Understanding both the seasonal averages and these monthly peaks and troughs in revenue, occupancy, and ADR is crucial for maximizing your Airbnb profit potential in Sint Maartensvlotbrug.
Seasonal Strategies for Maximizing Profit
- Peak Season: Maximize revenue through premium pricing and potentially longer minimum stays. Ensure high availability.
- Low Season: Offer competitive pricing, special promotions (e.g., extended stay discounts), and flexible cancellation policies. Target off-season travelers like remote workers or budget-conscious guests.
- Shoulder Seasons: Implement dynamic pricing that balances peak and low rates. Target weekend travelers or specific events. Offer slightly more flexible terms than peak season.
- Regularly analyze your own performance against these Sint Maartensvlotbrug seasonality benchmarks and adjust your pricing and availability strategy accordingly.
Best Areas for Airbnb Investment in Sint Maartensvlotbrug (2026)
Exploring the top neighborhoods for short-term rentals in Sint Maartensvlotbrug? This section highlights key areas, outlining why they are attractive for hosts and guests, along with notable local attractions. Consider these locations based on your target guest profile and investment strategy.
| Neighborhood / Area | Why Host Here? (Target Guests & Appeal) | Key Attractions & Landmarks |
|---|---|---|
| Sint Maartensvlotbrug Center | The heart of Sint Maartensvlotbrug, offering easy access to local shops and restaurants. Ideal for guests looking to experience local culture and community life. | Local shops, Restaurants, Cafés, Community events, Parks |
| North Sea Beach | Proximity to the stunning North Sea beach makes it popular for tourists in the summer. Guests can enjoy beach activities and scenic views. | North Sea beach, Dune pathways, Beach sports, Sunbathing, Biking trails |
| Callantsoog | A nearby village known for its charming atmosphere and beautiful sandy beaches. Attracts families and beachgoers seeking a peaceful retreat. | Callantsoog beach, Beach clubs, Nature walks, Local market, Cycling routes |
| Egmond aan Zee | A coastal village with a rich history and vibrant seaside promenade. Great for summer vacations and off-season getaways. | Egmond aan Zee beach, Kitesurfing, Local seafood restaurants, Historic lighthouse, Beach front activities |
| Alkmaar | A historic city famous for its cheese market and beautiful canals. Perfect for guests interested in Dutch culture and history. | Alkmaar cheese market, St. Lawrence Church, Canal tours, Museums, Shopping in the old town |
| Zandvoort | Known for its famous beaches and the Zandvoort Circuit, this area attracts motorsports fans and beach lovers alike. | Zandvoort beach, Circuit Zandvoort, Beach clubs, Nature reserves, Water sports |
| Haarlem | A vibrant city with rich history, art, and architecture. It's ideal for guests who want a mix of urban excitement and cultural exploration. | Haarlem Windmill, Frans Hals Museum, Historic city center, Shopping streets, Art galleries |
| Bergen | Known for its artistic heritage and beautiful forests. Popular among those seeking relaxation and nature. | Bergen art galleries, Forests, Biking and walking paths, Art festivals, Charming village atmosphere |
Understanding Airbnb License Requirements & STR Laws in Sint Maartensvlotbrug (2026)
While Sint Maartensvlotbrug, North Holland, Netherlands currently shows low STR regulations, specific Airbnb license requirements might still exist or change. Always verify the latest short term rental regulations and Airbnb license requirements directly with local government authorities for Sint Maartensvlotbrug to ensure full compliance before hosting.
(Source: AirROI data, 2026, based on 1% licensed listings)
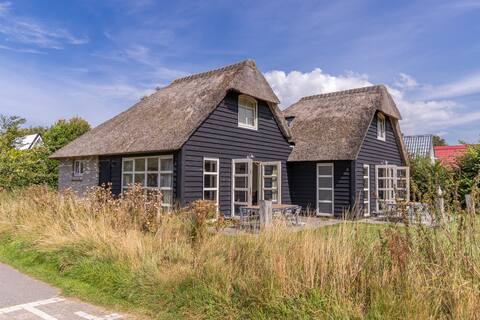
Top Performing Airbnb Properties in Sint Maartensvlotbrug (2026)
Benchmark your potential! Explore examples of top-performing Airbnb properties in Sint Maartensvlotbrugbased on Trailing Twelve Month (TTM) revenue. Analyze their characteristics, revenue, occupancy rate, and ADR to understand what drives success in this market.

10-person vacation home with Jacuzzi and fireplace
Entire Place • 5 bedrooms
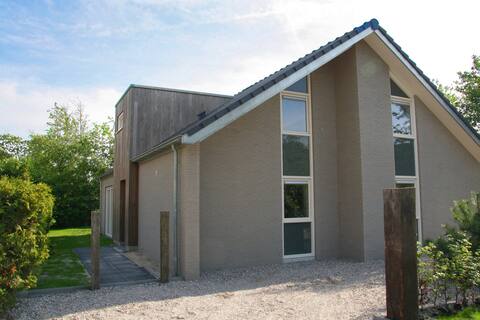
Duinland 36 XL for 10 people!
Entire Place • 5 bedrooms
Vacation home for 14 people close to the sea and dunes
Entire Place • 6 bedrooms
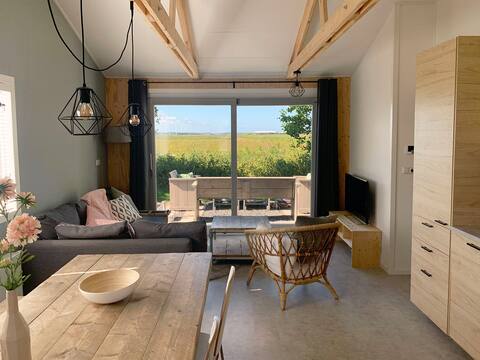
Zen & Zee: relaxing on the coast with six people
Entire Place • 3 bedrooms
Bungalow near the beach
Entire Place • 2 bedrooms
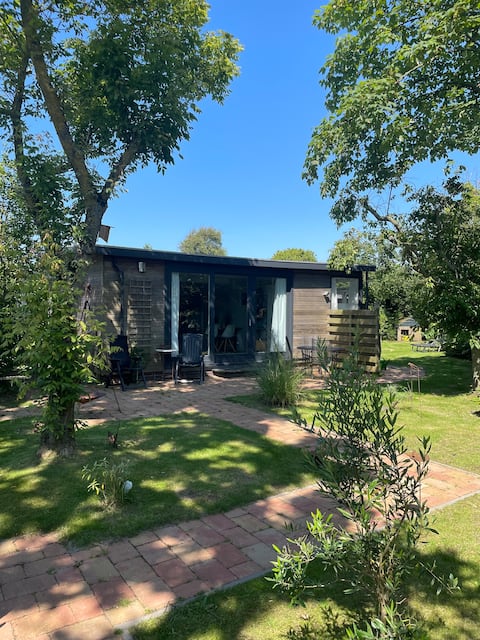
Vieflow Home, cottage behind the dunes
Entire Place • 3 bedrooms
Note: Performance varies based on location, size, amenities, seasonality, and management quality. Data reflects the past 12 months.
Top Performing Airbnb Hosts in Sint Maartensvlotbrug (2026)
Learn from the best! This table showcases top-performing Airbnb hosts in Sint Maartensvlotbrug based on the number of properties managed and estimated total revenue over the past year. Analyze their scale and performance metrics.
| Host Name | Properties | Grossing Revenue | Stay Reviews | Avg Rating |
|---|---|---|---|---|
| I-Projekt Vakantiewoningen | 54 | $669,724 | 338 | 4.46/5.0 |
| Niek | 5 | $219,846 | 29 | 4.50/5.0 |
| LekkerNaarZee | 2 | $75,919 | 5 | 4.33/5.0 |
| Alie | 3 | $70,276 | 137 | 4.77/5.0 |
| Diana - BELVILLA | 6 | $62,555 | 32 | 4.39/5.0 |
| Duincamping De Lepelaar | 10 | $58,025 | 57 | 4.53/5.0 |
| Frank | 1 | $45,097 | 88 | 4.91/5.0 |
| Jur | 1 | $44,194 | 73 | 4.84/5.0 |
| Gijs | 6 | $40,240 | 72 | 4.91/5.0 |
| Verhuurbureau Great Vakantiehu | 18 | $39,342 | 61 | 4.67/5.0 |
Analyzing the strategies of top hosts, such as their property selection, pricing, and guest communication, can offer valuable lessons for optimizing your own Airbnb operations in Sint Maartensvlotbrug.
Dive Deeper: Advanced Sint Maartensvlotbrug STR Market Data (2026)
Ready to unlock more insights? AirROI provides access to advanced metrics and comprehensive Airbnb data for Sint Maartensvlotbrug. Explore detailed analytics beyond this report to refine your investment strategy, optimize pricing, and maximize your vacation rental profits.
Explore Advanced MetricsSint Maartensvlotbrug Short-Term Rental Market Composition (2026): Property & Room Types
Room Type Distribution
Property Type Distribution
Market Composition Insights for Sint Maartensvlotbrug
- The Sint Maartensvlotbrug Airbnb market composition is heavily skewed towards Entire Home/Apt listings, which make up 100% of the 156 active rentals. This indicates strong guest preference for privacy and space.
- Looking at the property type distribution in Sint Maartensvlotbrug, House properties are the most common (89.1%), reflecting the local real estate landscape.
- Houses represent a significant 89.1% portion, catering likely to families or larger groups.
- Smaller segments like apartment/condo, others, hotel/boutique (combined 3.2%) offer potential for unique stay experiences.
Sint Maartensvlotbrug Airbnb Room Capacity Analysis (2026): Bedroom Distribution
Distribution of Listings by Number of Bedrooms
Room Capacity Insights for Sint Maartensvlotbrug
- The dominant room capacity in Sint Maartensvlotbrug is 3 bedrooms listings, making up 44.2% of the market. This suggests a strong demand for properties suitable for families or small groups.
- Together, 3 bedrooms and 2 bedrooms properties represent 85.2% of the active Airbnb listings in Sint Maartensvlotbrug, indicating a high concentration in these sizes.
- A significant 48.7% of listings offer 3+ bedrooms, catering to larger groups and families seeking more space in Sint Maartensvlotbrug.
Sint Maartensvlotbrug Vacation Rental Guest Capacity Trends (2026)
Distribution of Listings by Guest Capacity
Guest Capacity Insights for Sint Maartensvlotbrug
- The most common guest capacity trend in Sint Maartensvlotbrug vacation rentals is listings accommodating 4 guests (37.8%). This suggests the primary traveler segment is likely small families or groups.
- Properties designed for 4 guests and 6 guests dominate the Sint Maartensvlotbrug STR market, accounting for 66.0% of listings.
- 35.2% of properties accommodate 6+ guests, serving the market segment for larger families or group travel in Sint Maartensvlotbrug.
- On average, properties in Sint Maartensvlotbrug are equipped to host 4.9 guests.
Sint Maartensvlotbrug Airbnb Booking Patterns (2026): Available vs. Booked Days
Available Days Distribution
Booked Days Distribution
Booking Pattern Insights for Sint Maartensvlotbrug
- The most common availability pattern in Sint Maartensvlotbrug falls within the 271-366 days range, representing 71.8% of listings. This suggests many properties have significant open periods on their calendars.
- Approximately 89.1% of listings show high availability (181+ days open annually), indicating potential for increased bookings or specific owner usage patterns.
- For booked days, the 31-90 days range is most frequent in Sint Maartensvlotbrug (39.1%), reflecting common guest stay durations or potential owner blocking patterns.
- A notable 12.2% of properties secure long booking periods (181+ days booked per year), highlighting successful long-term rental strategies or significant owner usage.
Sint Maartensvlotbrug Airbnb Minimum Stay Requirements Analysis
Distribution of Listings by Minimum Night Requirement
1 Night
27 listings
17.3% of total
2 Nights
11 listings
7.1% of total
3 Nights
10 listings
6.4% of total
4-6 Nights
17 listings
10.9% of total
7-29 Nights
4 listings
2.6% of total
30+ Nights
87 listings
55.8% of total
Key Insights
- The most prevalent minimum stay requirement in Sint Maartensvlotbrug is 30+ Nights, adopted by 55.8% of listings. This highlights the market's preference for longer commitments.
- A significant segment (55.8%) caters to monthly stays (30+ nights) in Sint Maartensvlotbrug, pointing to opportunities in the extended-stay market.
Recommendations
- Align with the market by considering a 30+ Nights minimum stay, as 55.8% of Sint Maartensvlotbrug hosts use this setting.
- If feasible, allowing 1-night stays, especially midweek or during low season, could capture last-minute bookings, as only 17.3% currently do.
- Explore offering discounts for stays of 30+ nights to attract the 55.8% of the market seeking extended stays.
- Adjust minimum nights based on seasonality – potentially shorter during low season and longer during peak demand periods in Sint Maartensvlotbrug.
Sint Maartensvlotbrug Airbnb Cancellation Policy Trends Analysis (2026)
Super Strict 30 Days
11 listings
7.1% of total
Super Strict 60 Days
2 listings
1.3% of total
Flexible
6 listings
3.8% of total
Moderate
21 listings
13.5% of total
Firm
110 listings
70.5% of total
Strict
6 listings
3.8% of total
Cancellation Policy Insights for Sint Maartensvlotbrug
- The prevailing Airbnb cancellation policy trend in Sint Maartensvlotbrug is Firm, used by 70.5% of listings.
- A majority (74.3%) of hosts in Sint Maartensvlotbrug utilize Firm or Strict policies, indicating a market where hosts prioritize booking security.
- Strict cancellation policies are quite rare (3.8%), potentially making listings with this policy less competitive unless justified by high demand or property type.
Recommendations for Hosts
- Consider adopting a Firm policy to align with the 70.5% market standard in Sint Maartensvlotbrug.
- Using a Strict policy might deter some guests, as only 3.8% of listings use it. Evaluate if potential revenue protection outweighs possible lower booking rates.
- Regularly review your cancellation policy against competitors and market demand shifts in Sint Maartensvlotbrug.
Sint Maartensvlotbrug STR Booking Lead Time Analysis (2026)
Average Booking Lead Time by Month
Booking Lead Time Insights for Sint Maartensvlotbrug
- The overall average booking lead time for vacation rentals in Sint Maartensvlotbrug is 85 days.
- Guests book furthest in advance for stays during August (average 129 days), likely coinciding with peak travel demand or local events.
- The shortest booking windows occur for stays in February (average 33 days), indicating more last-minute travel plans during this time.
- Seasonally, Summer (109 days avg.) sees the longest lead times, while Winter (65 days avg.) has the shortest, reflecting typical travel planning cycles.
Recommendations for Hosts
- Use the overall average lead time (85 days) as a baseline for your pricing and availability strategy in Sint Maartensvlotbrug.
- For August stays, consider implementing length-of-stay discounts or slightly higher rates for bookings made less than 129 days out to capitalize on advance planning.
- Target marketing efforts for the Summer season well in advance (at least 109 days) to capture early planners.
- Monitor your own booking lead times against these Sint Maartensvlotbrug averages to identify opportunities for dynamic pricing adjustments.
Popular & Essential Airbnb Amenities in Sint Maartensvlotbrug (2026)
Amenity Prevalence
Amenity Insights for Sint Maartensvlotbrug
- Essential amenities in Sint Maartensvlotbrug that guests expect include: Kitchen. Lacking these (this) could significantly impact bookings.
- Popular amenities like TV, Heating, Coffee maker are common but not universal. Offering these can provide a competitive edge.
- Warning: Wifi is not universally provided but is considered essential globally. Ensure reliable Wifi is offered.
Recommendations for Hosts
- Ensure your listing includes all essential amenities for Sint Maartensvlotbrug: Kitchen.
- Prioritize adding missing essentials: Kitchen.
- Consider adding popular differentiators like TV or Heating to increase appeal.
- Highlight unique or less common amenities you offer (e.g., hot tub, dedicated workspace, EV charger) in your listing description and photos.
- Regularly check competitor amenities in Sint Maartensvlotbrug to stay competitive.
Sint Maartensvlotbrug Airbnb Guest Demographics & Profile Analysis (2026)
Guest Profile Summary for Sint Maartensvlotbrug
- The typical guest profile for Airbnb in Sint Maartensvlotbrug consists of predominantly international visitors (81%), with top international origins including Netherlands, typically belonging to the Post-2000s (Gen Z/Alpha) group (50%), primarily speaking English or German.
- Domestic travelers account for 19.3% of guests.
- Key international markets include Germany (71.1%) and Netherlands (19.3%).
- Top languages spoken are English (37.9%) followed by German (34.6%).
- A significant demographic segment is the Post-2000s (Gen Z/Alpha) group, representing 50% of guests.
Recommendations for Hosts
- Focus marketing internationally, particularly towards travelers from Netherlands.
- Tailor amenities and listing descriptions to appeal to the dominant Post-2000s (Gen Z/Alpha) demographic (e.g., highlight fast WiFi, smart home features, local guides).
- Highlight unique local experiences or amenities relevant to the primary guest profile.
- Consider seasonal promotions aligned with peak travel times for key origin markets.
Nearby Short-Term Rental Market Comparison
How does the Sint Maartensvlotbrug Airbnb market stack up against its neighbors? Compare key performance metrics like average monthly revenue, ADR, and occupancy rates in surrounding areas to understand the broader regional STR landscape.
| Market | Active Properties | Monthly Revenue | Daily Rate | Avg. Occupancy |
|---|---|---|---|---|
| Raamsdonksveer | 16 | $7,756 | $736.17 | 38% |
| Kockengen | 11 | $6,027 | $485.77 | 53% |
| Haghorst | 11 | $5,995 | $480.40 | 40% |
| Merksplas | 12 | $5,367 | $356.64 | 43% |
| Zerkegem | 10 | $4,846 | $437.71 | 57% |
| Bentveld | 15 | $4,727 | $517.02 | 50% |
| Zwanenburg | 22 | $4,111 | $255.87 | 61% |
| Wormer | 11 | $3,997 | $226.69 | 59% |
| Roelofarendsveen | 17 | $3,861 | $194.80 | 63% |
| Halfweg | 18 | $3,685 | $237.41 | 54% |