Gennep Airbnb Market Analysis 2026: Short Term Rental Data & Vacation Rental Statistics in Limburg, Netherlands
Is Airbnb profitable in Gennep in 2026? Explore comprehensive Airbnb analytics for Gennep, Limburg, Netherlands to uncover income potential. This 2026 STR market report for Gennep, based on AirROI data from February 2025 to January 2026, reveals key trends in the niche market of 43 active listings.
Whether you're considering an Airbnb investment in Gennep, optimizing your existing vacation rental, or exploring rental arbitrage opportunities, understanding the Gennep Airbnb data is crucial. Leveraging the low regulation environment is key to maximizing your short term rental income potential. Let's dive into the specifics.
Key Gennep Airbnb Performance Metrics Overview
Monthly Airbnb Revenue Variations & Income Potential in Gennep (2026)
Understanding the monthly revenue variations for Airbnb listings in Gennep is key to maximizing your short term rental income potential. Seasonality significantly impacts earnings. Our analysis, based on data from the past 12 months, shows that the peak revenue month for STRs in Gennep is typically August, while January often presents the lowest earnings, highlighting opportunities for strategic pricing adjustments during shoulder and low seasons. Explore the typical Airbnb income in Gennep across different performance tiers:
- Best-in-class properties (Top 10%) achieve $3,664+ monthly, often utilizing dynamic pricing and superior guest experiences.
- Strong performing properties (Top 25%) earn $2,858 or more, indicating effective management and desirable locations/amenities.
- Typical properties (Median) generate around $1,882 per month, representing the average market performance.
- Entry-level properties (Bottom 25%) see earnings around $1,027, often with potential for optimization.
Average Monthly Airbnb Earnings Trend in Gennep
Gennep Airbnb Occupancy Rate Trends (2026)
Maximize your bookings by understanding the Gennep STR occupancy trends. Seasonal demand shifts significantly influence how often properties are booked. Typically, Aprilsees the highest demand (peak season occupancy), while January experiences the lowest (low season). Effective strategies, like adjusting minimum stays or offering promotions, can boost occupancy during slower periods. Here's how different property tiers perform in Gennep:
- Best-in-class properties (Top 10%) achieve 80%+ occupancy, indicating high desirability and potentially optimized availability.
- Strong performing properties (Top 25%) maintain 64% or higher occupancy, suggesting good market fit and guest satisfaction.
- Typical properties (Median) have an occupancy rate around 37%.
- Entry-level properties (Bottom 25%) average 16% occupancy, potentially facing higher vacancy.
Average Monthly Occupancy Rate Trend in Gennep
Average Daily Rate (ADR) Airbnb Trends in Gennep (2026)
Effective short term rental pricing strategy in Gennep involves understanding monthly ADR fluctuations. The Average Daily Rate (ADR) for Airbnb in Gennep typically peaks in August and dips lowest during February. Leveraging Airbnb dynamic pricing tools or strategies based on this seasonality can significantly boost revenue. Here's a look at the typical nightly rates achieved:
- Best-in-class properties (Top 10%) command rates of $325+ per night, often due to premium features or locations.
- Strong performing properties (Top 25%) achieve nightly rates of $255 or more.
- Typical properties (Median) charge around $160 per night.
- Entry-level properties (Bottom 25%) earn around $104 per night.
Average Daily Rate (ADR) Trend by Month in Gennep
Get Live Gennep Market Intelligence 👇

Explore Real-time Analytics
Airbnb Seasonality Analysis & Trends in Gennep (2026)
Peak Season (August, July, May)
- Revenue averages $2,492 per month
- Occupancy rates average 42.8%
- Daily rates average $198
Shoulder Season
- Revenue averages $2,122 per month
- Occupancy maintains around 43.6%
- Daily rates hold near $189
Low Season (January, February, December)
- Revenue drops to average $1,707 per month
- Occupancy decreases to average 35.2%
- Daily rates adjust to average $189
Seasonality Insights for Gennep
- The Airbnb seasonality in Gennep shows moderate seasonality with distinct peak and low periods. While the sections above show seasonal averages, it's also insightful to look at the extremes:
- During the high season, the absolute peak month showcases Gennep's highest earning potential, with monthly revenues capable of climbing to $2,688, occupancy reaching a high of 47.5%, and ADRs peaking at $205.
- Conversely, the slowest single month of the year, typically falling within the low season, marks the market's lowest point. In this month, revenue might dip to $1,489, occupancy could drop to 25.9%, and ADRs may adjust down to $174.
- Understanding both the seasonal averages and these monthly peaks and troughs in revenue, occupancy, and ADR is crucial for maximizing your Airbnb profit potential in Gennep.
Seasonal Strategies for Maximizing Profit
- Peak Season: Maximize revenue through premium pricing and potentially longer minimum stays. Ensure high availability.
- Low Season: Offer competitive pricing, special promotions (e.g., extended stay discounts), and flexible cancellation policies. Target off-season travelers like remote workers or budget-conscious guests.
- Shoulder Seasons: Implement dynamic pricing that balances peak and low rates. Target weekend travelers or specific events. Offer slightly more flexible terms than peak season.
- Regularly analyze your own performance against these Gennep seasonality benchmarks and adjust your pricing and availability strategy accordingly.
Best Areas for Airbnb Investment in Gennep (2026)
Exploring the top neighborhoods for short-term rentals in Gennep? This section highlights key areas, outlining why they are attractive for hosts and guests, along with notable local attractions. Consider these locations based on your target guest profile and investment strategy.
| Neighborhood / Area | Why Host Here? (Target Guests & Appeal) | Key Attractions & Landmarks |
|---|---|---|
| Gennep City Center | The heart of Gennep, featuring local shops, cafes, and restaurants. It's ideal for guests wanting to experience local culture and amenities. | St. Martinus Church, Museum van Gennep, Local Markets, Cafes and Restaurants, Gennep Parks |
| Limburg Nature Parks | Proximity to stunning natural parks, ideal for nature lovers and outdoor activities. Great for guests who enjoy hiking and cycling. | Genneper Watermill, De Maas, Natuurgebied De Mook, Cycling Trails, Parks and Forests |
| Historical Quarter | Rich in history with charming old buildings and local heritage. A perfect spot for tourists interested in culture and history. | Historical Buildings, Old City Walls, Local Heritage Sites, Cultural Events, Art Galleries |
| Families Friendly Area | Safe and welcoming neighborhoods, perfect for family vacations with parks and children's activities nearby. | Family Parks, Playgrounds, Sporting Facilities, Nearby Schools, Family-Friendly Restaurants |
| Near Gennep Train Station | Convenient access to public transport, making it easy for travelers to explore surrounding areas and cities. | Train Connections to Nijmegen, Bicycle Rentals, Cafes Nearby, Public Transportation Access, Local Shops |
| River Maas Area | Scenic views and recreational activities by the river. Great for water sports enthusiasts and those looking for relaxation. | River Activities, Scenic Walks, Boating, Fishing Spots, Picnic Areas |
| Cultural Events Hub | Close to venues for local festivals and events. Ideal for guests looking to experience Gennep's cultural calendar. | Festival Locations, Concert Venues, Local Cuisine Tasting Events, Community Gatherings, Seasonal Fairs |
| Shopping District | Home to a variety of shops and boutiques, appealing to tourists who love shopping and dining out. | Local Boutiques, Markets, Dining Options, Shopping Events, Local Crafts |
Understanding Airbnb License Requirements & STR Laws in Gennep (2026)
While Gennep, Limburg, Netherlands currently shows low STR regulations, specific Airbnb license requirements might still exist or change. Always verify the latest short term rental regulations and Airbnb license requirements directly with local government authorities for Gennep to ensure full compliance before hosting.
(Source: AirROI data, 2026, finding no licensed listings among those analyzed)
Top Performing Airbnb Properties in Gennep (2026)
Benchmark your potential! Explore examples of top-performing Airbnb properties in Gennepbased on Trailing Twelve Month (TTM) revenue. Analyze their characteristics, revenue, occupancy rate, and ADR to understand what drives success in this market.
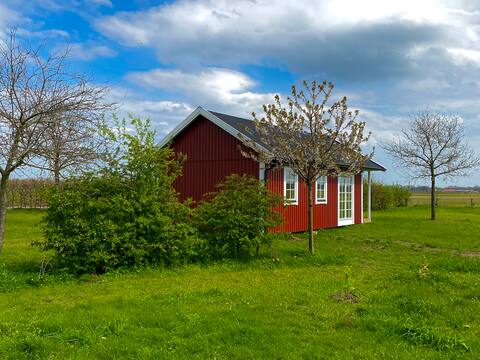
De Rooie Vos Tiny House
Entire Place • 1 bedroom

Reffel Suites
Entire Place • 2 bedrooms

Vacation home Het IJsvogeltje
Entire Place • 2 bedrooms

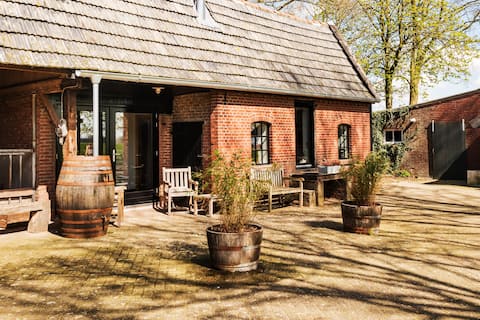
B&B app. On Stable - kitchen, sauna, wood stove
Entire Place • 2 bedrooms

PLEK17 CABIN / Tiny house
Entire Place • 1 bedroom
B&B apartment, Het Ruiterhuisje, kitchen, sauna, wood stove
Entire Place • 1 bedroom
Note: Performance varies based on location, size, amenities, seasonality, and management quality. Data reflects the past 12 months.
Top Performing Airbnb Hosts in Gennep (2026)
Learn from the best! This table showcases top-performing Airbnb hosts in Gennep based on the number of properties managed and estimated total revenue over the past year. Analyze their scale and performance metrics.
| Host Name | Properties | Grossing Revenue | Stay Reviews | Avg Rating |
|---|---|---|---|---|
| Bernadette Cornelia Maria | 12 | $215,033 | 134 | 4.86/5.0 |
| Martijn | 5 | $181,765 | 498 | 4.90/5.0 |
| Center Parcs Europe | 7 | $101,645 | 33 | 4.21/5.0 |
| Bas | 4 | $78,567 | 113 | 4.99/5.0 |
| Julie | 3 | $65,870 | 243 | 4.73/5.0 |
| Jaitske | 1 | $39,167 | 12 | 4.75/5.0 |
| Simone | 1 | $38,312 | 33 | 4.85/5.0 |
| Gerrit | 1 | $28,969 | 104 | 4.89/5.0 |
| Stans | 1 | $24,597 | 149 | 4.77/5.0 |
| Margreet | 1 | $22,542 | 86 | 4.66/5.0 |
Analyzing the strategies of top hosts, such as their property selection, pricing, and guest communication, can offer valuable lessons for optimizing your own Airbnb operations in Gennep.
Dive Deeper: Advanced Gennep STR Market Data (2026)
Ready to unlock more insights? AirROI provides access to advanced metrics and comprehensive Airbnb data for Gennep. Explore detailed analytics beyond this report to refine your investment strategy, optimize pricing, and maximize your vacation rental profits.
Explore Advanced MetricsGennep Short-Term Rental Market Composition (2026): Property & Room Types
Room Type Distribution
Property Type Distribution
Market Composition Insights for Gennep
- The Gennep Airbnb market composition is heavily skewed towards Entire Home/Apt listings, which make up 88.4% of the 43 active rentals. This indicates strong guest preference for privacy and space.
- Looking at the property type distribution in Gennep, House properties are the most common (46.5%), reflecting the local real estate landscape.
- Houses represent a significant 46.5% portion, catering likely to families or larger groups.
- The presence of 11.6% Hotel/Boutique listings indicates integration with traditional hospitality.
- Smaller segments like others (combined 2.3%) offer potential for unique stay experiences.
Gennep Airbnb Room Capacity Analysis (2026): Bedroom Distribution
Distribution of Listings by Number of Bedrooms
Room Capacity Insights for Gennep
- The dominant room capacity in Gennep is 1 bedroom listings, making up 51.2% of the market. This suggests a strong demand for properties suitable for couples or solo travelers.
- Together, 1 bedroom and 2 bedrooms properties represent 65.2% of the active Airbnb listings in Gennep, indicating a high concentration in these sizes.
- With over half the market (51.2%) consisting of studios or 1-bedroom units, Gennep is particularly well-suited for individuals or couples.
- Listings with 3+ bedrooms (9.3%) represent a smaller niche, potentially indicating an underserved market for larger group accommodations in Gennep.
Gennep Vacation Rental Guest Capacity Trends (2026)
Distribution of Listings by Guest Capacity
Guest Capacity Insights for Gennep
- The most common guest capacity trend in Gennep vacation rentals is listings accommodating 2 guests (60.5%). This suggests the primary traveler segment is likely couples or solo travelers.
- Properties designed for 2 guests and 4 guests dominate the Gennep STR market, accounting for 74.5% of listings.
- A significant 60.5% of listings cater specifically to 1-2 guests, highlighting strong demand from couples and solo travelers in Gennep.
- 14.0% of properties accommodate 6+ guests, serving the market segment for larger families or group travel in Gennep.
- On average, properties in Gennep are equipped to host 3.0 guests.
Gennep Airbnb Booking Patterns (2026): Available vs. Booked Days
Available Days Distribution
Booked Days Distribution
Booking Pattern Insights for Gennep
- The most common availability pattern in Gennep falls within the 271-366 days range, representing 44.2% of listings. This suggests many properties have significant open periods on their calendars.
- Approximately 65.1% of listings show high availability (181+ days open annually), indicating potential for increased bookings or specific owner usage patterns.
- For booked days, the 31-90 days range is most frequent in Gennep (30.2%), reflecting common guest stay durations or potential owner blocking patterns.
- A notable 34.9% of properties secure long booking periods (181+ days booked per year), highlighting successful long-term rental strategies or significant owner usage.
Gennep Airbnb Minimum Stay Requirements Analysis
Distribution of Listings by Minimum Night Requirement
1 Night
22 listings
51.2% of total
2 Nights
10 listings
23.3% of total
3 Nights
2 listings
4.7% of total
30+ Nights
9 listings
20.9% of total
Key Insights
- The most prevalent minimum stay requirement in Gennep is 1 Night, adopted by 51.2% of listings. This highlights the market's preference for shorter, flexible bookings.
- A strong majority (74.5%) of the Gennep Airbnb data shows acceptance of very short stays (1-2 nights), indicating a dynamic, high-turnover market.
- A significant segment (20.9%) caters to monthly stays (30+ nights) in Gennep, pointing to opportunities in the extended-stay market.
Recommendations
- Align with the market by considering a 1 Night minimum stay, as 51.2% of Gennep hosts use this setting.
- Explore offering discounts for stays of 30+ nights to attract the 20.9% of the market seeking extended stays.
- Adjust minimum nights based on seasonality – potentially shorter during low season and longer during peak demand periods in Gennep.
Gennep Airbnb Cancellation Policy Trends Analysis (2026)
Flexible
9 listings
20.9% of total
Moderate
6 listings
14% of total
Firm
28 listings
65.1% of total
Cancellation Policy Insights for Gennep
- The prevailing Airbnb cancellation policy trend in Gennep is Firm, used by 65.1% of listings.
- A majority (65.1%) of hosts in Gennep utilize Firm or Strict policies, indicating a market where hosts prioritize booking security.
Recommendations for Hosts
- Consider adopting a Firm policy to align with the 65.1% market standard in Gennep.
- Regularly review your cancellation policy against competitors and market demand shifts in Gennep.
Gennep STR Booking Lead Time Analysis (2026)
Average Booking Lead Time by Month
Booking Lead Time Insights for Gennep
- The overall average booking lead time for vacation rentals in Gennep is 71 days.
- Guests book furthest in advance for stays during May (average 97 days), likely coinciding with peak travel demand or local events.
- The shortest booking windows occur for stays in February (average 33 days), indicating more last-minute travel plans during this time.
- Seasonally, Summer (70 days avg.) sees the longest lead times, while Winter (49 days avg.) has the shortest, reflecting typical travel planning cycles.
Recommendations for Hosts
- Use the overall average lead time (71 days) as a baseline for your pricing and availability strategy in Gennep.
- For May stays, consider implementing length-of-stay discounts or slightly higher rates for bookings made less than 97 days out to capitalize on advance planning.
- Target marketing efforts for the Summer season well in advance (at least 70 days) to capture early planners.
- Monitor your own booking lead times against these Gennep averages to identify opportunities for dynamic pricing adjustments.
Popular & Essential Airbnb Amenities in Gennep (2026)
Amenity Prevalence
Amenity Insights for Gennep
- Popular amenities like Wifi, Heating, Free parking on premises are common but not universal. Offering these can provide a competitive edge.
- Warning: Wifi is not universally provided but is considered essential globally. Ensure reliable Wifi is offered.
Recommendations for Hosts
- Consider adding popular differentiators like Wifi or Heating to increase appeal.
- Highlight unique or less common amenities you offer (e.g., hot tub, dedicated workspace, EV charger) in your listing description and photos.
- Regularly check competitor amenities in Gennep to stay competitive.
Gennep Airbnb Guest Demographics & Profile Analysis (2026)
Guest Profile Summary for Gennep
- The typical guest profile for Airbnb in Gennep consists of a mix of domestic (52%) and international guests, often arriving from nearby Utrecht, typically belonging to the Post-2000s (Gen Z/Alpha) group (50%), primarily speaking English or German.
- Domestic travelers account for 52.0% of guests.
- Key international markets include Netherlands (52%) and Germany (31.5%).
- Top languages spoken are English (41.8%) followed by German (22.8%).
- A significant demographic segment is the Post-2000s (Gen Z/Alpha) group, representing 50% of guests.
Recommendations for Hosts
- Balance marketing efforts between domestic and international channels based on the guest mix.
- Tailor amenities and listing descriptions to appeal to the dominant Post-2000s (Gen Z/Alpha) demographic (e.g., highlight fast WiFi, smart home features, local guides).
- Highlight unique local experiences or amenities relevant to the primary guest profile.
- Consider seasonal promotions aligned with peak travel times for key origin markets.
Nearby Short-Term Rental Market Comparison
How does the Gennep Airbnb market stack up against its neighbors? Compare key performance metrics like average monthly revenue, ADR, and occupancy rates in surrounding areas to understand the broader regional STR landscape.
| Market | Active Properties | Monthly Revenue | Daily Rate | Avg. Occupancy |
|---|---|---|---|---|
| Losser | 10 | $7,954 | $1060.34 | 27% |
| Raamsdonksveer | 16 | $7,756 | $736.17 | 38% |
| Kockengen | 11 | $6,027 | $485.77 | 53% |
| Haghorst | 11 | $5,995 | $480.40 | 40% |
| Baarlo | 20 | $5,442 | $332.61 | 51% |
| Merksplas | 12 | $5,367 | $356.64 | 43% |
| Bentveld | 15 | $4,727 | $517.02 | 50% |
| Incourt | 13 | $4,412 | $303.48 | 52% |
| Wellin | 12 | $4,365 | $446.64 | 42% |
| Aubel | 26 | $4,191 | $283.88 | 46% |