Lalitpur Airbnb Market Analysis 2026: Short Term Rental Data & Vacation Rental Statistics in Bagmati Province, Nepal
Is Airbnb profitable in Lalitpur in 2026? Explore comprehensive Airbnb analytics for Lalitpur, Bagmati Province, Nepal to uncover income potential. This 2026 STR market report for Lalitpur, based on AirROI data from February 2025 to January 2026, reveals key trends in the market of 228 active listings.
Whether you're considering an Airbnb investment in Lalitpur, optimizing your existing vacation rental, or exploring rental arbitrage opportunities, understanding the Lalitpur Airbnb data is crucial. Leveraging the low regulation environment is key to maximizing your short term rental income potential. Let's dive into the specifics.
Key Lalitpur Airbnb Performance Metrics Overview
Monthly Airbnb Revenue Variations & Income Potential in Lalitpur (2026)
Understanding the monthly revenue variations for Airbnb listings in Lalitpur is key to maximizing your short term rental income potential. Seasonality significantly impacts earnings. Our analysis, based on data from the past 12 months, shows that the peak revenue month for STRs in Lalitpur is typically November, while January often presents the lowest earnings, highlighting opportunities for strategic pricing adjustments during shoulder and low seasons. Explore the typical Airbnb income in Lalitpur across different performance tiers:
- Best-in-class properties (Top 10%) achieve $1,191+ monthly, often utilizing dynamic pricing and superior guest experiences.
- Strong performing properties (Top 25%) earn $724 or more, indicating effective management and desirable locations/amenities.
- Typical properties (Median) generate around $363 per month, representing the average market performance.
- Entry-level properties (Bottom 25%) see earnings around $154, often with potential for optimization.
Average Monthly Airbnb Earnings Trend in Lalitpur
Lalitpur Airbnb Occupancy Rate Trends (2026)
Maximize your bookings by understanding the Lalitpur STR occupancy trends. Seasonal demand shifts significantly influence how often properties are booked. Typically, Novembersees the highest demand (peak season occupancy), while January experiences the lowest (low season). Effective strategies, like adjusting minimum stays or offering promotions, can boost occupancy during slower periods. Here's how different property tiers perform in Lalitpur:
- Best-in-class properties (Top 10%) achieve 78%+ occupancy, indicating high desirability and potentially optimized availability.
- Strong performing properties (Top 25%) maintain 55% or higher occupancy, suggesting good market fit and guest satisfaction.
- Typical properties (Median) have an occupancy rate around 31%.
- Entry-level properties (Bottom 25%) average 15% occupancy, potentially facing higher vacancy.
Average Monthly Occupancy Rate Trend in Lalitpur
Average Daily Rate (ADR) Airbnb Trends in Lalitpur (2026)
Effective short term rental pricing strategy in Lalitpur involves understanding monthly ADR fluctuations. The Average Daily Rate (ADR) for Airbnb in Lalitpur typically peaks in May and dips lowest during January. Leveraging Airbnb dynamic pricing tools or strategies based on this seasonality can significantly boost revenue. Here's a look at the typical nightly rates achieved:
- Best-in-class properties (Top 10%) command rates of $74+ per night, often due to premium features or locations.
- Strong performing properties (Top 25%) achieve nightly rates of $53 or more.
- Typical properties (Median) charge around $33 per night.
- Entry-level properties (Bottom 25%) earn around $22 per night.
Average Daily Rate (ADR) Trend by Month in Lalitpur
Get Live Lalitpur Market Intelligence 👇

Explore Real-time Analytics
Airbnb Seasonality Analysis & Trends in Lalitpur (2026)
Peak Season (November, March, April)
- Revenue averages $620 per month
- Occupancy rates average 41.4%
- Daily rates average $41
Shoulder Season
- Revenue averages $532 per month
- Occupancy maintains around 36.7%
- Daily rates hold near $41
Low Season (January, September, December)
- Revenue drops to average $428 per month
- Occupancy decreases to average 32.0%
- Daily rates adjust to average $39
Seasonality Insights for Lalitpur
- The Airbnb seasonality in Lalitpur shows moderate seasonality with distinct peak and low periods. While the sections above show seasonal averages, it's also insightful to look at the extremes:
- During the high season, the absolute peak month showcases Lalitpur's highest earning potential, with monthly revenues capable of climbing to $650, occupancy reaching a high of 42.8%, and ADRs peaking at $42.
- Conversely, the slowest single month of the year, typically falling within the low season, marks the market's lowest point. In this month, revenue might dip to $345, occupancy could drop to 27.5%, and ADRs may adjust down to $39.
- Understanding both the seasonal averages and these monthly peaks and troughs in revenue, occupancy, and ADR is crucial for maximizing your Airbnb profit potential in Lalitpur.
Seasonal Strategies for Maximizing Profit
- Peak Season: Maximize revenue through premium pricing and potentially longer minimum stays. Ensure high availability.
- Low Season: Offer competitive pricing, special promotions (e.g., extended stay discounts), and flexible cancellation policies. Target off-season travelers like remote workers or budget-conscious guests.
- Shoulder Seasons: Implement dynamic pricing that balances peak and low rates. Target weekend travelers or specific events. Offer slightly more flexible terms than peak season.
- Regularly analyze your own performance against these Lalitpur seasonality benchmarks and adjust your pricing and availability strategy accordingly.
Best Areas for Airbnb Investment in Lalitpur (2026)
Exploring the top neighborhoods for short-term rentals in Lalitpur? This section highlights key areas, outlining why they are attractive for hosts and guests, along with notable local attractions. Consider these locations based on your target guest profile and investment strategy.
| Neighborhood / Area | Why Host Here? (Target Guests & Appeal) | Key Attractions & Landmarks |
|---|---|---|
| Patan Durbar Square | A UNESCO World Heritage Site, Patan Durbar Square is a stunning historical site with beautiful temples and architecture, attracting many tourists interested in culture and history. | Patan Museum, Krishna Mandir, Golden Temple, Mahabouddha Temple, Patan Durbar Square itself, Streets filled with shops and cafes |
| Lalitpur Metropolitan City | The main urban area in Lalitpur, filled with modern amenities, cafes, restaurants, and close to educational institutions, making it ideal for students and travelers alike. | Local markets, Cafes and eateries, Parks and public spaces, Cultural events and festivals, Close proximity to public transport |
| Himalayan Region | Natural beauty with stunning views of the Himalayas, attracting tourists who seek adventure and nature, perfect for unique Airbnb experiences. | Trekking routes, Natural hot springs, Cultural villages, Wildlife sanctuaries, Scenic hiking trails |
| Lagankhel | A bustling commercial area with various shops, eateries, and proximity to public transport, making it a convenient location for travelers. | Local food stalls, Shopping centers, Cafes, Close to major bus routes, Hiking trails near by |
| Bhaisepati | A quieter residential neighborhood with a local feel, attracting travelers who wish to experience everyday Nepali life while being close to the city. | Local parks, Community events, Traditional houses, Cultural experiences, Local dining options |
| Pulchowk | Known for its educational institutions and modern infrastructure, Pulchowk attracts students and young professionals, ideal for short-term stays. | Engineering colleges, Local eateries, Cafes, Art galleries, Cultural festivals |
| Kirtipur | An ancient town with rich history and culture, known for its temples and traditional Newari architecture, attracting cultural tourists. | Buddha Stupa, Kirtipur Durbar Square, Historical temples, Local handicrafts, Traditional festivals |
| Bhaktapur | Though slightly outside Lalitpur, it's a historical city offering remarkable architecture and heritage, very popular among tourists. Perfect for Airbnb hosting. | Bhaktapur Durbar Square, Bhadgaon, Local pottery workshops, Traditional Newari cuisine, Various temples and festivals |
Understanding Airbnb License Requirements & STR Laws in Lalitpur (2026)
While Lalitpur, Bagmati Province, Nepal currently shows low STR regulations, specific Airbnb license requirements might still exist or change. Always verify the latest short term rental regulations and Airbnb license requirements directly with local government authorities for Lalitpur to ensure full compliance before hosting.
(Source: AirROI data, 2026, finding no licensed listings among those analyzed)
Top Performing Airbnb Properties in Lalitpur (2026)
Benchmark your potential! Explore examples of top-performing Airbnb properties in Lalitpurbased on Trailing Twelve Month (TTM) revenue. Analyze their characteristics, revenue, occupancy rate, and ADR to understand what drives success in this market.

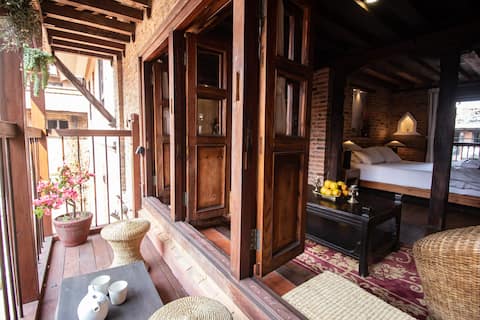
Balcony Imperial Duplex - live like a king
Entire Place • 2 bedrooms

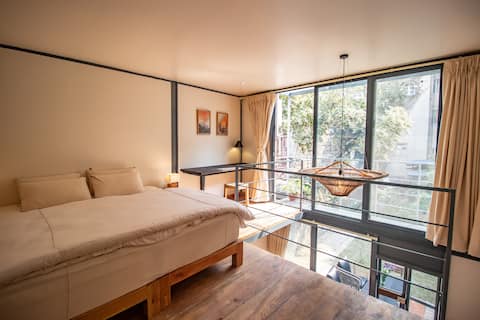
The Lavish 4BHK Duplex Penthouse
Entire Place • 4 bedrooms
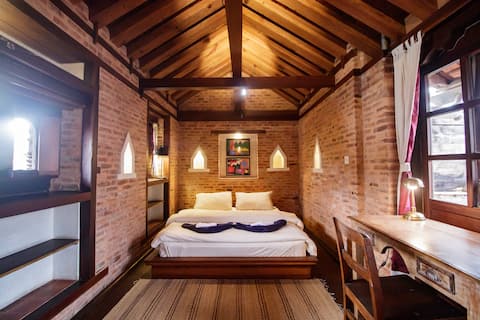
Flat in beautiful Newari house - Charming!
Entire Place • 2 bedrooms
Unique Garden house -Old Patan!
Entire Place • 1 bedroom

Firefly Home in quaint compound
Entire Place • 4 bedrooms
Karma duplex with roof terrace and amazing view!
Entire Place • 1 bedroom
Note: Performance varies based on location, size, amenities, seasonality, and management quality. Data reflects the past 12 months.
Top Performing Airbnb Hosts in Lalitpur (2026)
Learn from the best! This table showcases top-performing Airbnb hosts in Lalitpur based on the number of properties managed and estimated total revenue over the past year. Analyze their scale and performance metrics.
| Host Name | Properties | Grossing Revenue | Stay Reviews | Avg Rating |
|---|---|---|---|---|
| Nigen Sohan Rojen | 30 | $261,238 | 1885 | 4.95/5.0 |
| Casa Deyra | 14 | $82,369 | 125 | 4.77/5.0 |
| Pradip | 10 | $45,406 | 36 | 4.97/5.0 |
| Pranaya | 5 | $31,611 | 106 | 4.95/5.0 |
| Eleena Sabin | 3 | $24,319 | 135 | 4.92/5.0 |
| Sailesh | 6 | $21,002 | 61 | 4.99/5.0 |
| Amanda | 3 | $18,327 | 19 | 4.79/5.0 |
| Abhi Krishna | 4 | $14,094 | 31 | 4.92/5.0 |
| Sandesh | 4 | $13,149 | 46 | 4.86/5.0 |
| Swechchha | 2 | $12,711 | 201 | 4.97/5.0 |
Analyzing the strategies of top hosts, such as their property selection, pricing, and guest communication, can offer valuable lessons for optimizing your own Airbnb operations in Lalitpur.
Dive Deeper: Advanced Lalitpur STR Market Data (2026)
Ready to unlock more insights? AirROI provides access to advanced metrics and comprehensive Airbnb data for Lalitpur. Explore detailed analytics beyond this report to refine your investment strategy, optimize pricing, and maximize your vacation rental profits.
Explore Advanced MetricsLalitpur Short-Term Rental Market Composition (2026): Property & Room Types
Room Type Distribution
Property Type Distribution
Market Composition Insights for Lalitpur
- The Lalitpur Airbnb market composition is heavily skewed towards Entire Home/Apt listings, which make up 63.2% of the 228 active rentals. This indicates strong guest preference for privacy and space.
- However, a notable 35.5% share for Private Rooms suggests opportunities for budget-conscious travelers or hosts renting out spare rooms.
- Looking at the property type distribution in Lalitpur, Apartment/Condo properties are the most common (63.2%), reflecting the local real estate landscape.
- Houses represent a significant 16.7% portion, catering likely to families or larger groups.
- The presence of 20.2% Hotel/Boutique listings indicates integration with traditional hospitality.
Lalitpur Airbnb Room Capacity Analysis (2026): Bedroom Distribution
Distribution of Listings by Number of Bedrooms
Room Capacity Insights for Lalitpur
- The dominant room capacity in Lalitpur is 1 bedroom listings, making up 54.8% of the market. This suggests a strong demand for properties suitable for couples or solo travelers.
- Together, 1 bedroom and 2 bedrooms properties represent 73.7% of the active Airbnb listings in Lalitpur, indicating a high concentration in these sizes.
- With over half the market (54.8%) consisting of studios or 1-bedroom units, Lalitpur is particularly well-suited for individuals or couples.
- Listings with 3+ bedrooms (6.1%) represent a smaller niche, potentially indicating an underserved market for larger group accommodations in Lalitpur.
Lalitpur Vacation Rental Guest Capacity Trends (2026)
Distribution of Listings by Guest Capacity
Guest Capacity Insights for Lalitpur
- The most common guest capacity trend in Lalitpur vacation rentals is listings accommodating 2 guests (51.8%). This suggests the primary traveler segment is likely couples or solo travelers.
- Properties designed for 2 guests and 4 guests dominate the Lalitpur STR market, accounting for 61.9% of listings.
- A significant 53.1% of listings cater specifically to 1-2 guests, highlighting strong demand from couples and solo travelers in Lalitpur.
- On average, properties in Lalitpur are equipped to host 2.2 guests.
Lalitpur Airbnb Booking Patterns (2026): Available vs. Booked Days
Available Days Distribution
Booked Days Distribution
Booking Pattern Insights for Lalitpur
- The most common availability pattern in Lalitpur falls within the 271-366 days range, representing 69.7% of listings. This suggests many properties have significant open periods on their calendars.
- Approximately 90.8% of listings show high availability (181+ days open annually), indicating potential for increased bookings or specific owner usage patterns.
- For booked days, the 1-30 days range is most frequent in Lalitpur (38.2%), reflecting common guest stay durations or potential owner blocking patterns.
- A notable 10.1% of properties secure long booking periods (181+ days booked per year), highlighting successful long-term rental strategies or significant owner usage.
Lalitpur Airbnb Minimum Stay Requirements Analysis
Distribution of Listings by Minimum Night Requirement
1 Night
101 listings
44.3% of total
2 Nights
45 listings
19.7% of total
3 Nights
15 listings
6.6% of total
4-6 Nights
8 listings
3.5% of total
7-29 Nights
8 listings
3.5% of total
30+ Nights
51 listings
22.4% of total
Key Insights
- The most prevalent minimum stay requirement in Lalitpur is 1 Night, adopted by 44.3% of listings. This highlights the market's preference for shorter, flexible bookings.
- A strong majority (64.0%) of the Lalitpur Airbnb data shows acceptance of very short stays (1-2 nights), indicating a dynamic, high-turnover market.
- A significant segment (22.4%) caters to monthly stays (30+ nights) in Lalitpur, pointing to opportunities in the extended-stay market.
Recommendations
- Align with the market by considering a 1 Night minimum stay, as 44.3% of Lalitpur hosts use this setting.
- Explore offering discounts for stays of 30+ nights to attract the 22.4% of the market seeking extended stays.
- Adjust minimum nights based on seasonality – potentially shorter during low season and longer during peak demand periods in Lalitpur.
Lalitpur Airbnb Cancellation Policy Trends Analysis (2026)
Limited
23 listings
10.1% of total
Flexible
106 listings
46.5% of total
Moderate
57 listings
25% of total
Firm
40 listings
17.5% of total
Strict
2 listings
0.9% of total
Cancellation Policy Insights for Lalitpur
- The prevailing Airbnb cancellation policy trend in Lalitpur is Flexible, used by 46.5% of listings.
- The market strongly favors guest-friendly terms, with 71.5% of listings offering Flexible or Moderate policies. This suggests guests in Lalitpur may expect booking flexibility.
- Strict cancellation policies are quite rare (0.9%), potentially making listings with this policy less competitive unless justified by high demand or property type.
Recommendations for Hosts
- Consider adopting a Flexible policy to align with the 46.5% market standard in Lalitpur.
- Using a Strict policy might deter some guests, as only 0.9% of listings use it. Evaluate if potential revenue protection outweighs possible lower booking rates.
- Regularly review your cancellation policy against competitors and market demand shifts in Lalitpur.
Lalitpur STR Booking Lead Time Analysis (2026)
Average Booking Lead Time by Month
Booking Lead Time Insights for Lalitpur
- The overall average booking lead time for vacation rentals in Lalitpur is 28 days.
- Guests book furthest in advance for stays during November (average 57 days), likely coinciding with peak travel demand or local events.
- The shortest booking windows occur for stays in June (average 16 days), indicating more last-minute travel plans during this time.
- Seasonally, Fall (52 days avg.) sees the longest lead times, while Summer (20 days avg.) has the shortest, reflecting typical travel planning cycles.
Recommendations for Hosts
- Use the overall average lead time (28 days) as a baseline for your pricing and availability strategy in Lalitpur.
- For November stays, consider implementing length-of-stay discounts or slightly higher rates for bookings made less than 57 days out to capitalize on advance planning.
- Target marketing efforts for the Fall season well in advance (at least 52 days) to capture early planners.
- Monitor your own booking lead times against these Lalitpur averages to identify opportunities for dynamic pricing adjustments.
Popular & Essential Airbnb Amenities in Lalitpur (2026)
Amenity Prevalence
Amenity Insights for Lalitpur
- Essential amenities in Lalitpur that guests expect include: Wifi. Lacking these (this) could significantly impact bookings.
- Popular amenities like Dedicated workspace, Kitchen, Hangers are common but not universal. Offering these can provide a competitive edge.
Recommendations for Hosts
- Ensure your listing includes all essential amenities for Lalitpur: Wifi.
- Consider adding popular differentiators like Dedicated workspace or Kitchen to increase appeal.
- Highlight unique or less common amenities you offer (e.g., hot tub, dedicated workspace, EV charger) in your listing description and photos.
- Regularly check competitor amenities in Lalitpur to stay competitive.
Lalitpur Airbnb Guest Demographics & Profile Analysis (2026)
Guest Profile Summary for Lalitpur
- The typical guest profile for Airbnb in Lalitpur consists of predominantly international visitors (99%), with top international origins including United Kingdom, typically belonging to the Post-2000s (Gen Z/Alpha) group (50%), primarily speaking English or Spanish.
- Domestic travelers account for 1.1% of guests.
- Key international markets include United States (24.8%) and United Kingdom (8.6%).
- Top languages spoken are English (43.7%) followed by Spanish (8.6%).
- A significant demographic segment is the Post-2000s (Gen Z/Alpha) group, representing 50% of guests.
Recommendations for Hosts
- Focus marketing internationally, particularly towards travelers from United Kingdom.
- Tailor amenities and listing descriptions to appeal to the dominant Post-2000s (Gen Z/Alpha) demographic (e.g., highlight fast WiFi, smart home features, local guides).
- Highlight unique local experiences or amenities relevant to the primary guest profile.
- Consider seasonal promotions aligned with peak travel times for key origin markets.
Nearby Short-Term Rental Market Comparison
How does the Lalitpur Airbnb market stack up against its neighbors? Compare key performance metrics like average monthly revenue, ADR, and occupancy rates in surrounding areas to understand the broader regional STR landscape.
| Market | Active Properties | Monthly Revenue | Daily Rate | Avg. Occupancy |
|---|---|---|---|---|
| Kathmandu Metropolitan City | 77 | $240 | $40.54 | 34% |
| Kathmandu | 333 | $203 | $31.82 | 32% |
| Budhanilkantha | 18 | $173 | $41.14 | 24% |
| Bhaktapur | 16 | $166 | $41.56 | 21% |
| Nagarjun Municipality | 20 | $137 | $28.41 | 37% |
| Budhanilkantha Municipality | 11 | $102 | $23.52 | 32% |
| Ratnanagar | 11 | $55 | $23.09 | 15% |