Kathmandu Airbnb Market Analysis 2026: Short Term Rental Data & Vacation Rental Statistics in Bagmati Province, Nepal
Is Airbnb profitable in Kathmandu in 2026? Explore comprehensive Airbnb analytics for Kathmandu, Bagmati Province, Nepal to uncover income potential. This 2026 STR market report for Kathmandu, based on AirROI data from February 2025 to January 2026, reveals key trends in the market of 333 active listings.
Whether you're considering an Airbnb investment in Kathmandu, optimizing your existing vacation rental, or exploring rental arbitrage opportunities, understanding the Kathmandu Airbnb data is crucial. Leveraging the low regulation environment is key to maximizing your short term rental income potential. Let's dive into the specifics.
Key Kathmandu Airbnb Performance Metrics Overview
Monthly Airbnb Revenue Variations & Income Potential in Kathmandu (2026)
Understanding the monthly revenue variations for Airbnb listings in Kathmandu is key to maximizing your short term rental income potential. Seasonality significantly impacts earnings. Our analysis, based on data from the past 12 months, shows that the peak revenue month for STRs in Kathmandu is typically March, while January often presents the lowest earnings, highlighting opportunities for strategic pricing adjustments during shoulder and low seasons. Explore the typical Airbnb income in Kathmandu across different performance tiers:
- Best-in-class properties (Top 10%) achieve $864+ monthly, often utilizing dynamic pricing and superior guest experiences.
- Strong performing properties (Top 25%) earn $509 or more, indicating effective management and desirable locations/amenities.
- Typical properties (Median) generate around $256 per month, representing the average market performance.
- Entry-level properties (Bottom 25%) see earnings around $112, often with potential for optimization.
Average Monthly Airbnb Earnings Trend in Kathmandu
Kathmandu Airbnb Occupancy Rate Trends (2026)
Maximize your bookings by understanding the Kathmandu STR occupancy trends. Seasonal demand shifts significantly influence how often properties are booked. Typically, Marchsees the highest demand (peak season occupancy), while January experiences the lowest (low season). Effective strategies, like adjusting minimum stays or offering promotions, can boost occupancy during slower periods. Here's how different property tiers perform in Kathmandu:
- Best-in-class properties (Top 10%) achieve 79%+ occupancy, indicating high desirability and potentially optimized availability.
- Strong performing properties (Top 25%) maintain 58% or higher occupancy, suggesting good market fit and guest satisfaction.
- Typical properties (Median) have an occupancy rate around 32%.
- Entry-level properties (Bottom 25%) average 14% occupancy, potentially facing higher vacancy.
Average Monthly Occupancy Rate Trend in Kathmandu
Average Daily Rate (ADR) Airbnb Trends in Kathmandu (2026)
Effective short term rental pricing strategy in Kathmandu involves understanding monthly ADR fluctuations. The Average Daily Rate (ADR) for Airbnb in Kathmandu typically peaks in May and dips lowest during January. Leveraging Airbnb dynamic pricing tools or strategies based on this seasonality can significantly boost revenue. Here's a look at the typical nightly rates achieved:
- Best-in-class properties (Top 10%) command rates of $67+ per night, often due to premium features or locations.
- Strong performing properties (Top 25%) achieve nightly rates of $42 or more.
- Typical properties (Median) charge around $26 per night.
- Entry-level properties (Bottom 25%) earn around $16 per night.
Average Daily Rate (ADR) Trend by Month in Kathmandu
Get Live Kathmandu Market Intelligence 👇

Explore Real-time Analytics
Airbnb Seasonality Analysis & Trends in Kathmandu (2026)
Peak Season (March, November, July)
- Revenue averages $434 per month
- Occupancy rates average 41.6%
- Daily rates average $33
Shoulder Season
- Revenue averages $383 per month
- Occupancy maintains around 38.0%
- Daily rates hold near $34
Low Season (January, May, August)
- Revenue drops to average $333 per month
- Occupancy decreases to average 33.3%
- Daily rates adjust to average $34
Seasonality Insights for Kathmandu
- The Airbnb seasonality in Kathmandu shows moderate seasonality with distinct peak and low periods. While the sections above show seasonal averages, it's also insightful to look at the extremes:
- During the high season, the absolute peak month showcases Kathmandu's highest earning potential, with monthly revenues capable of climbing to $444, occupancy reaching a high of 44.2%, and ADRs peaking at $34.
- Conversely, the slowest single month of the year, typically falling within the low season, marks the market's lowest point. In this month, revenue might dip to $324, occupancy could drop to 32.1%, and ADRs may adjust down to $33.
- Understanding both the seasonal averages and these monthly peaks and troughs in revenue, occupancy, and ADR is crucial for maximizing your Airbnb profit potential in Kathmandu.
Seasonal Strategies for Maximizing Profit
- Peak Season: Maximize revenue through premium pricing and potentially longer minimum stays. Ensure high availability.
- Low Season: Offer competitive pricing, special promotions (e.g., extended stay discounts), and flexible cancellation policies. Target off-season travelers like remote workers or budget-conscious guests.
- Shoulder Seasons: Implement dynamic pricing that balances peak and low rates. Target weekend travelers or specific events. Offer slightly more flexible terms than peak season.
- Regularly analyze your own performance against these Kathmandu seasonality benchmarks and adjust your pricing and availability strategy accordingly.
Best Areas for Airbnb Investment in Kathmandu (2026)
Exploring the top neighborhoods for short-term rentals in Kathmandu? This section highlights key areas, outlining why they are attractive for hosts and guests, along with notable local attractions. Consider these locations based on your target guest profile and investment strategy.
| Neighborhood / Area | Why Host Here? (Target Guests & Appeal) | Key Attractions & Landmarks |
|---|---|---|
| Thamel | A bustling tourist district known for its vibrant atmosphere, Thamel is the main hub for travelers in Kathmandu. It offers numerous hotels, restaurants, shops, and cultural experiences, making it a prime location for Airbnb hosting. | Garden of Dreams, Durbar Square, Swayambhunath Stupa, Thamel's shopping streets, Kantipath, Food stalls and local cuisine |
| Boudhanath | Home to the famous Boudhanath Stupa, this area attracts tourists for its spiritual significance and peaceful ambiance. It's a great spot for those looking for a cultural experience in a serene environment. | Boudhanath Stupa, Monasteries, Local cafes and restaurants, Thangka painting studios, Buddhist cultural experiences |
| Patan | Known for its rich history and stunning architecture, Patan offers a more local experience with less tourist hustle compared to Thamel. It is also close to many historic sites, making it ideal for Airbnb experiences. | Patan Durbar Square, Patan Museum, Traditional handicraft shops, Buddha Stupa at Kirtipur, Local marketplaces |
| Bhaktapur | A UNESCO World Heritage Site, Bhaktapur is famous for its well-preserved medieval architecture and cultural treasures. It offers unique opportunities for Airbnb hosting away from the city bustle. | Bhaktapur Durbar Square, Nyatapola Temple, 55-Window Palace, Dattatreya Temple, Local pottery workshops |
| Kopan | A peaceful suburb known for its Buddhist monasteries, mainly the Kopan Monastery, it attracts those interested in meditation and spiritual retreats, providing a unique Airbnb experience. | Kopan Monastery, Scenic hills, Meditation courses, Local hiking trails, Vegetarian restaurants |
| Nagarkot | A popular hill station near Kathmandu, Nagarkot is famous for its stunning sunrise views over the Himalayas. It attracts both local and international tourists looking for a getaway from the city. | Himalayan views, Sunrise viewpoints, Hiking trails, Local mountain resorts, Traditional village visits |
| Lalitpur | Also known as Patan, Lalitpur is culturally rich and offers a glimpse into local life, with traditional crafts and homes. It's less commercial compared to Kathmandu, making it an attractive Airbnb location. | Traditional Newari architecture, Local art galleries, Patan Dhoka, Craft workshops, Community events |
| Swayambhunath | Famous for the monkey temple, Swayambhunath offers spectacular views of Kathmandu and is a popular spot for both tourists and locals. It provides a unique Airbnb hosting experience among spiritual and natural beauty. | Swayambhunath Stupa, Monkey Temple, Local hikes, Cafes with views, Cultural festivals |
Understanding Airbnb License Requirements & STR Laws in Kathmandu (2026)
While Kathmandu, Bagmati Province, Nepal currently shows low STR regulations, specific Airbnb license requirements might still exist or change. Always verify the latest short term rental regulations and Airbnb license requirements directly with local government authorities for Kathmandu to ensure full compliance before hosting.
(Source: AirROI data, 2026, finding no licensed listings among those analyzed)
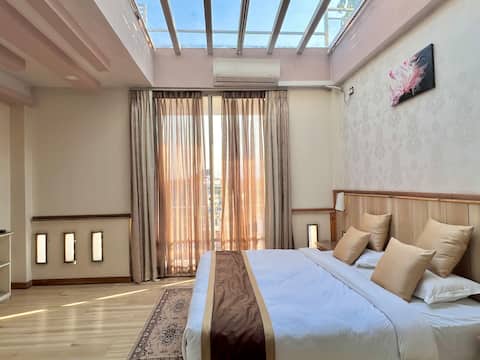
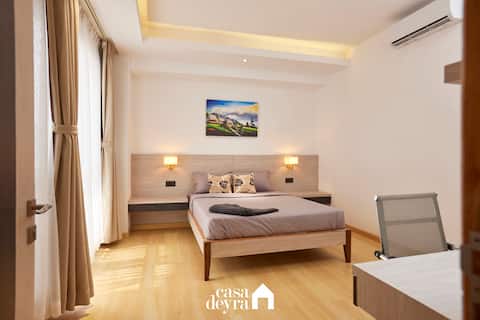
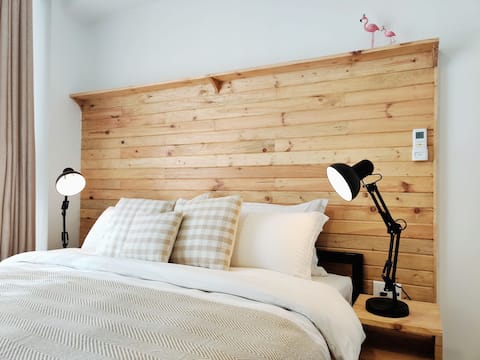
Top Performing Airbnb Properties in Kathmandu (2026)
Benchmark your potential! Explore examples of top-performing Airbnb properties in Kathmandubased on Trailing Twelve Month (TTM) revenue. Analyze their characteristics, revenue, occupancy rate, and ADR to understand what drives success in this market.
Spacious 5 BHK Apartment ,Luxurious with City View
Entire Place • 5 bedrooms
The Magnolia 3 BHK Apartment
Entire Place • 3 bedrooms

Serenity stay
Entire Place • 2 bedrooms
Cozy Cabin 2BHK Apartment
Entire Place • 2 bedrooms
Peaceful City Apartment
Entire Place • 2 bedrooms

SUPERHOST | Boutique 3BHK Tibet Designer Apartment
Entire Place • 3 bedrooms
Note: Performance varies based on location, size, amenities, seasonality, and management quality. Data reflects the past 12 months.
Top Performing Airbnb Hosts in Kathmandu (2026)
Learn from the best! This table showcases top-performing Airbnb hosts in Kathmandu based on the number of properties managed and estimated total revenue over the past year. Analyze their scale and performance metrics.
| Host Name | Properties | Grossing Revenue | Stay Reviews | Avg Rating |
|---|---|---|---|---|
| Casa Deyra | 15 | $85,544 | 71 | 4.81/5.0 |
| Shazia | 18 | $55,839 | 538 | 4.95/5.0 |
| Subu & Mala | 6 | $42,066 | 303 | 4.85/5.0 |
| Rahul | 9 | $32,022 | 268 | 4.99/5.0 |
| Babin | 7 | $31,262 | 149 | 4.86/5.0 |
| Yogen | 6 | $29,938 | 562 | 4.82/5.0 |
| Amir | 7 | $25,782 | 123 | 4.85/5.0 |
| Sugat | 4 | $23,367 | 127 | 4.96/5.0 |
| Dil | 5 | $22,718 | 1187 | 4.86/5.0 |
| Riya | 1 | $21,474 | 41 | 4.61/5.0 |
Analyzing the strategies of top hosts, such as their property selection, pricing, and guest communication, can offer valuable lessons for optimizing your own Airbnb operations in Kathmandu.
Dive Deeper: Advanced Kathmandu STR Market Data (2026)
Ready to unlock more insights? AirROI provides access to advanced metrics and comprehensive Airbnb data for Kathmandu. Explore detailed analytics beyond this report to refine your investment strategy, optimize pricing, and maximize your vacation rental profits.
Explore Advanced MetricsKathmandu Short-Term Rental Market Composition (2026): Property & Room Types
Room Type Distribution
Property Type Distribution
Market Composition Insights for Kathmandu
- The Kathmandu Airbnb market composition is heavily skewed towards Entire Home/Apt listings, which make up 53.2% of the 333 active rentals. This indicates strong guest preference for privacy and space.
- However, a notable 44.1% share for Private Rooms suggests opportunities for budget-conscious travelers or hosts renting out spare rooms.
- Looking at the property type distribution in Kathmandu, Apartment/Condo properties are the most common (56.5%), reflecting the local real estate landscape.
- Houses represent a significant 24% portion, catering likely to families or larger groups.
- The presence of 18.3% Hotel/Boutique listings indicates integration with traditional hospitality.
- Smaller segments like others, outdoor/unique (combined 1.2%) offer potential for unique stay experiences.
Kathmandu Airbnb Room Capacity Analysis (2026): Bedroom Distribution
Distribution of Listings by Number of Bedrooms
Room Capacity Insights for Kathmandu
- The dominant room capacity in Kathmandu is 1 bedroom listings, making up 41.4% of the market. This suggests a strong demand for properties suitable for couples or solo travelers.
- Together, 1 bedroom and 2 bedrooms properties represent 62.1% of the active Airbnb listings in Kathmandu, indicating a high concentration in these sizes.
Kathmandu Vacation Rental Guest Capacity Trends (2026)
Distribution of Listings by Guest Capacity
Guest Capacity Insights for Kathmandu
- The most common guest capacity trend in Kathmandu vacation rentals is listings accommodating 2 guests (37.5%). This suggests the primary traveler segment is likely couples or solo travelers.
- Properties designed for 2 guests and 4 guests dominate the Kathmandu STR market, accounting for 53.7% of listings.
- On average, properties in Kathmandu are equipped to host 2.3 guests.
Kathmandu Airbnb Booking Patterns (2026): Available vs. Booked Days
Available Days Distribution
Booked Days Distribution
Booking Pattern Insights for Kathmandu
- The most common availability pattern in Kathmandu falls within the 271-366 days range, representing 67.6% of listings. This suggests many properties have significant open periods on their calendars.
- Approximately 87.1% of listings show high availability (181+ days open annually), indicating potential for increased bookings or specific owner usage patterns.
- For booked days, the 1-30 days range is most frequent in Kathmandu (38.1%), reflecting common guest stay durations or potential owner blocking patterns.
- A notable 12.9% of properties secure long booking periods (181+ days booked per year), highlighting successful long-term rental strategies or significant owner usage.
Kathmandu Airbnb Minimum Stay Requirements Analysis
Distribution of Listings by Minimum Night Requirement
1 Night
177 listings
53.2% of total
2 Nights
67 listings
20.1% of total
3 Nights
19 listings
5.7% of total
4-6 Nights
15 listings
4.5% of total
7-29 Nights
6 listings
1.8% of total
30+ Nights
49 listings
14.7% of total
Key Insights
- The most prevalent minimum stay requirement in Kathmandu is 1 Night, adopted by 53.2% of listings. This highlights the market's preference for shorter, flexible bookings.
- A strong majority (73.3%) of the Kathmandu Airbnb data shows acceptance of very short stays (1-2 nights), indicating a dynamic, high-turnover market.
- A significant segment (14.7%) caters to monthly stays (30+ nights) in Kathmandu, pointing to opportunities in the extended-stay market.
Recommendations
- Align with the market by considering a 1 Night minimum stay, as 53.2% of Kathmandu hosts use this setting.
- Explore offering discounts for stays of 30+ nights to attract the 14.7% of the market seeking extended stays.
- Adjust minimum nights based on seasonality – potentially shorter during low season and longer during peak demand periods in Kathmandu.
Kathmandu Airbnb Cancellation Policy Trends Analysis (2026)
Limited
8 listings
2.4% of total
Flexible
153 listings
46.1% of total
Moderate
74 listings
22.3% of total
Firm
70 listings
21.1% of total
Strict
27 listings
8.1% of total
Cancellation Policy Insights for Kathmandu
- The prevailing Airbnb cancellation policy trend in Kathmandu is Flexible, used by 46.1% of listings.
- There's a relatively balanced mix between guest-friendly (68.4%) and stricter (29.2%) policies, offering choices for different guest needs.
- Strict cancellation policies are quite rare (8.1%), potentially making listings with this policy less competitive unless justified by high demand or property type.
Recommendations for Hosts
- Consider adopting a Flexible policy to align with the 46.1% market standard in Kathmandu.
- Using a Strict policy might deter some guests, as only 8.1% of listings use it. Evaluate if potential revenue protection outweighs possible lower booking rates.
- Regularly review your cancellation policy against competitors and market demand shifts in Kathmandu.
Kathmandu STR Booking Lead Time Analysis (2026)
Average Booking Lead Time by Month
Booking Lead Time Insights for Kathmandu
- The overall average booking lead time for vacation rentals in Kathmandu is 25 days.
- Guests book furthest in advance for stays during September (average 41 days), likely coinciding with peak travel demand or local events.
- The shortest booking windows occur for stays in June (average 13 days), indicating more last-minute travel plans during this time.
- Seasonally, Fall (37 days avg.) sees the longest lead times, while Summer (17 days avg.) has the shortest, reflecting typical travel planning cycles.
Recommendations for Hosts
- Use the overall average lead time (25 days) as a baseline for your pricing and availability strategy in Kathmandu.
- For September stays, consider implementing length-of-stay discounts or slightly higher rates for bookings made less than 41 days out to capitalize on advance planning.
- During June, focus on last-minute booking availability and promotions, as guests book with very short notice (13 days avg.).
- Target marketing efforts for the Fall season well in advance (at least 37 days) to capture early planners.
- Monitor your own booking lead times against these Kathmandu averages to identify opportunities for dynamic pricing adjustments.
Popular & Essential Airbnb Amenities in Kathmandu (2026)
Amenity Prevalence
Amenity Insights for Kathmandu
- Essential amenities in Kathmandu that guests expect include: Wifi. Lacking these (this) could significantly impact bookings.
- Popular amenities like Hot water, Essentials, Hangers are common but not universal. Offering these can provide a competitive edge.
Recommendations for Hosts
- Ensure your listing includes all essential amenities for Kathmandu: Wifi.
- Prioritize adding missing essentials: Wifi.
- Consider adding popular differentiators like Hot water or Essentials to increase appeal.
- Highlight unique or less common amenities you offer (e.g., hot tub, dedicated workspace, EV charger) in your listing description and photos.
- Regularly check competitor amenities in Kathmandu to stay competitive.
Kathmandu Airbnb Guest Demographics & Profile Analysis (2026)
Guest Profile Summary for Kathmandu
- The typical guest profile for Airbnb in Kathmandu consists of predominantly international visitors (99%), with top international origins including United Kingdom, typically belonging to the Post-2000s (Gen Z/Alpha) group (50%), primarily speaking English or Spanish.
- Domestic travelers account for 0.8% of guests.
- Key international markets include United States (24.2%) and United Kingdom (10%).
- Top languages spoken are English (42.5%) followed by Spanish (9.5%).
- A significant demographic segment is the Post-2000s (Gen Z/Alpha) group, representing 50% of guests.
Recommendations for Hosts
- Focus marketing internationally, particularly towards travelers from United Kingdom.
- Tailor amenities and listing descriptions to appeal to the dominant Post-2000s (Gen Z/Alpha) demographic (e.g., highlight fast WiFi, smart home features, local guides).
- Highlight unique local experiences or amenities relevant to the primary guest profile.
- Consider seasonal promotions aligned with peak travel times for key origin markets.
Nearby Short-Term Rental Market Comparison
How does the Kathmandu Airbnb market stack up against its neighbors? Compare key performance metrics like average monthly revenue, ADR, and occupancy rates in surrounding areas to understand the broader regional STR landscape.
| Market | Active Properties | Monthly Revenue | Daily Rate | Avg. Occupancy |
|---|---|---|---|---|
| Lalitpur | 228 | $269 | $43.39 | 32% |
| Kathmandu Metropolitan City | 77 | $240 | $40.54 | 34% |
| Budhanilkantha | 18 | $173 | $41.14 | 24% |
| Bhaktapur | 16 | $166 | $41.56 | 21% |
| Nagarjun Municipality | 20 | $137 | $28.41 | 37% |
| Budhanilkantha Municipality | 11 | $102 | $23.52 | 32% |
| Ratnanagar | 11 | $55 | $23.09 | 15% |