Larache Airbnb Market Analysis 2026: Short Term Rental Data & Vacation Rental Statistics in Tangier-Tetouan-Al Hoceima, Morocco
Is Airbnb profitable in Larache in 2026? Explore comprehensive Airbnb analytics for Larache, Tangier-Tetouan-Al Hoceima, Morocco to uncover income potential. This 2026 STR market report for Larache, based on AirROI data from February 2025 to January 2026, reveals key trends in the niche market of 39 active listings.
Whether you're considering an Airbnb investment in Larache, optimizing your existing vacation rental, or exploring rental arbitrage opportunities, understanding the Larache Airbnb data is crucial. Leveraging the low regulation environment is key to maximizing your short term rental income potential. Let's dive into the specifics.
Key Larache Airbnb Performance Metrics Overview
Monthly Airbnb Revenue Variations & Income Potential in Larache (2026)
Understanding the monthly revenue variations for Airbnb listings in Larache is key to maximizing your short term rental income potential. Seasonality significantly impacts earnings. Our analysis, based on data from the past 12 months, shows that the peak revenue month for STRs in Larache is typically August, while January often presents the lowest earnings, highlighting opportunities for strategic pricing adjustments during shoulder and low seasons. Explore the typical Airbnb income in Larache across different performance tiers:
- Best-in-class properties (Top 10%) achieve $930+ monthly, often utilizing dynamic pricing and superior guest experiences.
- Strong performing properties (Top 25%) earn $607 or more, indicating effective management and desirable locations/amenities.
- Typical properties (Median) generate around $318 per month, representing the average market performance.
- Entry-level properties (Bottom 25%) see earnings around $169, often with potential for optimization.
Average Monthly Airbnb Earnings Trend in Larache
Larache Airbnb Occupancy Rate Trends (2026)
Maximize your bookings by understanding the Larache STR occupancy trends. Seasonal demand shifts significantly influence how often properties are booked. Typically, Augustsees the highest demand (peak season occupancy), while October experiences the lowest (low season). Effective strategies, like adjusting minimum stays or offering promotions, can boost occupancy during slower periods. Here's how different property tiers perform in Larache:
- Best-in-class properties (Top 10%) achieve 54%+ occupancy, indicating high desirability and potentially optimized availability.
- Strong performing properties (Top 25%) maintain 39% or higher occupancy, suggesting good market fit and guest satisfaction.
- Typical properties (Median) have an occupancy rate around 21%.
- Entry-level properties (Bottom 25%) average 11% occupancy, potentially facing higher vacancy.
Average Monthly Occupancy Rate Trend in Larache
Average Daily Rate (ADR) Airbnb Trends in Larache (2026)
Effective short term rental pricing strategy in Larache involves understanding monthly ADR fluctuations. The Average Daily Rate (ADR) for Airbnb in Larache typically peaks in August and dips lowest during February. Leveraging Airbnb dynamic pricing tools or strategies based on this seasonality can significantly boost revenue. Here's a look at the typical nightly rates achieved:
- Best-in-class properties (Top 10%) command rates of $86+ per night, often due to premium features or locations.
- Strong performing properties (Top 25%) achieve nightly rates of $63 or more.
- Typical properties (Median) charge around $47 per night.
- Entry-level properties (Bottom 25%) earn around $37 per night.
Average Daily Rate (ADR) Trend by Month in Larache
Get Live Larache Market Intelligence 👇

Explore Real-time Analytics
Airbnb Seasonality Analysis & Trends in Larache (2026)
Peak Season (August, July, June)
- Revenue averages $747 per month
- Occupancy rates average 32.0%
- Daily rates average $60
Shoulder Season
- Revenue averages $414 per month
- Occupancy maintains around 25.8%
- Daily rates hold near $54
Low Season (January, March, November)
- Revenue drops to average $308 per month
- Occupancy decreases to average 24.9%
- Daily rates adjust to average $53
Seasonality Insights for Larache
- The Airbnb seasonality in Larache shows highly seasonal trends requiring careful strategy. While the sections above show seasonal averages, it's also insightful to look at the extremes:
- During the high season, the absolute peak month showcases Larache's highest earning potential, with monthly revenues capable of climbing to $905, occupancy reaching a high of 37.4%, and ADRs peaking at $63.
- Conversely, the slowest single month of the year, typically falling within the low season, marks the market's lowest point. In this month, revenue might dip to $264, occupancy could drop to 21.6%, and ADRs may adjust down to $50.
- Understanding both the seasonal averages and these monthly peaks and troughs in revenue, occupancy, and ADR is crucial for maximizing your Airbnb profit potential in Larache.
Seasonal Strategies for Maximizing Profit
- Peak Season: Maximize revenue through premium pricing and potentially longer minimum stays. Ensure high availability.
- Low Season: Offer competitive pricing, special promotions (e.g., extended stay discounts), and flexible cancellation policies. Target off-season travelers like remote workers or budget-conscious guests.
- Shoulder Seasons: Implement dynamic pricing that balances peak and low rates. Target weekend travelers or specific events. Offer slightly more flexible terms than peak season.
- Regularly analyze your own performance against these Larache seasonality benchmarks and adjust your pricing and availability strategy accordingly.
Best Areas for Airbnb Investment in Larache (2026)
Exploring the top neighborhoods for short-term rentals in Larache? This section highlights key areas, outlining why they are attractive for hosts and guests, along with notable local attractions. Consider these locations based on your target guest profile and investment strategy.
| Neighborhood / Area | Why Host Here? (Target Guests & Appeal) | Key Attractions & Landmarks |
|---|---|---|
| Larache Old Town | Charming historic area with traditional Moroccan architecture, narrow winding streets, and close proximity to the coast. Attractive to tourists interested in history and culture. | Kasbah of Larache, Ancient Roman ruins of Lixus, Larache beaches, Local markets, Café life on the waterfront |
| Asilah | Beautiful coastal town known for its art scene and beaches, just a short drive from Larache. Ideal for beach lovers and cultural tourists. | Asilah Medina, Beaches, Art galleries, Annual Art Festival, Café life |
| Tangier City Center | Dynamic urban area with museums, shopping, and dining. Popular with tourists looking for a bustling city experience. | American Legation Museum, Tanger Medina, Tanger-Med Port, Café Hafa, Grand Socco |
| Cape Spartel | Scenic coastal area at the meeting point of the Mediterranean Sea and the Atlantic Ocean. Attracts nature lovers and those seeking a quiet retreat. | Cape Spartel Lighthouse, Hercules Cave, beautiful coastal views, hiking trails |
| Moulay Bousselham | A quiet coastal village known for its natural beauty, offering a different vibe from more touristy areas. Ideal for those seeking relaxation and nature. | Moulay Bousselham Lagoon, beaches, birdwatching, local seafood |
| Chefchaouen | Famous for its blue-washed buildings and stunning mountain scenery, it's a popular tourist destination that offers a unique experience for visitors. | Chefchaouen Medina, Ras El Maa Waterfall, Hike in the Rif Mountains, Kasbah Museum |
| Rif Mountains | A natural paradise with incredible landscapes, hiking opportunities, and a chance to disconnect. Great for nature-oriented tourists. | Hiking trails, Berber villages, Stunning views |
| Oued Laou | Beautiful beach town that offers a calm atmosphere and scenic views. It’s less known but perfect for those looking for a peaceful getaway. | Oued Laou Beach, Scenic coastal areas, Local restaurants |
Understanding Airbnb License Requirements & STR Laws in Larache (2026)
While Larache, Tangier-Tetouan-Al Hoceima, Morocco currently shows low STR regulations, specific Airbnb license requirements might still exist or change. Always verify the latest short term rental regulations and Airbnb license requirements directly with local government authorities for Larache to ensure full compliance before hosting.
(Source: AirROI data, 2026, finding no licensed listings among those analyzed)
Top Performing Airbnb Properties in Larache (2026)
Benchmark your potential! Explore examples of top-performing Airbnb properties in Larachebased on Trailing Twelve Month (TTM) revenue. Analyze their characteristics, revenue, occupancy rate, and ADR to understand what drives success in this market.
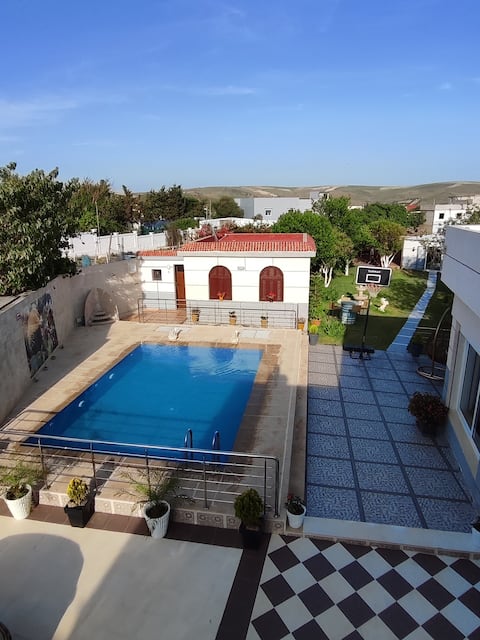
Villa Naima with private pool
Entire Place • 2 bedrooms
Beach Apartment
Entire Place • 2 bedrooms

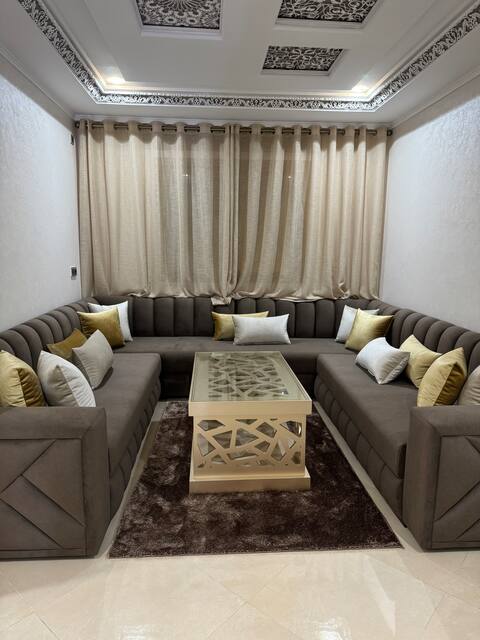
Comfy Stay in Larache's Center
Entire Place • 2 bedrooms
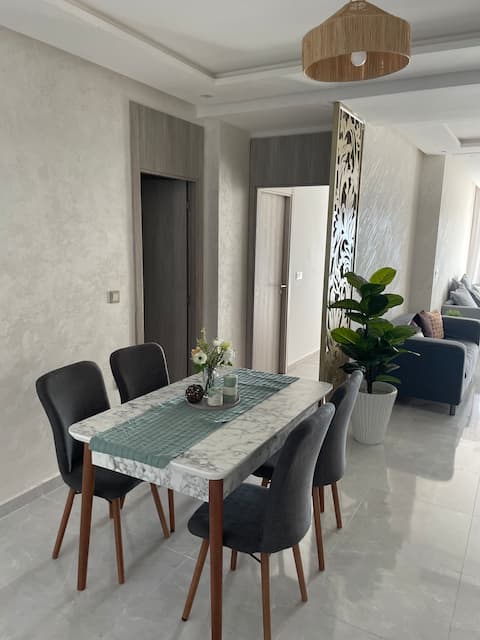
Family-sized Cosy Apartment
Entire Place • 3 bedrooms
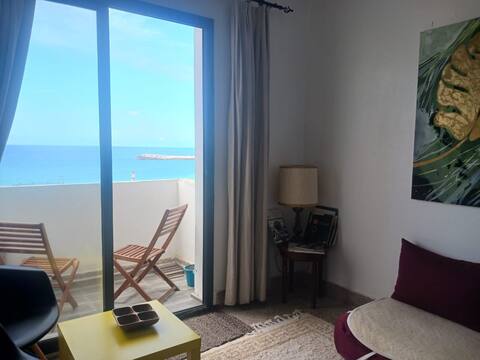
artist residency with sea view
Entire Place • 2 bedrooms

Apparently furnished for rent located in the heart of the city
Entire Place • 2 bedrooms
Note: Performance varies based on location, size, amenities, seasonality, and management quality. Data reflects the past 12 months.
Top Performing Airbnb Hosts in Larache (2026)
Learn from the best! This table showcases top-performing Airbnb hosts in Larache based on the number of properties managed and estimated total revenue over the past year. Analyze their scale and performance metrics.
| Host Name | Properties | Grossing Revenue | Stay Reviews | Avg Rating |
|---|---|---|---|---|
| Naima | 3 | $13,004 | 252 | 4.76/5.0 |
| Loubna | 1 | $12,991 | 11 | 4.82/5.0 |
| Siham | 2 | $12,426 | 75 | 4.80/5.0 |
| Driss | 1 | $10,333 | 17 | 4.88/5.0 |
| Said | 1 | $8,778 | 44 | 4.98/5.0 |
| Abdeslam | 1 | $8,360 | 11 | 5.00/5.0 |
| Mohammed | 3 | $7,931 | 96 | 4.58/5.0 |
| Intissar | 1 | $3,977 | 42 | 4.81/5.0 |
| Yasser | 1 | $3,734 | 17 | 4.24/5.0 |
| ADN SERVICES Conciergerie | 1 | $3,069 | 9 | 5.00/5.0 |
Analyzing the strategies of top hosts, such as their property selection, pricing, and guest communication, can offer valuable lessons for optimizing your own Airbnb operations in Larache.
Dive Deeper: Advanced Larache STR Market Data (2026)
Ready to unlock more insights? AirROI provides access to advanced metrics and comprehensive Airbnb data for Larache. Explore detailed analytics beyond this report to refine your investment strategy, optimize pricing, and maximize your vacation rental profits.
Explore Advanced MetricsLarache Short-Term Rental Market Composition (2026): Property & Room Types
Room Type Distribution
Property Type Distribution
Market Composition Insights for Larache
- The Larache Airbnb market composition is heavily skewed towards Entire Home/Apt listings, which make up 97.4% of the 39 active rentals. This indicates strong guest preference for privacy and space.
- Looking at the property type distribution in Larache, Apartment/Condo properties are the most common (76.9%), reflecting the local real estate landscape.
- Houses represent a significant 17.9% portion, catering likely to families or larger groups.
Larache Airbnb Room Capacity Analysis (2026): Bedroom Distribution
Distribution of Listings by Number of Bedrooms
Room Capacity Insights for Larache
- The dominant room capacity in Larache is 2 bedrooms listings, making up 46.2% of the market. This suggests a strong demand for properties suitable for couples or solo travelers.
- Together, 2 bedrooms and 1 bedroom properties represent 77.0% of the active Airbnb listings in Larache, indicating a high concentration in these sizes.
- A significant 20.5% of listings offer 3+ bedrooms, catering to larger groups and families seeking more space in Larache.
Larache Vacation Rental Guest Capacity Trends (2026)
Distribution of Listings by Guest Capacity
Guest Capacity Insights for Larache
- The most common guest capacity trend in Larache vacation rentals is listings accommodating 4 guests (30.8%). This suggests the primary traveler segment is likely small families or groups.
- Properties designed for 4 guests and 6 guests dominate the Larache STR market, accounting for 56.4% of listings.
- 38.4% of properties accommodate 6+ guests, serving the market segment for larger families or group travel in Larache.
- On average, properties in Larache are equipped to host 5.1 guests.
Larache Airbnb Booking Patterns (2026): Available vs. Booked Days
Available Days Distribution
Booked Days Distribution
Booking Pattern Insights for Larache
- The most common availability pattern in Larache falls within the 271-366 days range, representing 87.2% of listings. This suggests many properties have significant open periods on their calendars.
- Approximately 100.0% of listings show high availability (181+ days open annually), indicating potential for increased bookings or specific owner usage patterns.
- For booked days, the 1-30 days range is most frequent in Larache (46.2%), reflecting common guest stay durations or potential owner blocking patterns.
Larache Airbnb Minimum Stay Requirements Analysis
Distribution of Listings by Minimum Night Requirement
1 Night
23 listings
59% of total
2 Nights
4 listings
10.3% of total
3 Nights
1 listings
2.6% of total
30+ Nights
11 listings
28.2% of total
Key Insights
- The most prevalent minimum stay requirement in Larache is 1 Night, adopted by 59% of listings. This highlights the market's preference for shorter, flexible bookings.
- A strong majority (69.3%) of the Larache Airbnb data shows acceptance of very short stays (1-2 nights), indicating a dynamic, high-turnover market.
- A significant segment (28.2%) caters to monthly stays (30+ nights) in Larache, pointing to opportunities in the extended-stay market.
Recommendations
- Align with the market by considering a 1 Night minimum stay, as 59% of Larache hosts use this setting.
- Explore offering discounts for stays of 30+ nights to attract the 28.2% of the market seeking extended stays.
- Adjust minimum nights based on seasonality – potentially shorter during low season and longer during peak demand periods in Larache.
Larache Airbnb Cancellation Policy Trends Analysis (2026)
Limited
1 listings
2.6% of total
Flexible
20 listings
52.6% of total
Moderate
6 listings
15.8% of total
Firm
11 listings
28.9% of total
Cancellation Policy Insights for Larache
- The prevailing Airbnb cancellation policy trend in Larache is Flexible, used by 52.6% of listings.
- There's a relatively balanced mix between guest-friendly (68.4%) and stricter (28.9%) policies, offering choices for different guest needs.
Recommendations for Hosts
- Consider adopting a Flexible policy to align with the 52.6% market standard in Larache.
- Given the high prevalence of Flexible policies (52.6%), offering this can enhance booking appeal, especially during shoulder seasons.
- Regularly review your cancellation policy against competitors and market demand shifts in Larache.
Larache STR Booking Lead Time Analysis (2026)
Average Booking Lead Time by Month
Booking Lead Time Insights for Larache
- The overall average booking lead time for vacation rentals in Larache is 40 days.
- Guests book furthest in advance for stays during April (average 49 days), likely coinciding with peak travel demand or local events.
- The shortest booking windows occur for stays in November (average 6 days), indicating more last-minute travel plans during this time.
- Seasonally, Summer (36 days avg.) sees the longest lead times, while Winter (13 days avg.) has the shortest, reflecting typical travel planning cycles.
Recommendations for Hosts
- Use the overall average lead time (40 days) as a baseline for your pricing and availability strategy in Larache.
- During November, focus on last-minute booking availability and promotions, as guests book with very short notice (6 days avg.).
- Target marketing efforts for the Summer season well in advance (at least 36 days) to capture early planners.
- Monitor your own booking lead times against these Larache averages to identify opportunities for dynamic pricing adjustments.
Popular & Essential Airbnb Amenities in Larache (2026)
Amenity Prevalence
Amenity Insights for Larache
- Essential amenities in Larache that guests expect include: TV. Lacking these (this) could significantly impact bookings.
- Popular amenities like Kitchen, Washer, Wifi are common but not universal. Offering these can provide a competitive edge.
- Warning: Wifi is not universally provided but is considered essential globally. Ensure reliable Wifi is offered.
Recommendations for Hosts
- Ensure your listing includes all essential amenities for Larache: TV.
- Prioritize adding missing essentials: TV.
- Consider adding popular differentiators like Kitchen or Washer to increase appeal.
- Highlight unique or less common amenities you offer (e.g., hot tub, dedicated workspace, EV charger) in your listing description and photos.
- Regularly check competitor amenities in Larache to stay competitive.
Larache Airbnb Guest Demographics & Profile Analysis (2026)
Guest Profile Summary for Larache
- The typical guest profile for Airbnb in Larache consists of predominantly international visitors (87%), with top international origins including Spain, typically belonging to the Post-2000s (Gen Z/Alpha) group (50%), primarily speaking English or French.
- Domestic travelers account for 13.4% of guests.
- Key international markets include France (33%) and Spain (13.4%).
- Top languages spoken are English (30.3%) followed by French (28.3%).
- A significant demographic segment is the Post-2000s (Gen Z/Alpha) group, representing 50% of guests.
Recommendations for Hosts
- Focus marketing internationally, particularly towards travelers from Spain.
- Tailor amenities and listing descriptions to appeal to the dominant Post-2000s (Gen Z/Alpha) demographic (e.g., highlight fast WiFi, smart home features, local guides).
- Highlight unique local experiences or amenities relevant to the primary guest profile.
- Consider seasonal promotions aligned with peak travel times for key origin markets.
Nearby Short-Term Rental Market Comparison
How does the Larache Airbnb market stack up against its neighbors? Compare key performance metrics like average monthly revenue, ADR, and occupancy rates in surrounding areas to understand the broader regional STR landscape.
| Market | Active Properties | Monthly Revenue | Daily Rate | Avg. Occupancy |
|---|---|---|---|---|
| Benahavís | 518 | $2,914 | $430.92 | 39% |
| El Paraíso | 13 | $2,679 | $369.93 | 45% |
| San Roque | 293 | $2,258 | $329.56 | 39% |
| Gibraltar | 274 | $2,167 | $179.90 | 49% |
| Estepona | 2,341 | $1,956 | $241.97 | 43% |
| Gaucín | 60 | $1,838 | $230.62 | 39% |
| Benalup-Casas Viejas | 57 | $1,812 | $275.24 | 33% |
| El Gastor | 123 | $1,798 | $167.81 | 44% |
| La Línea de la Concepción | 102 | $1,743 | $178.08 | 47% |
| Villamartín | 18 | $1,727 | $293.49 | 28% |