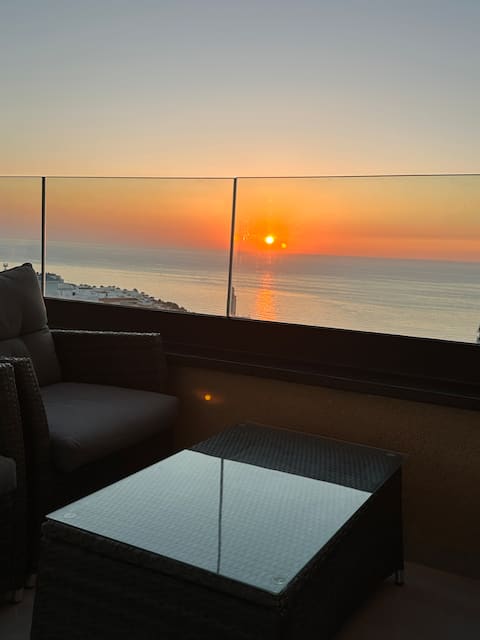
Al Hoceima Airbnb Market Analysis 2026: Short Term Rental Data & Vacation Rental Statistics in Tangier-Tetouan-Al Hoceima, Morocco
Is Airbnb profitable in Al Hoceima in 2026? Explore comprehensive Airbnb analytics for Al Hoceima, Tangier-Tetouan-Al Hoceima, Morocco to uncover income potential. This 2026 STR market report for Al Hoceima, based on AirROI data from February 2025 to January 2026, reveals key trends in the market of 204 active listings.
Whether you're considering an Airbnb investment in Al Hoceima, optimizing your existing vacation rental, or exploring rental arbitrage opportunities, understanding the Al Hoceima Airbnb data is crucial. Leveraging the low regulation environment is key to maximizing your short term rental income potential. Let's dive into the specifics.
Key Al Hoceima Airbnb Performance Metrics Overview
Monthly Airbnb Revenue Variations & Income Potential in Al Hoceima (2026)
Understanding the monthly revenue variations for Airbnb listings in Al Hoceima is key to maximizing your short term rental income potential. Seasonality significantly impacts earnings. Our analysis, based on data from the past 12 months, shows that the peak revenue month for STRs in Al Hoceima is typically August, while January often presents the lowest earnings, highlighting opportunities for strategic pricing adjustments during shoulder and low seasons. Explore the typical Airbnb income in Al Hoceima across different performance tiers:
- Best-in-class properties (Top 10%) achieve $1,116+ monthly, often utilizing dynamic pricing and superior guest experiences.
- Strong performing properties (Top 25%) earn $677 or more, indicating effective management and desirable locations/amenities.
- Typical properties (Median) generate around $377 per month, representing the average market performance.
- Entry-level properties (Bottom 25%) see earnings around $169, often with potential for optimization.
Average Monthly Airbnb Earnings Trend in Al Hoceima
Al Hoceima Airbnb Occupancy Rate Trends (2026)
Maximize your bookings by understanding the Al Hoceima STR occupancy trends. Seasonal demand shifts significantly influence how often properties are booked. Typically, Augustsees the highest demand (peak season occupancy), while January experiences the lowest (low season). Effective strategies, like adjusting minimum stays or offering promotions, can boost occupancy during slower periods. Here's how different property tiers perform in Al Hoceima:
- Best-in-class properties (Top 10%) achieve 58%+ occupancy, indicating high desirability and potentially optimized availability.
- Strong performing properties (Top 25%) maintain 38% or higher occupancy, suggesting good market fit and guest satisfaction.
- Typical properties (Median) have an occupancy rate around 22%.
- Entry-level properties (Bottom 25%) average 11% occupancy, potentially facing higher vacancy.
Average Monthly Occupancy Rate Trend in Al Hoceima
Average Daily Rate (ADR) Airbnb Trends in Al Hoceima (2026)
Effective short term rental pricing strategy in Al Hoceima involves understanding monthly ADR fluctuations. The Average Daily Rate (ADR) for Airbnb in Al Hoceima typically peaks in August and dips lowest during February. Leveraging Airbnb dynamic pricing tools or strategies based on this seasonality can significantly boost revenue. Here's a look at the typical nightly rates achieved:
- Best-in-class properties (Top 10%) command rates of $112+ per night, often due to premium features or locations.
- Strong performing properties (Top 25%) achieve nightly rates of $85 or more.
- Typical properties (Median) charge around $61 per night.
- Entry-level properties (Bottom 25%) earn around $44 per night.
Average Daily Rate (ADR) Trend by Month in Al Hoceima
Get Live Al Hoceima Market Intelligence 👇

Explore Real-time Analytics
Airbnb Seasonality Analysis & Trends in Al Hoceima (2026)
Peak Season (August, July, June)
- Revenue averages $919 per month
- Occupancy rates average 36.1%
- Daily rates average $80
Shoulder Season
- Revenue averages $456 per month
- Occupancy maintains around 26.4%
- Daily rates hold near $67
Low Season (January, March, November)
- Revenue drops to average $284 per month
- Occupancy decreases to average 21.1%
- Daily rates adjust to average $65
Seasonality Insights for Al Hoceima
- The Airbnb seasonality in Al Hoceima shows highly seasonal trends requiring careful strategy. While the sections above show seasonal averages, it's also insightful to look at the extremes:
- During the high season, the absolute peak month showcases Al Hoceima's highest earning potential, with monthly revenues capable of climbing to $1,256, occupancy reaching a high of 46.7%, and ADRs peaking at $85.
- Conversely, the slowest single month of the year, typically falling within the low season, marks the market's lowest point. In this month, revenue might dip to $183, occupancy could drop to 13.6%, and ADRs may adjust down to $64.
- Understanding both the seasonal averages and these monthly peaks and troughs in revenue, occupancy, and ADR is crucial for maximizing your Airbnb profit potential in Al Hoceima.
Seasonal Strategies for Maximizing Profit
- Peak Season: Maximize revenue through premium pricing and potentially longer minimum stays. Ensure high availability.
- Low Season: Offer competitive pricing, special promotions (e.g., extended stay discounts), and flexible cancellation policies. Target off-season travelers like remote workers or budget-conscious guests.
- Shoulder Seasons: Implement dynamic pricing that balances peak and low rates. Target weekend travelers or specific events. Offer slightly more flexible terms than peak season.
- Regularly analyze your own performance against these Al Hoceima seasonality benchmarks and adjust your pricing and availability strategy accordingly.
Best Areas for Airbnb Investment in Al Hoceima (2026)
Exploring the top neighborhoods for short-term rentals in Al Hoceima? This section highlights key areas, outlining why they are attractive for hosts and guests, along with notable local attractions. Consider these locations based on your target guest profile and investment strategy.
| Neighborhood / Area | Why Host Here? (Target Guests & Appeal) | Key Attractions & Landmarks |
|---|---|---|
| Al Hoceima City Center | The vibrant urban area with shops, restaurants, and close proximity to the beach. Ideal for tourists there to explore local culture and enjoy the seaside. | Al Hoceima Bay, Rif Mountains, Café de la Plage, Corniche, Local markets |
| Taza National Park | A natural haven for outdoor enthusiasts and nature lovers. Attracts tourists looking for hiking, picnicking, and exploring stunning landscapes. | Stunning landscapes, Wildlife viewing, Hiking trails, Picnic areas |
| Cap des Trois Fourches | Known for its breathtaking cliffs and views over the Mediterranean Sea. Great spot for nature lovers and those seeking a serene escape. | Cliff views, Beach access, Diving spots, Nature trails |
| Berkane Beach | Popular coastal retreat with beautiful beachside amenities. Ideal for families and beach lovers looking for a relaxing getaway. | Berkane beach, Watersports, Beachfront cafes, Picnic spots |
| Kariao Beach | A lesser-known beach offering tranquility and scenic views, popular among locals and those seeking solitude by the sea. | Beach walks, Local dining, Quiet retreats |
| Ait Bougamez Valley | Famous for its stunning landscapes and hiking opportunities. A great spot for adventure seekers and those looking to connect with nature. | Hiking, Scenic valleys, Local Berber culture |
| Chefchaouen Day Trip | Although not in Al Hoceima, this picturesque blue city is a popular day trip destination for tourists looking for Instagram-worthy scenery and unique culture. | Blue streets, Rooftop views, Handicrafts, Cafes, Nature hikes |
| Local Markets of Al Hoceima | Great for experiencing local culture and shopping. Attracts visitors looking to buy souvenirs and taste local delicacies. | Souk, Street food, Local crafts |
Understanding Airbnb License Requirements & STR Laws in Al Hoceima (2026)
While Al Hoceima, Tangier-Tetouan-Al Hoceima, Morocco currently shows low STR regulations, specific Airbnb license requirements might still exist or change. Always verify the latest short term rental regulations and Airbnb license requirements directly with local government authorities for Al Hoceima to ensure full compliance before hosting.
(Source: AirROI data, 2026, based on 0% licensed listings)
Top Performing Airbnb Properties in Al Hoceima (2026)
Benchmark your potential! Explore examples of top-performing Airbnb properties in Al Hoceimabased on Trailing Twelve Month (TTM) revenue. Analyze their characteristics, revenue, occupancy rate, and ADR to understand what drives success in this market.
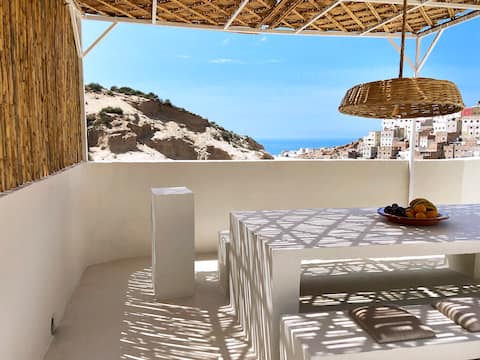
Entire house with private Rooftop terrace
Entire Place • 3 bedrooms
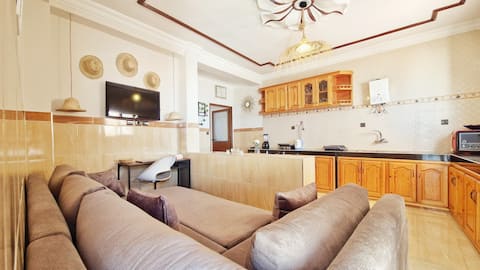
Lovely, Calm Apartment with Sea View
Entire Place • 1 bedroom
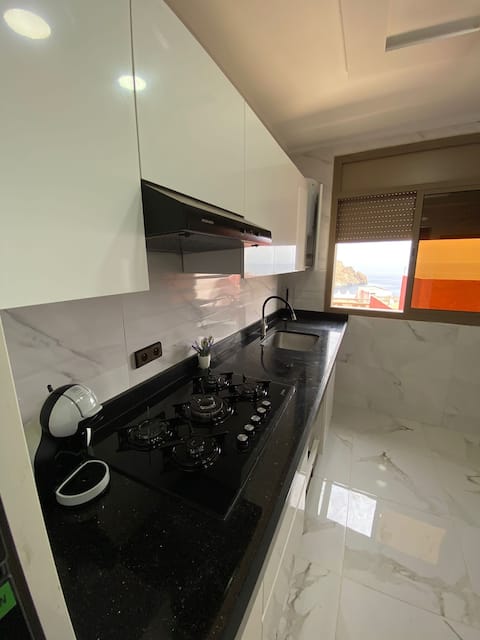
Beautiful Perle Bleu 3 Apartment
Entire Place • 2 bedrooms
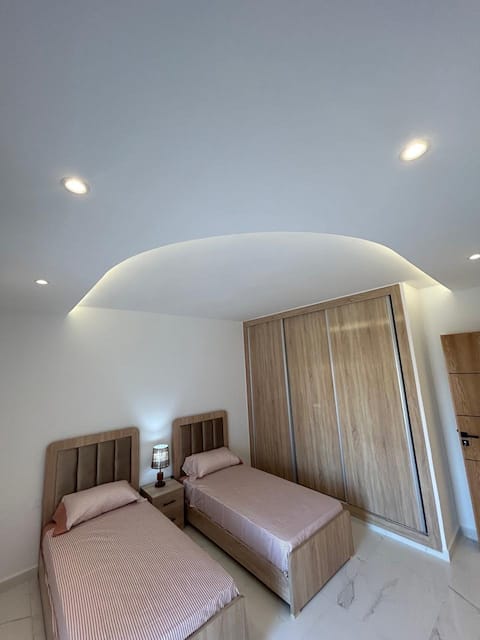
The apartment in downtown Alhucemas 2
Entire Place • 2 bedrooms
Welcome to THE VIEW!
Entire Place • 3 bedrooms
Beautiful Blue Pearl Apartment 1
Entire Place • 2 bedrooms
Note: Performance varies based on location, size, amenities, seasonality, and management quality. Data reflects the past 12 months.
Top Performing Airbnb Hosts in Al Hoceima (2026)
Learn from the best! This table showcases top-performing Airbnb hosts in Al Hoceima based on the number of properties managed and estimated total revenue over the past year. Analyze their scale and performance metrics.
| Host Name | Properties | Grossing Revenue | Stay Reviews | Avg Rating |
|---|---|---|---|---|
| Mustapha | 1 | $36,167 | 72 | 4.96/5.0 |
| Hayat | 17 | $35,245 | 538 | 4.76/5.0 |
| Mohamed | 3 | $35,005 | 449 | 4.83/5.0 |
| Zakaria | 5 | $26,721 | 208 | 4.94/5.0 |
| Anwar | 5 | $22,804 | 69 | 4.92/5.0 |
| Amine | 2 | $20,977 | 156 | 4.95/5.0 |
| Achraf | 9 | $16,625 | 216 | 4.32/5.0 |
| Mounir | 3 | $15,030 | 73 | 4.90/5.0 |
| Nasser | 6 | $14,941 | 129 | 4.79/5.0 |
| Nada | 3 | $14,424 | 174 | 4.77/5.0 |
Analyzing the strategies of top hosts, such as their property selection, pricing, and guest communication, can offer valuable lessons for optimizing your own Airbnb operations in Al Hoceima.
Dive Deeper: Advanced Al Hoceima STR Market Data (2026)
Ready to unlock more insights? AirROI provides access to advanced metrics and comprehensive Airbnb data for Al Hoceima. Explore detailed analytics beyond this report to refine your investment strategy, optimize pricing, and maximize your vacation rental profits.
Explore Advanced MetricsAl Hoceima Short-Term Rental Market Composition (2026): Property & Room Types
Room Type Distribution
Property Type Distribution
Market Composition Insights for Al Hoceima
- The Al Hoceima Airbnb market composition is heavily skewed towards Entire Home/Apt listings, which make up 99.5% of the 204 active rentals. This indicates strong guest preference for privacy and space.
- Looking at the property type distribution in Al Hoceima, Apartment/Condo properties are the most common (94.1%), reflecting the local real estate landscape.
- Smaller segments like house, hotel/boutique, outdoor/unique (combined 5.9%) offer potential for unique stay experiences.
Al Hoceima Airbnb Room Capacity Analysis (2026): Bedroom Distribution
Distribution of Listings by Number of Bedrooms
Room Capacity Insights for Al Hoceima
- The dominant room capacity in Al Hoceima is 2 bedrooms listings, making up 63.7% of the market. This suggests a strong demand for properties suitable for couples or solo travelers.
- Together, 2 bedrooms and 1 bedroom properties represent 84.8% of the active Airbnb listings in Al Hoceima, indicating a high concentration in these sizes.
Al Hoceima Vacation Rental Guest Capacity Trends (2026)
Distribution of Listings by Guest Capacity
Guest Capacity Insights for Al Hoceima
- The most common guest capacity trend in Al Hoceima vacation rentals is listings accommodating 4 guests (27.5%). This suggests the primary traveler segment is likely small families or groups.
- Properties designed for 4 guests and 5 guests dominate the Al Hoceima STR market, accounting for 53.5% of listings.
- 35.8% of properties accommodate 6+ guests, serving the market segment for larger families or group travel in Al Hoceima.
- On average, properties in Al Hoceima are equipped to host 5.1 guests.
Al Hoceima Airbnb Booking Patterns (2026): Available vs. Booked Days
Available Days Distribution
Booked Days Distribution
Booking Pattern Insights for Al Hoceima
- The most common availability pattern in Al Hoceima falls within the 271-366 days range, representing 90.7% of listings. This suggests many properties have significant open periods on their calendars.
- Approximately 99.0% of listings show high availability (181+ days open annually), indicating potential for increased bookings or specific owner usage patterns.
- For booked days, the 1-30 days range is most frequent in Al Hoceima (51.5%), reflecting common guest stay durations or potential owner blocking patterns.
- A notable 1.0% of properties secure long booking periods (181+ days booked per year), highlighting successful long-term rental strategies or significant owner usage.
Al Hoceima Airbnb Minimum Stay Requirements Analysis
Distribution of Listings by Minimum Night Requirement
1 Night
95 listings
46.6% of total
2 Nights
23 listings
11.3% of total
3 Nights
12 listings
5.9% of total
4-6 Nights
5 listings
2.5% of total
7-29 Nights
1 listings
0.5% of total
30+ Nights
68 listings
33.3% of total
Key Insights
- The most prevalent minimum stay requirement in Al Hoceima is 1 Night, adopted by 46.6% of listings. This highlights the market's preference for shorter, flexible bookings.
- A significant segment (33.3%) caters to monthly stays (30+ nights) in Al Hoceima, pointing to opportunities in the extended-stay market.
Recommendations
- Align with the market by considering a 1 Night minimum stay, as 46.6% of Al Hoceima hosts use this setting.
- Explore offering discounts for stays of 30+ nights to attract the 33.3% of the market seeking extended stays.
- Adjust minimum nights based on seasonality – potentially shorter during low season and longer during peak demand periods in Al Hoceima.
Al Hoceima Airbnb Cancellation Policy Trends Analysis (2026)
Limited
8 listings
3.9% of total
Flexible
102 listings
50% of total
Moderate
28 listings
13.7% of total
Firm
56 listings
27.5% of total
Strict
10 listings
4.9% of total
Cancellation Policy Insights for Al Hoceima
- The prevailing Airbnb cancellation policy trend in Al Hoceima is Flexible, used by 50% of listings.
- There's a relatively balanced mix between guest-friendly (63.7%) and stricter (32.4%) policies, offering choices for different guest needs.
- Strict cancellation policies are quite rare (4.9%), potentially making listings with this policy less competitive unless justified by high demand or property type.
Recommendations for Hosts
- Consider adopting a Flexible policy to align with the 50% market standard in Al Hoceima.
- Using a Strict policy might deter some guests, as only 4.9% of listings use it. Evaluate if potential revenue protection outweighs possible lower booking rates.
- Regularly review your cancellation policy against competitors and market demand shifts in Al Hoceima.
Al Hoceima STR Booking Lead Time Analysis (2026)
Average Booking Lead Time by Month
Booking Lead Time Insights for Al Hoceima
- The overall average booking lead time for vacation rentals in Al Hoceima is 28 days.
- Guests book furthest in advance for stays during January (average 40 days), likely coinciding with peak travel demand or local events.
- The shortest booking windows occur for stays in February (average 10 days), indicating more last-minute travel plans during this time.
- Seasonally, Summer (31 days avg.) sees the longest lead times, while Winter (21 days avg.) has the shortest, reflecting typical travel planning cycles.
Recommendations for Hosts
- Use the overall average lead time (28 days) as a baseline for your pricing and availability strategy in Al Hoceima.
- For January stays, consider implementing length-of-stay discounts or slightly higher rates for bookings made less than 40 days out to capitalize on advance planning.
- During February, focus on last-minute booking availability and promotions, as guests book with very short notice (10 days avg.).
- Target marketing efforts for the Summer season well in advance (at least 31 days) to capture early planners.
- Monitor your own booking lead times against these Al Hoceima averages to identify opportunities for dynamic pricing adjustments.
Popular & Essential Airbnb Amenities in Al Hoceima (2026)
Amenity Prevalence
Amenity Insights for Al Hoceima
- Essential amenities in Al Hoceima that guests expect include: Kitchen, TV. Lacking these (any) could significantly impact bookings.
- Popular amenities like Washer, Wifi, Hot water are common but not universal. Offering these can provide a competitive edge.
- Warning: Wifi is not universally provided but is considered essential globally. Ensure reliable Wifi is offered.
Recommendations for Hosts
- Ensure your listing includes all essential amenities for Al Hoceima: Kitchen, TV.
- Prioritize adding missing essentials: Kitchen, TV.
- Consider adding popular differentiators like Washer or Wifi to increase appeal.
- Highlight unique or less common amenities you offer (e.g., hot tub, dedicated workspace, EV charger) in your listing description and photos.
- Regularly check competitor amenities in Al Hoceima to stay competitive.
Al Hoceima Airbnb Guest Demographics & Profile Analysis (2026)
Guest Profile Summary for Al Hoceima
- The typical guest profile for Airbnb in Al Hoceima consists of predominantly international visitors (86%), with top international origins including Morocco, typically belonging to the Post-2000s (Gen Z/Alpha) group (50%), primarily speaking English or French.
- Domestic travelers account for 14.5% of guests.
- Key international markets include France (45.3%) and Morocco (14.5%).
- Top languages spoken are English (30.7%) followed by French (26.5%).
- A significant demographic segment is the Post-2000s (Gen Z/Alpha) group, representing 50% of guests.
Recommendations for Hosts
- Focus marketing internationally, particularly towards travelers from Morocco.
- Tailor amenities and listing descriptions to appeal to the dominant Post-2000s (Gen Z/Alpha) demographic (e.g., highlight fast WiFi, smart home features, local guides).
- Highlight unique local experiences or amenities relevant to the primary guest profile.
- Consider seasonal promotions aligned with peak travel times for key origin markets.
Nearby Short-Term Rental Market Comparison
How does the Al Hoceima Airbnb market stack up against its neighbors? Compare key performance metrics like average monthly revenue, ADR, and occupancy rates in surrounding areas to understand the broader regional STR landscape.
| Market | Active Properties | Monthly Revenue | Daily Rate | Avg. Occupancy |
|---|---|---|---|---|
| Cártama | 48 | $4,137 | $378.39 | 45% |
| Alhaurín de la Torre | 210 | $3,716 | $325.91 | 46% |
| Alhaurín el Grande | 271 | $3,613 | $310.22 | 46% |
| Casarabonela | 24 | $3,495 | $286.94 | 39% |
| Marbella | 5,279 | $2,756 | $342.36 | 42% |
| Coín | 119 | $2,388 | $303.70 | 41% |
| Ojén | 136 | $2,305 | $244.23 | 44% |
| Málaga | 8,177 | $2,191 | $175.56 | 52% |
| Almogía | 45 | $2,168 | $301.25 | 37% |
| San Pedro de Alcántara | 16 | $2,167 | $372.89 | 37% |