Rabat Airbnb Market Analysis 2026: Short Term Rental Data & Vacation Rental Statistics in Rabat-Salé-Kénitra, Morocco
Is Airbnb profitable in Rabat in 2026? Explore comprehensive Airbnb analytics for Rabat, Rabat-Salé-Kénitra, Morocco to uncover income potential. This 2026 STR market report for Rabat, based on AirROI data from February 2025 to January 2026, reveals key trends in the bustling market of 1,432 active listings.
Whether you're considering an Airbnb investment in Rabat, optimizing your existing vacation rental, or exploring rental arbitrage opportunities, understanding the Rabat Airbnb data is crucial. Leveraging the low regulation environment is key to maximizing your short term rental income potential. Let's dive into the specifics.
Key Rabat Airbnb Performance Metrics Overview
Monthly Airbnb Revenue Variations & Income Potential in Rabat (2026)
Understanding the monthly revenue variations for Airbnb listings in Rabat is key to maximizing your short term rental income potential. Seasonality significantly impacts earnings. Our analysis, based on data from the past 12 months, shows that the peak revenue month for STRs in Rabat is typically December, while March often presents the lowest earnings, highlighting opportunities for strategic pricing adjustments during shoulder and low seasons. Explore the typical Airbnb income in Rabat across different performance tiers:
- Best-in-class properties (Top 10%) achieve $2,195+ monthly, often utilizing dynamic pricing and superior guest experiences.
- Strong performing properties (Top 25%) earn $1,446 or more, indicating effective management and desirable locations/amenities.
- Typical properties (Median) generate around $841 per month, representing the average market performance.
- Entry-level properties (Bottom 25%) see earnings around $390, often with potential for optimization.
Average Monthly Airbnb Earnings Trend in Rabat
Rabat Airbnb Occupancy Rate Trends (2026)
Maximize your bookings by understanding the Rabat STR occupancy trends. Seasonal demand shifts significantly influence how often properties are booked. Typically, Julysees the highest demand (peak season occupancy), while March experiences the lowest (low season). Effective strategies, like adjusting minimum stays or offering promotions, can boost occupancy during slower periods. Here's how different property tiers perform in Rabat:
- Best-in-class properties (Top 10%) achieve 80%+ occupancy, indicating high desirability and potentially optimized availability.
- Strong performing properties (Top 25%) maintain 62% or higher occupancy, suggesting good market fit and guest satisfaction.
- Typical properties (Median) have an occupancy rate around 39%.
- Entry-level properties (Bottom 25%) average 19% occupancy, potentially facing higher vacancy.
Average Monthly Occupancy Rate Trend in Rabat
Average Daily Rate (ADR) Airbnb Trends in Rabat (2026)
Effective short term rental pricing strategy in Rabat involves understanding monthly ADR fluctuations. The Average Daily Rate (ADR) for Airbnb in Rabat typically peaks in January and dips lowest during March. Leveraging Airbnb dynamic pricing tools or strategies based on this seasonality can significantly boost revenue. Here's a look at the typical nightly rates achieved:
- Best-in-class properties (Top 10%) command rates of $148+ per night, often due to premium features or locations.
- Strong performing properties (Top 25%) achieve nightly rates of $103 or more.
- Typical properties (Median) charge around $71 per night.
- Entry-level properties (Bottom 25%) earn around $48 per night.
Average Daily Rate (ADR) Trend by Month in Rabat
Get Live Rabat Market Intelligence 👇

Explore Real-time Analytics
Airbnb Seasonality Analysis & Trends in Rabat (2026)
Peak Season (December, July, August)
- Revenue averages $1,392 per month
- Occupancy rates average 46.3%
- Daily rates average $94
Shoulder Season
- Revenue averages $1,045 per month
- Occupancy maintains around 41.0%
- Daily rates hold near $91
Low Season (February, March, May)
- Revenue drops to average $821 per month
- Occupancy decreases to average 39.5%
- Daily rates adjust to average $77
Seasonality Insights for Rabat
- The Airbnb seasonality in Rabat shows highly seasonal trends requiring careful strategy. While the sections above show seasonal averages, it's also insightful to look at the extremes:
- During the high season, the absolute peak month showcases Rabat's highest earning potential, with monthly revenues capable of climbing to $1,466, occupancy reaching a high of 49.0%, and ADRs peaking at $108.
- Conversely, the slowest single month of the year, typically falling within the low season, marks the market's lowest point. In this month, revenue might dip to $694, occupancy could drop to 34.0%, and ADRs may adjust down to $75.
- Understanding both the seasonal averages and these monthly peaks and troughs in revenue, occupancy, and ADR is crucial for maximizing your Airbnb profit potential in Rabat.
Seasonal Strategies for Maximizing Profit
- Peak Season: Maximize revenue through premium pricing and potentially longer minimum stays. Ensure high availability.
- Low Season: Offer competitive pricing, special promotions (e.g., extended stay discounts), and flexible cancellation policies. Target off-season travelers like remote workers or budget-conscious guests.
- Shoulder Seasons: Implement dynamic pricing that balances peak and low rates. Target weekend travelers or specific events. Offer slightly more flexible terms than peak season.
- Regularly analyze your own performance against these Rabat seasonality benchmarks and adjust your pricing and availability strategy accordingly.
Best Areas for Airbnb Investment in Rabat (2026)
Exploring the top neighborhoods for short-term rentals in Rabat? This section highlights key areas, outlining why they are attractive for hosts and guests, along with notable local attractions. Consider these locations based on your target guest profile and investment strategy.
| Neighborhood / Area | Why Host Here? (Target Guests & Appeal) | Key Attractions & Landmarks |
|---|---|---|
| Agdal | A vibrant neighborhood popular among students and young professionals, Agdal is known for its cafes, restaurants, and close proximity to several universities. The area attracts both local and international tourists seeking a lively atmosphere with modern conveniences. | Jardin d'Essais botanique, Hassan II Tower, Café la Comédie, Agdal Park, Universities and schools |
| Old Medina | The historic heart of Rabat, the Old Medina offers an authentic Moroccan experience with winding alleys, traditional markets, and stunning architecture. This area is highly sought after by tourists looking to immerse themselves in the culture and history of Morocco. | Kasbah of the Udayas, Hassan Tower, Royal Palace of Rabat, Medina markets, Mausoleum of Mohammed V |
| Hay Riad | A modern residential district that is known for its upscale homes and amenities. It's a quieter area that appeals to families and expatriates, making it a great choice for longer stays or business travelers. | Rabat International Golf Club, Shopping centers, Parks and recreational areas |
| Chellah | An archaeological site and garden where ancient Roman ruins and Islamic architecture blend. It's a peaceful area away from the hustle and bustle of the city, attracting visitors interested in history and nature. | Chellah Necropolis, Ancient Roman ruins, Gardens and quiet pathways |
| L'Ocean | This coastal area offers beautiful beaches and a more relaxed atmosphere, drawing visitors looking for beach escapes combined with city life. It's known for its picturesque views and seaside activities. | Rabat Beach, Cinemas and restaurants along the coast, Water sports and activities |
| Rabat Ville | The main city area with a mix of culture, shopping, and entertainment. It's convenient for tourists who want to be in the center of action with access to public transport and main attractions. | Shopping malls, Cafés and restaurants, Cultural events and festivals |
| Salé | Located just across the river from Rabat, Salé is known for its traditional Moroccan feel, historic sites, and close-knit community vibe. It offers a different perspective of Moroccan culture while being just a short distance from the capital. | Old Medina of Salé, Borj El Kebir, Cultural exhibitions |
| Boulevard Mohammed V | A bustling area with shops, cafes, and cultural venues, this boulevard is ideal for travelers wanting to experience the local lifestyle and enjoy easy access to various urban offerings. | Theatre Mohammed V, Art galleries, Dining and shopping options |
Understanding Airbnb License Requirements & STR Laws in Rabat (2026)
While Rabat, Rabat-Salé-Kénitra, Morocco currently shows low STR regulations, specific Airbnb license requirements might still exist or change. Always verify the latest short term rental regulations and Airbnb license requirements directly with local government authorities for Rabat to ensure full compliance before hosting.
(Source: AirROI data, 2026, based on 0% licensed listings)
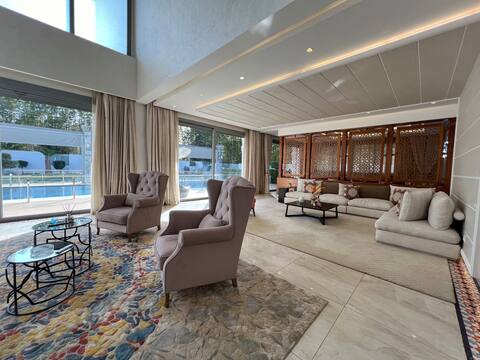
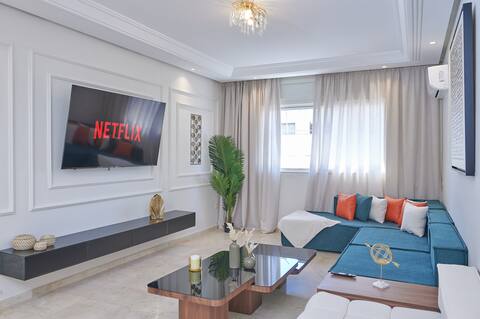
Top Performing Airbnb Properties in Rabat (2026)
Benchmark your potential! Explore examples of top-performing Airbnb properties in Rabatbased on Trailing Twelve Month (TTM) revenue. Analyze their characteristics, revenue, occupancy rate, and ADR to understand what drives success in this market.
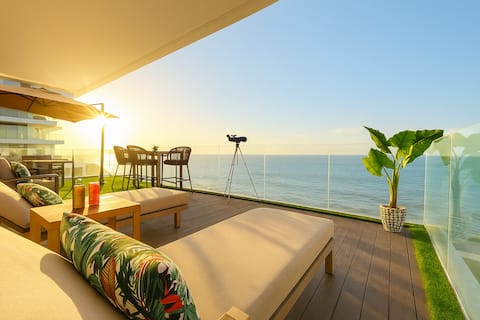
BlueVista - Yacht like Escape with Ocean Views
Entire Place • 2 bedrooms

Dar Rabiaa: Authentic Riad with Pool
Entire Place • 6 bedrooms
Villa Daressalam
Entire Place • 5 bedrooms
Luxury 4BR Agdal + Pkg + Walk to the Mall & Center
Entire Place • 4 bedrooms

Riad Ikbal in the heart of the Rabat medina
Entire Place • 6 bedrooms

GoodMove Modern 3BR with balcony view in Hay Riad
Entire Place • 3 bedrooms
Note: Performance varies based on location, size, amenities, seasonality, and management quality. Data reflects the past 12 months.
Top Performing Airbnb Hosts in Rabat (2026)
Learn from the best! This table showcases top-performing Airbnb hosts in Rabat based on the number of properties managed and estimated total revenue over the past year. Analyze their scale and performance metrics.
| Host Name | Properties | Grossing Revenue | Stay Reviews | Avg Rating |
|---|---|---|---|---|
| Goodmove | 33 | $654,496 | 1920 | 4.80/5.0 |
| Yann | 41 | $476,246 | 1649 | 4.82/5.0 |
| Tarik | 38 | $350,807 | 2508 | 4.63/5.0 |
| Mehdi | 16 | $336,746 | 410 | 4.71/5.0 |
| Anis YourPlace | 15 | $263,272 | 399 | 4.72/5.0 |
| Mohammed Amine | 7 | $167,462 | 220 | 4.93/5.0 |
| Sandra | 11 | $130,555 | 1660 | 4.80/5.0 |
| Zineb | 13 | $128,339 | 536 | 4.76/5.0 |
| Othmane | 11 | $123,433 | 552 | 4.78/5.0 |
| Yassin | 13 | $116,732 | 342 | 4.63/5.0 |
Analyzing the strategies of top hosts, such as their property selection, pricing, and guest communication, can offer valuable lessons for optimizing your own Airbnb operations in Rabat.
Dive Deeper: Advanced Rabat STR Market Data (2026)
Ready to unlock more insights? AirROI provides access to advanced metrics and comprehensive Airbnb data for Rabat. Explore detailed analytics beyond this report to refine your investment strategy, optimize pricing, and maximize your vacation rental profits.
Explore Advanced MetricsRabat Short-Term Rental Market Composition (2026): Property & Room Types
Room Type Distribution
Property Type Distribution
Market Composition Insights for Rabat
- The Rabat Airbnb market composition is heavily skewed towards Entire Home/Apt listings, which make up 84% of the 1,432 active rentals. This indicates strong guest preference for privacy and space.
- Looking at the property type distribution in Rabat, Apartment/Condo properties are the most common (83.5%), reflecting the local real estate landscape.
- Smaller segments like hotel/boutique, unique stays, others, outdoor/unique (combined 7.3%) offer potential for unique stay experiences.
Rabat Airbnb Room Capacity Analysis (2026): Bedroom Distribution
Distribution of Listings by Number of Bedrooms
Room Capacity Insights for Rabat
- The dominant room capacity in Rabat is 1 bedroom listings, making up 42.9% of the market. This suggests a strong demand for properties suitable for couples or solo travelers.
- Together, 1 bedroom and 2 bedrooms properties represent 73.5% of the active Airbnb listings in Rabat, indicating a high concentration in these sizes.
Rabat Vacation Rental Guest Capacity Trends (2026)
Distribution of Listings by Guest Capacity
Guest Capacity Insights for Rabat
- The most common guest capacity trend in Rabat vacation rentals is listings accommodating 4 guests (23.6%). This suggests the primary traveler segment is likely small families or groups.
- Properties designed for 4 guests and 2 guests dominate the Rabat STR market, accounting for 44.2% of listings.
- 17.6% of properties accommodate 6+ guests, serving the market segment for larger families or group travel in Rabat.
- On average, properties in Rabat are equipped to host 3.5 guests.
Rabat Airbnb Booking Patterns (2026): Available vs. Booked Days
Available Days Distribution
Booked Days Distribution
Booking Pattern Insights for Rabat
- The most common availability pattern in Rabat falls within the 271-366 days range, representing 48.7% of listings. This suggests many properties have significant open periods on their calendars.
- Approximately 81.7% of listings show high availability (181+ days open annually), indicating potential for increased bookings or specific owner usage patterns.
- For booked days, the 91-180 days range is most frequent in Rabat (33%), reflecting common guest stay durations or potential owner blocking patterns.
- A notable 19.4% of properties secure long booking periods (181+ days booked per year), highlighting successful long-term rental strategies or significant owner usage.
Rabat Airbnb Minimum Stay Requirements Analysis
Distribution of Listings by Minimum Night Requirement
1 Night
649 listings
45.3% of total
2 Nights
292 listings
20.4% of total
3 Nights
70 listings
4.9% of total
4-6 Nights
63 listings
4.4% of total
7-29 Nights
25 listings
1.7% of total
30+ Nights
333 listings
23.3% of total
Key Insights
- The most prevalent minimum stay requirement in Rabat is 1 Night, adopted by 45.3% of listings. This highlights the market's preference for shorter, flexible bookings.
- A strong majority (65.7%) of the Rabat Airbnb data shows acceptance of very short stays (1-2 nights), indicating a dynamic, high-turnover market.
- A significant segment (23.3%) caters to monthly stays (30+ nights) in Rabat, pointing to opportunities in the extended-stay market.
Recommendations
- Align with the market by considering a 1 Night minimum stay, as 45.3% of Rabat hosts use this setting.
- Explore offering discounts for stays of 30+ nights to attract the 23.3% of the market seeking extended stays.
- Adjust minimum nights based on seasonality – potentially shorter during low season and longer during peak demand periods in Rabat.
Rabat Airbnb Cancellation Policy Trends Analysis (2026)
Limited
75 listings
5.3% of total
Super Strict 30 Days
1 listings
0.1% of total
Flexible
592 listings
41.5% of total
Moderate
377 listings
26.4% of total
Firm
326 listings
22.8% of total
Strict
56 listings
3.9% of total
Cancellation Policy Insights for Rabat
- The prevailing Airbnb cancellation policy trend in Rabat is Flexible, used by 41.5% of listings.
- There's a relatively balanced mix between guest-friendly (67.9%) and stricter (26.7%) policies, offering choices for different guest needs.
- Strict cancellation policies are quite rare (3.9%), potentially making listings with this policy less competitive unless justified by high demand or property type.
Recommendations for Hosts
- Consider adopting a Flexible policy to align with the 41.5% market standard in Rabat.
- Using a Strict policy might deter some guests, as only 3.9% of listings use it. Evaluate if potential revenue protection outweighs possible lower booking rates.
- Regularly review your cancellation policy against competitors and market demand shifts in Rabat.
Rabat STR Booking Lead Time Analysis (2026)
Average Booking Lead Time by Month
Booking Lead Time Insights for Rabat
- The overall average booking lead time for vacation rentals in Rabat is 26 days.
- Guests book furthest in advance for stays during December (average 44 days), likely coinciding with peak travel demand or local events.
- The shortest booking windows occur for stays in February (average 14 days), indicating more last-minute travel plans during this time.
- Seasonally, Winter (29 days avg.) sees the longest lead times, while Spring (20 days avg.) has the shortest, reflecting typical travel planning cycles.
Recommendations for Hosts
- Use the overall average lead time (26 days) as a baseline for your pricing and availability strategy in Rabat.
- For December stays, consider implementing length-of-stay discounts or slightly higher rates for bookings made less than 44 days out to capitalize on advance planning.
- During February, focus on last-minute booking availability and promotions, as guests book with very short notice (14 days avg.).
- Target marketing efforts for the Winter season well in advance (at least 29 days) to capture early planners.
- Monitor your own booking lead times against these Rabat averages to identify opportunities for dynamic pricing adjustments.
Popular & Essential Airbnb Amenities in Rabat (2026)
Amenity Prevalence
Amenity Insights for Rabat
- Essential amenities in Rabat that guests expect include: Wifi. Lacking these (this) could significantly impact bookings.
- Popular amenities like Kitchen, TV, Hot water are common but not universal. Offering these can provide a competitive edge.
Recommendations for Hosts
- Ensure your listing includes all essential amenities for Rabat: Wifi.
- Prioritize adding missing essentials: Wifi.
- Consider adding popular differentiators like Kitchen or TV to increase appeal.
- Highlight unique or less common amenities you offer (e.g., hot tub, dedicated workspace, EV charger) in your listing description and photos.
- Regularly check competitor amenities in Rabat to stay competitive.
Rabat Airbnb Guest Demographics & Profile Analysis (2026)
Guest Profile Summary for Rabat
- The typical guest profile for Airbnb in Rabat consists of predominantly international visitors (86%), with top international origins including Morocco, typically belonging to the Post-2000s (Gen Z/Alpha) group (50%), primarily speaking English or French.
- Domestic travelers account for 13.7% of guests.
- Key international markets include France (33.2%) and Morocco (13.7%).
- Top languages spoken are English (34.2%) followed by French (25.1%).
- A significant demographic segment is the Post-2000s (Gen Z/Alpha) group, representing 50% of guests.
Recommendations for Hosts
- Focus marketing internationally, particularly towards travelers from Morocco.
- Tailor amenities and listing descriptions to appeal to the dominant Post-2000s (Gen Z/Alpha) demographic (e.g., highlight fast WiFi, smart home features, local guides).
- Highlight unique local experiences or amenities relevant to the primary guest profile.
- Consider seasonal promotions aligned with peak travel times for key origin markets.
Nearby Short-Term Rental Market Comparison
How does the Rabat Airbnb market stack up against its neighbors? Compare key performance metrics like average monthly revenue, ADR, and occupancy rates in surrounding areas to understand the broader regional STR landscape.
| Market | Active Properties | Monthly Revenue | Daily Rate | Avg. Occupancy |
|---|---|---|---|---|
| Shoul السهول | 10 | $1,584 | $159.25 | 41% |
| Sahel Chamali الساحل الشمالي | 34 | $1,209 | $152.65 | 31% |
| Bouskoura | 46 | $1,132 | $130.77 | 41% |
| Al Bahraoyine | 25 | $1,129 | $221.49 | 33% |
| Talambote | 12 | $892 | $140.90 | 26% |
| Oulad Azzouz ⵡⵍⴰⴷ ⵄⵣⵣⵓⵣ أولاد عزوز | 13 | $812 | $161.42 | 31% |
| Harhoura | 132 | $789 | $114.80 | 34% |
| Ameur عامر | 62 | $785 | $129.87 | 34% |
| Tangier | 2,828 | $764 | $101.23 | 36% |
| Sidi Taibi | 19 | $741 | $155.32 | 29% |