Salé Airbnb Market Analysis 2026: Short Term Rental Data & Vacation Rental Statistics in Rabat-Salé-Kénitra, Morocco
Is Airbnb profitable in Salé in 2026? Explore comprehensive Airbnb analytics for Salé, Rabat-Salé-Kénitra, Morocco to uncover income potential. This 2026 STR market report for Salé, based on AirROI data from February 2025 to January 2026, reveals key trends in the niche market of 194 active listings.
Whether you're considering an Airbnb investment in Salé, optimizing your existing vacation rental, or exploring rental arbitrage opportunities, understanding the Salé Airbnb data is crucial. Leveraging the low regulation environment is key to maximizing your short term rental income potential. Let's dive into the specifics.
Key Salé Airbnb Performance Metrics Overview
Monthly Airbnb Revenue Variations & Income Potential in Salé (2026)
Understanding the monthly revenue variations for Airbnb listings in Salé is key to maximizing your short term rental income potential. Seasonality significantly impacts earnings. Our analysis, based on data from the past 12 months, shows that the peak revenue month for STRs in Salé is typically July, while March often presents the lowest earnings, highlighting opportunities for strategic pricing adjustments during shoulder and low seasons. Explore the typical Airbnb income in Salé across different performance tiers:
- Best-in-class properties (Top 10%) achieve $1,606+ monthly, often utilizing dynamic pricing and superior guest experiences.
- Strong performing properties (Top 25%) earn $1,037 or more, indicating effective management and desirable locations/amenities.
- Typical properties (Median) generate around $563 per month, representing the average market performance.
- Entry-level properties (Bottom 25%) see earnings around $265, often with potential for optimization.
Average Monthly Airbnb Earnings Trend in Salé
Salé Airbnb Occupancy Rate Trends (2026)
Maximize your bookings by understanding the Salé STR occupancy trends. Seasonal demand shifts significantly influence how often properties are booked. Typically, Augustsees the highest demand (peak season occupancy), while January experiences the lowest (low season). Effective strategies, like adjusting minimum stays or offering promotions, can boost occupancy during slower periods. Here's how different property tiers perform in Salé:
- Best-in-class properties (Top 10%) achieve 76%+ occupancy, indicating high desirability and potentially optimized availability.
- Strong performing properties (Top 25%) maintain 56% or higher occupancy, suggesting good market fit and guest satisfaction.
- Typical properties (Median) have an occupancy rate around 33%.
- Entry-level properties (Bottom 25%) average 16% occupancy, potentially facing higher vacancy.
Average Monthly Occupancy Rate Trend in Salé
Average Daily Rate (ADR) Airbnb Trends in Salé (2026)
Effective short term rental pricing strategy in Salé involves understanding monthly ADR fluctuations. The Average Daily Rate (ADR) for Airbnb in Salé typically peaks in December and dips lowest during March. Leveraging Airbnb dynamic pricing tools or strategies based on this seasonality can significantly boost revenue. Here's a look at the typical nightly rates achieved:
- Best-in-class properties (Top 10%) command rates of $124+ per night, often due to premium features or locations.
- Strong performing properties (Top 25%) achieve nightly rates of $78 or more.
- Typical properties (Median) charge around $56 per night.
- Entry-level properties (Bottom 25%) earn around $38 per night.
Average Daily Rate (ADR) Trend by Month in Salé
Get Live Salé Market Intelligence 👇

Explore Real-time Analytics
Airbnb Seasonality Analysis & Trends in Salé (2026)
Peak Season (July, August, December)
- Revenue averages $1,100 per month
- Occupancy rates average 43.9%
- Daily rates average $80
Shoulder Season
- Revenue averages $714 per month
- Occupancy maintains around 36.3%
- Daily rates hold near $74
Low Season (February, March, May)
- Revenue drops to average $634 per month
- Occupancy decreases to average 35.4%
- Daily rates adjust to average $67
Seasonality Insights for Salé
- The Airbnb seasonality in Salé shows highly seasonal trends requiring careful strategy. While the sections above show seasonal averages, it's also insightful to look at the extremes:
- During the high season, the absolute peak month showcases Salé's highest earning potential, with monthly revenues capable of climbing to $1,150, occupancy reaching a high of 45.8%, and ADRs peaking at $86.
- Conversely, the slowest single month of the year, typically falling within the low season, marks the market's lowest point. In this month, revenue might dip to $581, occupancy could drop to 33.0%, and ADRs may adjust down to $65.
- Understanding both the seasonal averages and these monthly peaks and troughs in revenue, occupancy, and ADR is crucial for maximizing your Airbnb profit potential in Salé.
Seasonal Strategies for Maximizing Profit
- Peak Season: Maximize revenue through premium pricing and potentially longer minimum stays. Ensure high availability.
- Low Season: Offer competitive pricing, special promotions (e.g., extended stay discounts), and flexible cancellation policies. Target off-season travelers like remote workers or budget-conscious guests.
- Shoulder Seasons: Implement dynamic pricing that balances peak and low rates. Target weekend travelers or specific events. Offer slightly more flexible terms than peak season.
- Regularly analyze your own performance against these Salé seasonality benchmarks and adjust your pricing and availability strategy accordingly.
Best Areas for Airbnb Investment in Salé (2026)
Exploring the top neighborhoods for short-term rentals in Salé? This section highlights key areas, outlining why they are attractive for hosts and guests, along with notable local attractions. Consider these locations based on your target guest profile and investment strategy.
| Neighborhood / Area | Why Host Here? (Target Guests & Appeal) | Key Attractions & Landmarks |
|---|---|---|
| Old Medina | A historic area with narrow streets, vibrant markets, and traditional Moroccan architecture. It attracts tourists interested in culture and history, making it a prime location for Airbnb hosting. | Kasbah of the Oudayas, Hassan Tower, Mausoleum of Mohammed V, Souk el Had, Chellah, Royal Palace |
| Agdal | A modern and upscale neighborhood popular among students and young professionals. Close to major universities and attractions, it appeals to both long-term and short-term renters. | Rabat Zoo, Agdal Gardens, Cinemas, Shopping Malls, Restaurants and cafes |
| Salé Beach | Known for its scenic coastline and recreational activities, this area is ideal for those looking for a beach getaway. Perfect for families and tourists wishing to enjoy sun and sea. | Salé Beach, Hassan II Museum, Plage de Temara, Water sports activities, Restaurants along the coast |
| Medina of Salé | This area is rich in history and culture, featuring traditional Moroccan architecture. It's popular with tourists looking for an authentic experience. | Great Mosque of Salé, Rabat-Salé tramway, Wandering Souks, Cultural festivals, Traditional Moroccan eateries |
| Hay Riad | A residential area known for its green spaces and family-friendly environment. It attracts travelers looking for a quieter place to stay while being close to the city center. | Rabat International Golf Club, King Mohammed VI Museum of Modern and Contemporary Art, Lake artificial, Parks, Shopping centers |
| Kénitra | A nearby city with growing popularity for tourists and business travelers. Affordable options make it suitable for budget travelers. | Kénitra Beaches, Port of Kénitra, Ibn Batouta Park, Restaurants and cafés, Cultural sites |
| Sidi Bou Regreg | This area offers a unique blend of modern amenities and natural beauty, making it a popular choice for those wanting to enjoy outdoor activities. | Sidi Bou Regreg Marina, Beaches, Water sports, Parks, Walking trails |
| Talborjt | A new and developing area that appeals to young travelers and expatriates. Prices are competitive, and it’s becoming increasingly popular for short stays. | Local markets, Restaurants, Cafés, Cultural experiences, Accessibility to public transport |
Understanding Airbnb License Requirements & STR Laws in Salé (2026)
While Salé, Rabat-Salé-Kénitra, Morocco currently shows low STR regulations, specific Airbnb license requirements might still exist or change. Always verify the latest short term rental regulations and Airbnb license requirements directly with local government authorities for Salé to ensure full compliance before hosting.
(Source: AirROI data, 2026, finding no licensed listings among those analyzed)
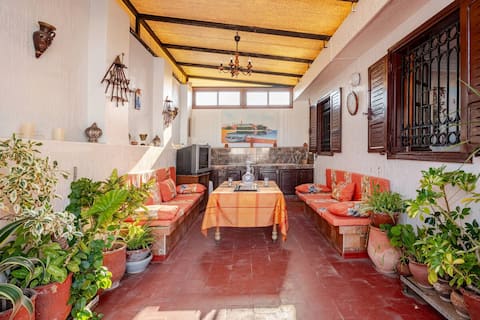
Top Performing Airbnb Properties in Salé (2026)
Benchmark your potential! Explore examples of top-performing Airbnb properties in Salébased on Trailing Twelve Month (TTM) revenue. Analyze their characteristics, revenue, occupancy rate, and ADR to understand what drives success in this market.

The pirates' villa - view of Rabat, swimming pool
Entire Place • 6 bedrooms
Rabat Salé - Layover Guest House Apartment 2
Entire Place • 2 bedrooms
Rabat Salé - Layover Guest House near Airport
Entire Place • 3 bedrooms
Luxurious apartment in Bouregreg Marina
Entire Place • 2 bedrooms
Lovely appartement in the Marina with a great view
Entire Place • 2 bedrooms
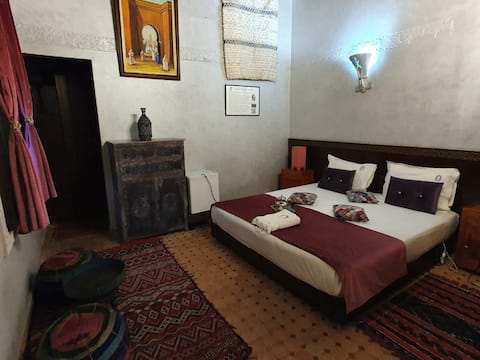
Riad La Porte du Bouregreg, heart of the medina
Private Room • 5 bedrooms
Note: Performance varies based on location, size, amenities, seasonality, and management quality. Data reflects the past 12 months.
Top Performing Airbnb Hosts in Salé (2026)
Learn from the best! This table showcases top-performing Airbnb hosts in Salé based on the number of properties managed and estimated total revenue over the past year. Analyze their scale and performance metrics.
| Host Name | Properties | Grossing Revenue | Stay Reviews | Avg Rating |
|---|---|---|---|---|
| Khalid | 1 | $56,140 | 13 | 5.00/5.0 |
| Mouad | 2 | $51,409 | 72 | 4.78/5.0 |
| Zakaria | 5 | $45,739 | 137 | 4.81/5.0 |
| Goodmove | 2 | $37,956 | 152 | 4.87/5.0 |
| Fatima | 1 | $32,858 | 82 | 4.71/5.0 |
| Hakim | 2 | $31,072 | 141 | 4.78/5.0 |
| Nabil | 2 | $30,502 | 191 | 4.84/5.0 |
| Yassin | 3 | $26,939 | 39 | 4.67/5.0 |
| Badr | 1 | $25,841 | 141 | 4.99/5.0 |
| Hamza | 1 | $22,858 | 40 | 4.58/5.0 |
Analyzing the strategies of top hosts, such as their property selection, pricing, and guest communication, can offer valuable lessons for optimizing your own Airbnb operations in Salé.
Dive Deeper: Advanced Salé STR Market Data (2026)
Ready to unlock more insights? AirROI provides access to advanced metrics and comprehensive Airbnb data for Salé. Explore detailed analytics beyond this report to refine your investment strategy, optimize pricing, and maximize your vacation rental profits.
Explore Advanced MetricsSalé Short-Term Rental Market Composition (2026): Property & Room Types
Room Type Distribution
Property Type Distribution
Market Composition Insights for Salé
- The Salé Airbnb market composition is heavily skewed towards Entire Home/Apt listings, which make up 82% of the 194 active rentals. This indicates strong guest preference for privacy and space.
- Looking at the property type distribution in Salé, Apartment/Condo properties are the most common (78.4%), reflecting the local real estate landscape.
- The presence of 7.2% Hotel/Boutique listings indicates integration with traditional hospitality.
- Smaller segments like outdoor/unique, others (combined 1.5%) offer potential for unique stay experiences.
Salé Airbnb Room Capacity Analysis (2026): Bedroom Distribution
Distribution of Listings by Number of Bedrooms
Room Capacity Insights for Salé
- The dominant room capacity in Salé is 2 bedrooms listings, making up 44.3% of the market. This suggests a strong demand for properties suitable for couples or solo travelers.
- Together, 2 bedrooms and 1 bedroom properties represent 65.4% of the active Airbnb listings in Salé, indicating a high concentration in these sizes.
- A significant 20.5% of listings offer 3+ bedrooms, catering to larger groups and families seeking more space in Salé.
Salé Vacation Rental Guest Capacity Trends (2026)
Distribution of Listings by Guest Capacity
Guest Capacity Insights for Salé
- The most common guest capacity trend in Salé vacation rentals is listings accommodating 4 guests (27.3%). This suggests the primary traveler segment is likely small families or groups.
- Properties designed for 4 guests and 5 guests dominate the Salé STR market, accounting for 47.4% of listings.
- 24.7% of properties accommodate 6+ guests, serving the market segment for larger families or group travel in Salé.
- On average, properties in Salé are equipped to host 4.0 guests.
Salé Airbnb Booking Patterns (2026): Available vs. Booked Days
Available Days Distribution
Booked Days Distribution
Booking Pattern Insights for Salé
- The most common availability pattern in Salé falls within the 271-366 days range, representing 56.2% of listings. This suggests many properties have significant open periods on their calendars.
- Approximately 88.7% of listings show high availability (181+ days open annually), indicating potential for increased bookings or specific owner usage patterns.
- For booked days, the 91-180 days range is most frequent in Salé (33%), reflecting common guest stay durations or potential owner blocking patterns.
- A notable 11.9% of properties secure long booking periods (181+ days booked per year), highlighting successful long-term rental strategies or significant owner usage.
Salé Airbnb Minimum Stay Requirements Analysis
Distribution of Listings by Minimum Night Requirement
1 Night
88 listings
45.4% of total
2 Nights
28 listings
14.4% of total
3 Nights
13 listings
6.7% of total
4-6 Nights
7 listings
3.6% of total
7-29 Nights
6 listings
3.1% of total
30+ Nights
52 listings
26.8% of total
Key Insights
- The most prevalent minimum stay requirement in Salé is 1 Night, adopted by 45.4% of listings. This highlights the market's preference for shorter, flexible bookings.
- A significant segment (26.8%) caters to monthly stays (30+ nights) in Salé, pointing to opportunities in the extended-stay market.
Recommendations
- Align with the market by considering a 1 Night minimum stay, as 45.4% of Salé hosts use this setting.
- Explore offering discounts for stays of 30+ nights to attract the 26.8% of the market seeking extended stays.
- Adjust minimum nights based on seasonality – potentially shorter during low season and longer during peak demand periods in Salé.
Salé Airbnb Cancellation Policy Trends Analysis (2026)
Limited
11 listings
5.7% of total
Flexible
100 listings
51.5% of total
Moderate
35 listings
18% of total
Firm
40 listings
20.6% of total
Strict
8 listings
4.1% of total
Cancellation Policy Insights for Salé
- The prevailing Airbnb cancellation policy trend in Salé is Flexible, used by 51.5% of listings.
- There's a relatively balanced mix between guest-friendly (69.5%) and stricter (24.7%) policies, offering choices for different guest needs.
- Strict cancellation policies are quite rare (4.1%), potentially making listings with this policy less competitive unless justified by high demand or property type.
Recommendations for Hosts
- Consider adopting a Flexible policy to align with the 51.5% market standard in Salé.
- Given the high prevalence of Flexible policies (51.5%), offering this can enhance booking appeal, especially during shoulder seasons.
- Using a Strict policy might deter some guests, as only 4.1% of listings use it. Evaluate if potential revenue protection outweighs possible lower booking rates.
- Regularly review your cancellation policy against competitors and market demand shifts in Salé.
Salé STR Booking Lead Time Analysis (2026)
Average Booking Lead Time by Month
Booking Lead Time Insights for Salé
- The overall average booking lead time for vacation rentals in Salé is 27 days.
- Guests book furthest in advance for stays during December (average 40 days), likely coinciding with peak travel demand or local events.
- The shortest booking windows occur for stays in March (average 16 days), indicating more last-minute travel plans during this time.
- Seasonally, Summer (28 days avg.) sees the longest lead times, while Spring (19 days avg.) has the shortest, reflecting typical travel planning cycles.
Recommendations for Hosts
- Use the overall average lead time (27 days) as a baseline for your pricing and availability strategy in Salé.
- For December stays, consider implementing length-of-stay discounts or slightly higher rates for bookings made less than 40 days out to capitalize on advance planning.
- Target marketing efforts for the Summer season well in advance (at least 28 days) to capture early planners.
- Monitor your own booking lead times against these Salé averages to identify opportunities for dynamic pricing adjustments.
Popular & Essential Airbnb Amenities in Salé (2026)
Amenity Prevalence
Amenity Insights for Salé
- Popular amenities like Wifi, TV, Kitchen are common but not universal. Offering these can provide a competitive edge.
- Warning: Wifi is not universally provided but is considered essential globally. Ensure reliable Wifi is offered.
Recommendations for Hosts
- Consider adding popular differentiators like Wifi or TV to increase appeal.
- Highlight unique or less common amenities you offer (e.g., hot tub, dedicated workspace, EV charger) in your listing description and photos.
- Regularly check competitor amenities in Salé to stay competitive.
Salé Airbnb Guest Demographics & Profile Analysis (2026)
Guest Profile Summary for Salé
- The typical guest profile for Airbnb in Salé consists of predominantly international visitors (88%), with top international origins including Morocco, typically belonging to the Post-2000s (Gen Z/Alpha) group (50%), primarily speaking English or French.
- Domestic travelers account for 12.4% of guests.
- Key international markets include France (44%) and Morocco (12.4%).
- Top languages spoken are English (32.4%) followed by French (28.6%).
- A significant demographic segment is the Post-2000s (Gen Z/Alpha) group, representing 50% of guests.
Recommendations for Hosts
- Focus marketing internationally, particularly towards travelers from Morocco.
- Tailor amenities and listing descriptions to appeal to the dominant Post-2000s (Gen Z/Alpha) demographic (e.g., highlight fast WiFi, smart home features, local guides).
- Highlight unique local experiences or amenities relevant to the primary guest profile.
- Consider seasonal promotions aligned with peak travel times for key origin markets.
Nearby Short-Term Rental Market Comparison
How does the Salé Airbnb market stack up against its neighbors? Compare key performance metrics like average monthly revenue, ADR, and occupancy rates in surrounding areas to understand the broader regional STR landscape.
| Market | Active Properties | Monthly Revenue | Daily Rate | Avg. Occupancy |
|---|---|---|---|---|
| Shoul السهول | 10 | $1,584 | $159.25 | 41% |
| Sahel Chamali الساحل الشمالي | 34 | $1,209 | $152.65 | 31% |
| Bouskoura | 46 | $1,132 | $130.77 | 41% |
| Al Bahraoyine | 25 | $1,129 | $221.49 | 33% |
| Talambote | 12 | $892 | $140.90 | 26% |
| Oulad Azzouz ⵡⵍⴰⴷ ⵄⵣⵣⵓⵣ أولاد عزوز | 13 | $812 | $161.42 | 31% |
| Harhoura | 132 | $789 | $114.80 | 34% |
| Ameur عامر | 62 | $785 | $129.87 | 34% |
| Tangier | 2,828 | $764 | $101.23 | 36% |
| Sidi Taibi | 19 | $741 | $155.32 | 29% |