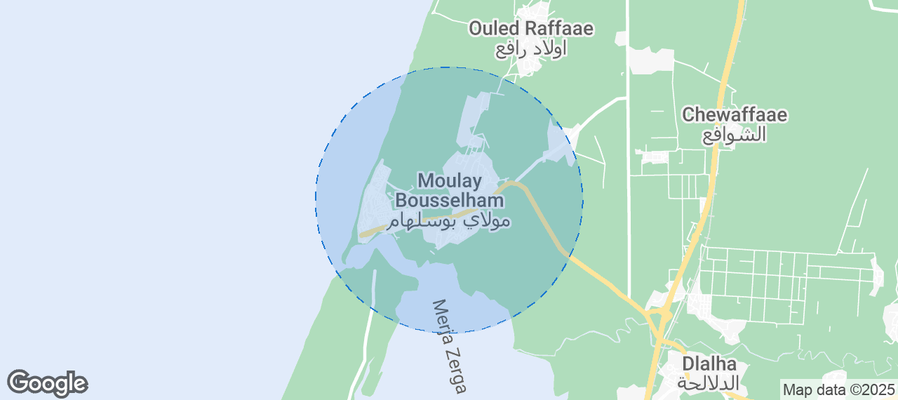
Moulay Bousselham Airbnb Market Analysis 2026: Short Term Rental Data & Vacation Rental Statistics in Rabat-Salé-Kénitra, Morocco
Is Airbnb profitable in Moulay Bousselham in 2026? Explore comprehensive Airbnb analytics for Moulay Bousselham, Rabat-Salé-Kénitra, Morocco to uncover income potential. This 2026 STR market report for Moulay Bousselham, based on AirROI data from February 2025 to January 2026, reveals key trends in the niche market of 31 active listings.
Whether you're considering an Airbnb investment in Moulay Bousselham, optimizing your existing vacation rental, or exploring rental arbitrage opportunities, understanding the Moulay Bousselham Airbnb data is crucial. Leveraging the low regulation environment is key to maximizing your short term rental income potential. Let's dive into the specifics.
Key Moulay Bousselham Airbnb Performance Metrics Overview
Monthly Airbnb Revenue Variations & Income Potential in Moulay Bousselham (2026)
Understanding the monthly revenue variations for Airbnb listings in Moulay Bousselham is key to maximizing your short term rental income potential. Seasonality significantly impacts earnings. Our analysis, based on data from the past 12 months, shows that the peak revenue month for STRs in Moulay Bousselham is typically August, while January often presents the lowest earnings, highlighting opportunities for strategic pricing adjustments during shoulder and low seasons. Explore the typical Airbnb income in Moulay Bousselham across different performance tiers:
- Best-in-class properties (Top 10%) achieve $1,687+ monthly, often utilizing dynamic pricing and superior guest experiences.
- Strong performing properties (Top 25%) earn $864 or more, indicating effective management and desirable locations/amenities.
- Typical properties (Median) generate around $425 per month, representing the average market performance.
- Entry-level properties (Bottom 25%) see earnings around $189, often with potential for optimization.
Average Monthly Airbnb Earnings Trend in Moulay Bousselham
Moulay Bousselham Airbnb Occupancy Rate Trends (2026)
Maximize your bookings by understanding the Moulay Bousselham STR occupancy trends. Seasonal demand shifts significantly influence how often properties are booked. Typically, Augustsees the highest demand (peak season occupancy), while January experiences the lowest (low season). Effective strategies, like adjusting minimum stays or offering promotions, can boost occupancy during slower periods. Here's how different property tiers perform in Moulay Bousselham:
- Best-in-class properties (Top 10%) achieve 48%+ occupancy, indicating high desirability and potentially optimized availability.
- Strong performing properties (Top 25%) maintain 31% or higher occupancy, suggesting good market fit and guest satisfaction.
- Typical properties (Median) have an occupancy rate around 19%.
- Entry-level properties (Bottom 25%) average 11% occupancy, potentially facing higher vacancy.
Average Monthly Occupancy Rate Trend in Moulay Bousselham
Average Daily Rate (ADR) Airbnb Trends in Moulay Bousselham (2026)
Effective short term rental pricing strategy in Moulay Bousselham involves understanding monthly ADR fluctuations. The Average Daily Rate (ADR) for Airbnb in Moulay Bousselham typically peaks in August and dips lowest during February. Leveraging Airbnb dynamic pricing tools or strategies based on this seasonality can significantly boost revenue. Here's a look at the typical nightly rates achieved:
- Best-in-class properties (Top 10%) command rates of $152+ per night, often due to premium features or locations.
- Strong performing properties (Top 25%) achieve nightly rates of $103 or more.
- Typical properties (Median) charge around $65 per night.
- Entry-level properties (Bottom 25%) earn around $43 per night.
Average Daily Rate (ADR) Trend by Month in Moulay Bousselham
Get Live Moulay Bousselham Market Intelligence 👇
Explore Real-time Analytics
Airbnb Seasonality Analysis & Trends in Moulay Bousselham (2026)
Peak Season (August, June, September)
- Revenue averages $1,059 per month
- Occupancy rates average 37.3%
- Daily rates average $87
Shoulder Season
- Revenue averages $613 per month
- Occupancy maintains around 22.3%
- Daily rates hold near $80
Low Season (January, February, November)
- Revenue drops to average $307 per month
- Occupancy decreases to average 11.6%
- Daily rates adjust to average $80
Seasonality Insights for Moulay Bousselham
- The Airbnb seasonality in Moulay Bousselham shows highly seasonal trends requiring careful strategy. While the sections above show seasonal averages, it's also insightful to look at the extremes:
- During the high season, the absolute peak month showcases Moulay Bousselham's highest earning potential, with monthly revenues capable of climbing to $1,258, occupancy reaching a high of 47.5%, and ADRs peaking at $92.
- Conversely, the slowest single month of the year, typically falling within the low season, marks the market's lowest point. In this month, revenue might dip to $130, occupancy could drop to 5.2%, and ADRs may adjust down to $70.
- Understanding both the seasonal averages and these monthly peaks and troughs in revenue, occupancy, and ADR is crucial for maximizing your Airbnb profit potential in Moulay Bousselham.
Seasonal Strategies for Maximizing Profit
- Peak Season: Maximize revenue through premium pricing and potentially longer minimum stays. Ensure high availability.
- Low Season: Offer competitive pricing, special promotions (e.g., extended stay discounts), and flexible cancellation policies. Target off-season travelers like remote workers or budget-conscious guests.
- Shoulder Seasons: Implement dynamic pricing that balances peak and low rates. Target weekend travelers or specific events. Offer slightly more flexible terms than peak season.
- Regularly analyze your own performance against these Moulay Bousselham seasonality benchmarks and adjust your pricing and availability strategy accordingly.
Best Areas for Airbnb Investment in Moulay Bousselham (2026)
Exploring the top neighborhoods for short-term rentals in Moulay Bousselham? This section highlights key areas, outlining why they are attractive for hosts and guests, along with notable local attractions. Consider these locations based on your target guest profile and investment strategy.
| Neighborhood / Area | Why Host Here? (Target Guests & Appeal) | Key Attractions & Landmarks |
|---|---|---|
| Plage de Moulay Bousselham | A beautiful beach destination known for its stunning coastline and natural landscapes. Ideally suited for beachgoers and nature lovers seeking a relaxing getaway. | Moulay Bousselham Beach, Lagoon of Moulay Bousselham, Bouhachem Nature Reserve, Local seafood restaurants, Watersport activities |
| Oualidia | Known for its picturesque lagoon, Oualidia is a hidden gem for tourists seeking tranquility and unique aquatic activities. A great spot for families and couples. | Oualidia Lagoon, beachfront restaurants, seafood delicacies, bird watching, fishing opportunities |
| Hassan Tower Area, Rabat | A historic and cultural hub, it attracts visitors interested in Moroccan history and architecture, making it ideal for culturally inclined travelers. | Hassan Tower, Mausoleum of Mohammed V, Rabat Archaeological Museum, Chellah, Rabat's Medina |
| Kasbah des Oudaias, Rabat | A charming neighborhood with narrow streets and stunning ocean views, it's a popular area for tourists looking for a unique cultural experience. | Kasbah des Oudaias, Ocean promenade, Museum of History and Civilizations, Art galleries, Local artisan shops |
| Salé Beach | An emerging destination with beautiful beaches that appeals to tourists seeking sun and relaxation, making it perfect for affordable getaways. | Plage de Salé, Cultural festivals, Local markets, Family-friendly activities, Beachfront cafes |
| Rabat Marina | A modern area offering waterfront activities with luxury amenities. Attractive to upscale travelers and offering a vibrant nightlife scene. | Rabat Marina, restaurants and bars, boating activities, water sports, viewing the sunset |
| Moulay Yacoub Spa | Famous for its therapeutic hot springs, attracting tourists looking for wellness and relaxation opportunities. Great for wellness retreats. | Moulay Yacoub thermal springs, Spas and wellness centers, Outdoor activities, Cultural experiences surrounding wellness, Local crafts |
| Sidi Bouknadel | A serene coastal area known for its scenic beauty and tranquility, great for families and couples looking for peaceful vacations. | Beachfront picnics, Local nature trails, Cultural experiences, Outdoor sports, Relaxation spots |
Understanding Airbnb License Requirements & STR Laws in Moulay Bousselham (2026)
While Moulay Bousselham, Rabat-Salé-Kénitra, Morocco currently shows low STR regulations, specific Airbnb license requirements might still exist or change. Always verify the latest short term rental regulations and Airbnb license requirements directly with local government authorities for Moulay Bousselham to ensure full compliance before hosting.
(Source: AirROI data, 2026, finding no licensed listings among those analyzed)
Top Performing Airbnb Properties in Moulay Bousselham (2026)
Benchmark your potential! Explore examples of top-performing Airbnb properties in Moulay Bousselhambased on Trailing Twelve Month (TTM) revenue. Analyze their characteristics, revenue, occupancy rate, and ADR to understand what drives success in this market.
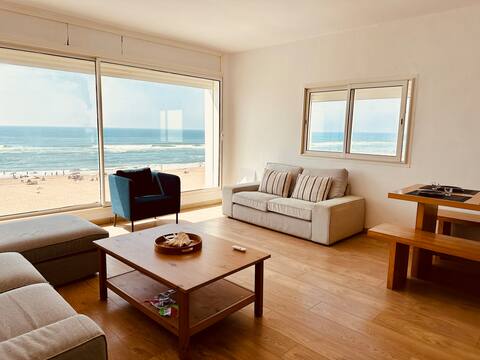
Villa with stunning ocean views.
Entire Place • 4 bedrooms

Villa Keltoum Apartment feet in the water
Entire Place • 3 bedrooms

Apartment feet in the water
Entire Place • 2 bedrooms

Dream house in white
Entire Place • 3 bedrooms
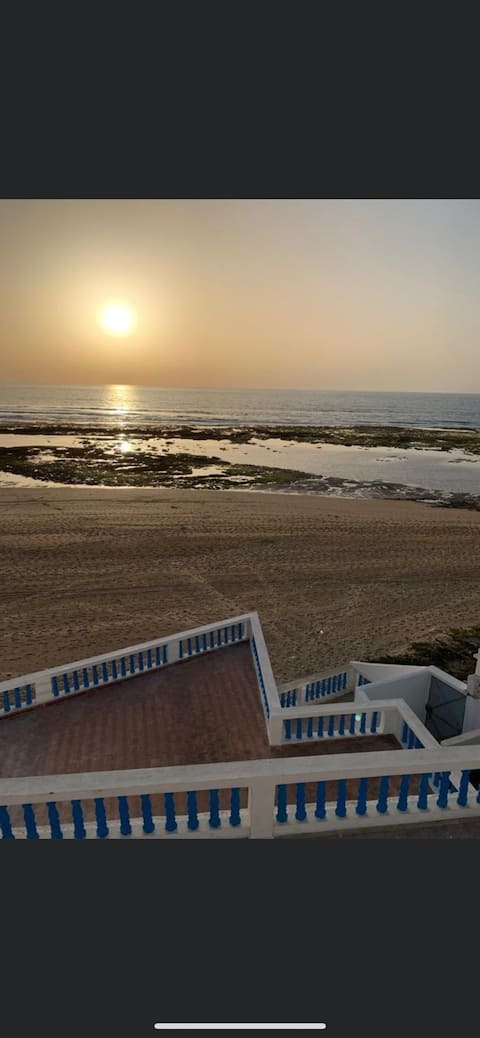
Beautiful house facing the sea.
Entire Place • 2 bedrooms

4-bedroom Family Villa • Parking • 5 min to beach
Entire Place • 4 bedrooms
Note: Performance varies based on location, size, amenities, seasonality, and management quality. Data reflects the past 12 months.
Top Performing Airbnb Hosts in Moulay Bousselham (2026)
Learn from the best! This table showcases top-performing Airbnb hosts in Moulay Bousselham based on the number of properties managed and estimated total revenue over the past year. Analyze their scale and performance metrics.
| Host Name | Properties | Grossing Revenue | Stay Reviews | Avg Rating |
|---|---|---|---|---|
| Keltoum | 3 | $34,535 | 378 | 4.64/5.0 |
| Céline | 3 | $32,989 | 50 | 4.76/5.0 |
| Karim | 1 | $8,447 | 61 | 5.00/5.0 |
| Badr | 2 | $7,955 | 5 | 5.00/5.0 |
| Anas | 1 | $7,778 | 32 | 4.59/5.0 |
| Prestige Holidays | 1 | $6,235 | 11 | 4.91/5.0 |
| Majd | 8 | $5,963 | 253 | 4.90/5.0 |
| Mohamed | 1 | $5,596 | 9 | 4.56/5.0 |
| L Houcine | 1 | $4,165 | 22 | 4.91/5.0 |
| Agence.S.Kenitra | 1 | $3,572 | 22 | 4.59/5.0 |
Analyzing the strategies of top hosts, such as their property selection, pricing, and guest communication, can offer valuable lessons for optimizing your own Airbnb operations in Moulay Bousselham.
Dive Deeper: Advanced Moulay Bousselham STR Market Data (2026)
Ready to unlock more insights? AirROI provides access to advanced metrics and comprehensive Airbnb data for Moulay Bousselham. Explore detailed analytics beyond this report to refine your investment strategy, optimize pricing, and maximize your vacation rental profits.
Explore Advanced MetricsMoulay Bousselham Short-Term Rental Market Composition (2026): Property & Room Types
Room Type Distribution
Property Type Distribution
Market Composition Insights for Moulay Bousselham
- The Moulay Bousselham Airbnb market composition is heavily skewed towards Entire Home/Apt listings, which make up 67.7% of the 31 active rentals. This indicates strong guest preference for privacy and space.
- However, a notable 32.3% share for Private Rooms suggests opportunities for budget-conscious travelers or hosts renting out spare rooms.
- Looking at the property type distribution in Moulay Bousselham, House properties are the most common (35.5%), reflecting the local real estate landscape.
- Houses represent a significant 35.5% portion, catering likely to families or larger groups.
- The presence of 29% Hotel/Boutique listings indicates integration with traditional hospitality.
- Smaller segments like outdoor/unique, others (combined 6.4%) offer potential for unique stay experiences.
Moulay Bousselham Airbnb Room Capacity Analysis (2026): Bedroom Distribution
Distribution of Listings by Number of Bedrooms
Room Capacity Insights for Moulay Bousselham
- The dominant room capacity in Moulay Bousselham is 2 bedrooms listings, making up 38.7% of the market. This suggests a strong demand for properties suitable for couples or solo travelers.
- Together, 2 bedrooms and 1 bedroom properties represent 51.6% of the active Airbnb listings in Moulay Bousselham, indicating a high concentration in these sizes.
- A significant 29.1% of listings offer 3+ bedrooms, catering to larger groups and families seeking more space in Moulay Bousselham.
Moulay Bousselham Vacation Rental Guest Capacity Trends (2026)
Distribution of Listings by Guest Capacity
Guest Capacity Insights for Moulay Bousselham
- The most common guest capacity trend in Moulay Bousselham vacation rentals is listings accommodating 8+ guests (25.8%). This suggests the primary traveler segment is likely larger groups.
- Properties designed for 8+ guests and 6 guests dominate the Moulay Bousselham STR market, accounting for 48.4% of listings.
- 48.4% of properties accommodate 6+ guests, serving the market segment for larger families or group travel in Moulay Bousselham.
- On average, properties in Moulay Bousselham are equipped to host 4.4 guests.
Moulay Bousselham Airbnb Booking Patterns (2026): Available vs. Booked Days
Available Days Distribution
Booked Days Distribution
Booking Pattern Insights for Moulay Bousselham
- The most common availability pattern in Moulay Bousselham falls within the 271-366 days range, representing 83.9% of listings. This suggests many properties have significant open periods on their calendars.
- Approximately 100.0% of listings show high availability (181+ days open annually), indicating potential for increased bookings or specific owner usage patterns.
- For booked days, the 1-30 days range is most frequent in Moulay Bousselham (45.2%), reflecting common guest stay durations or potential owner blocking patterns.
Moulay Bousselham Airbnb Minimum Stay Requirements Analysis
Distribution of Listings by Minimum Night Requirement
1 Night
18 listings
58.1% of total
2 Nights
7 listings
22.6% of total
3 Nights
1 listings
3.2% of total
7-29 Nights
1 listings
3.2% of total
30+ Nights
4 listings
12.9% of total
Key Insights
- The most prevalent minimum stay requirement in Moulay Bousselham is 1 Night, adopted by 58.1% of listings. This highlights the market's preference for shorter, flexible bookings.
- A strong majority (80.7%) of the Moulay Bousselham Airbnb data shows acceptance of very short stays (1-2 nights), indicating a dynamic, high-turnover market.
- A significant segment (12.9%) caters to monthly stays (30+ nights) in Moulay Bousselham, pointing to opportunities in the extended-stay market.
Recommendations
- Align with the market by considering a 1 Night minimum stay, as 58.1% of Moulay Bousselham hosts use this setting.
- Explore offering discounts for stays of 30+ nights to attract the 12.9% of the market seeking extended stays.
- Adjust minimum nights based on seasonality – potentially shorter during low season and longer during peak demand periods in Moulay Bousselham.
Moulay Bousselham Airbnb Cancellation Policy Trends Analysis (2026)
Flexible
19 listings
61.3% of total
Moderate
7 listings
22.6% of total
Firm
5 listings
16.1% of total
Cancellation Policy Insights for Moulay Bousselham
- The prevailing Airbnb cancellation policy trend in Moulay Bousselham is Flexible, used by 61.3% of listings.
- The market strongly favors guest-friendly terms, with 83.9% of listings offering Flexible or Moderate policies. This suggests guests in Moulay Bousselham may expect booking flexibility.
Recommendations for Hosts
- Consider adopting a Flexible policy to align with the 61.3% market standard in Moulay Bousselham.
- Given the high prevalence of Flexible policies (61.3%), offering this can enhance booking appeal, especially during shoulder seasons.
- Regularly review your cancellation policy against competitors and market demand shifts in Moulay Bousselham.
Moulay Bousselham STR Booking Lead Time Analysis (2026)
Average Booking Lead Time by Month
Booking Lead Time Insights for Moulay Bousselham
- The overall average booking lead time for vacation rentals in Moulay Bousselham is 26 days.
- Guests book furthest in advance for stays during August (average 45 days), likely coinciding with peak travel demand or local events.
- The shortest booking windows occur for stays in February (average 9 days), indicating more last-minute travel plans during this time.
- Seasonally, Summer (33 days avg.) sees the longest lead times, while Winter (19 days avg.) has the shortest, reflecting typical travel planning cycles.
Recommendations for Hosts
- Use the overall average lead time (26 days) as a baseline for your pricing and availability strategy in Moulay Bousselham.
- For August stays, consider implementing length-of-stay discounts or slightly higher rates for bookings made less than 45 days out to capitalize on advance planning.
- During February, focus on last-minute booking availability and promotions, as guests book with very short notice (9 days avg.).
- Target marketing efforts for the Summer season well in advance (at least 33 days) to capture early planners.
- Monitor your own booking lead times against these Moulay Bousselham averages to identify opportunities for dynamic pricing adjustments.
Popular & Essential Airbnb Amenities in Moulay Bousselham (2026)
Amenity Prevalence
Amenity Insights for Moulay Bousselham
- Essential amenities in Moulay Bousselham that guests expect include: TV. Lacking these (this) could significantly impact bookings.
- Popular amenities like Kitchen, Hot water, Wifi are common but not universal. Offering these can provide a competitive edge.
- Warning: Wifi is not universally provided but is considered essential globally. Ensure reliable Wifi is offered.
Recommendations for Hosts
- Ensure your listing includes all essential amenities for Moulay Bousselham: TV.
- Prioritize adding missing essentials: TV.
- Consider adding popular differentiators like Kitchen or Hot water to increase appeal.
- Highlight unique or less common amenities you offer (e.g., hot tub, dedicated workspace, EV charger) in your listing description and photos.
- Regularly check competitor amenities in Moulay Bousselham to stay competitive.
Moulay Bousselham Airbnb Guest Demographics & Profile Analysis (2026)
Guest Profile Summary for Moulay Bousselham
- The typical guest profile for Airbnb in Moulay Bousselham consists of predominantly international visitors (86%), with top international origins including Morocco, typically belonging to the Post-2000s (Gen Z/Alpha) group (50%), primarily speaking English or French.
- Domestic travelers account for 14.1% of guests.
- Key international markets include France (40.6%) and Morocco (14.1%).
- Top languages spoken are English (31.5%) followed by French (23.4%).
- A significant demographic segment is the Post-2000s (Gen Z/Alpha) group, representing 50% of guests.
Recommendations for Hosts
- Focus marketing internationally, particularly towards travelers from Morocco.
- Tailor amenities and listing descriptions to appeal to the dominant Post-2000s (Gen Z/Alpha) demographic (e.g., highlight fast WiFi, smart home features, local guides).
- Highlight unique local experiences or amenities relevant to the primary guest profile.
- Consider seasonal promotions aligned with peak travel times for key origin markets.
Nearby Short-Term Rental Market Comparison
How does the Moulay Bousselham Airbnb market stack up against its neighbors? Compare key performance metrics like average monthly revenue, ADR, and occupancy rates in surrounding areas to understand the broader regional STR landscape.
| Market | Active Properties | Monthly Revenue | Daily Rate | Avg. Occupancy |
|---|---|---|---|---|
| Shoul السهول | 10 | $1,584 | $159.25 | 41% |
| Sahel Chamali الساحل الشمالي | 34 | $1,209 | $152.65 | 31% |
| Bouskoura | 46 | $1,132 | $130.77 | 41% |
| Al Bahraoyine | 25 | $1,129 | $221.49 | 33% |
| Talambote | 12 | $892 | $140.90 | 26% |
| Oulad Azzouz ⵡⵍⴰⴷ ⵄⵣⵣⵓⵣ أولاد عزوز | 13 | $812 | $161.42 | 31% |
| Harhoura | 132 | $789 | $114.80 | 34% |
| Ameur عامر | 62 | $785 | $129.87 | 34% |
| Tangier | 2,828 | $764 | $101.23 | 36% |
| Sidi Taibi | 19 | $741 | $155.32 | 29% |