Safi Airbnb Market Analysis 2026: Short Term Rental Data & Vacation Rental Statistics in Marrakech-Safi, Morocco
Is Airbnb profitable in Safi in 2026? Explore comprehensive Airbnb analytics for Safi, Marrakech-Safi, Morocco to uncover income potential. This 2026 STR market report for Safi, based on AirROI data from February 2025 to January 2026, reveals key trends in the niche market of 53 active listings.
Whether you're considering an Airbnb investment in Safi, optimizing your existing vacation rental, or exploring rental arbitrage opportunities, understanding the Safi Airbnb data is crucial. Leveraging the low regulation environment is key to maximizing your short term rental income potential. Let's dive into the specifics.
Key Safi Airbnb Performance Metrics Overview
Monthly Airbnb Revenue Variations & Income Potential in Safi (2026)
Understanding the monthly revenue variations for Airbnb listings in Safi is key to maximizing your short term rental income potential. Seasonality significantly impacts earnings. Our analysis, based on data from the past 12 months, shows that the peak revenue month for STRs in Safi is typically August, while May often presents the lowest earnings, highlighting opportunities for strategic pricing adjustments during shoulder and low seasons. Explore the typical Airbnb income in Safi across different performance tiers:
- Best-in-class properties (Top 10%) achieve $1,055+ monthly, often utilizing dynamic pricing and superior guest experiences.
- Strong performing properties (Top 25%) earn $571 or more, indicating effective management and desirable locations/amenities.
- Typical properties (Median) generate around $310 per month, representing the average market performance.
- Entry-level properties (Bottom 25%) see earnings around $153, often with potential for optimization.
Average Monthly Airbnb Earnings Trend in Safi
Safi Airbnb Occupancy Rate Trends (2026)
Maximize your bookings by understanding the Safi STR occupancy trends. Seasonal demand shifts significantly influence how often properties are booked. Typically, Augustsees the highest demand (peak season occupancy), while May experiences the lowest (low season). Effective strategies, like adjusting minimum stays or offering promotions, can boost occupancy during slower periods. Here's how different property tiers perform in Safi:
- Best-in-class properties (Top 10%) achieve 61%+ occupancy, indicating high desirability and potentially optimized availability.
- Strong performing properties (Top 25%) maintain 40% or higher occupancy, suggesting good market fit and guest satisfaction.
- Typical properties (Median) have an occupancy rate around 26%.
- Entry-level properties (Bottom 25%) average 13% occupancy, potentially facing higher vacancy.
Average Monthly Occupancy Rate Trend in Safi
Average Daily Rate (ADR) Airbnb Trends in Safi (2026)
Effective short term rental pricing strategy in Safi involves understanding monthly ADR fluctuations. The Average Daily Rate (ADR) for Airbnb in Safi typically peaks in December and dips lowest during February. Leveraging Airbnb dynamic pricing tools or strategies based on this seasonality can significantly boost revenue. Here's a look at the typical nightly rates achieved:
- Best-in-class properties (Top 10%) command rates of $77+ per night, often due to premium features or locations.
- Strong performing properties (Top 25%) achieve nightly rates of $59 or more.
- Typical properties (Median) charge around $43 per night.
- Entry-level properties (Bottom 25%) earn around $32 per night.
Average Daily Rate (ADR) Trend by Month in Safi
Get Live Safi Market Intelligence 👇

Explore Real-time Analytics
Airbnb Seasonality Analysis & Trends in Safi (2026)
Peak Season (August, October, July)
- Revenue averages $579 per month
- Occupancy rates average 36.2%
- Daily rates average $51
Shoulder Season
- Revenue averages $432 per month
- Occupancy maintains around 29.6%
- Daily rates hold near $49
Low Season (April, May, June)
- Revenue drops to average $363 per month
- Occupancy decreases to average 27.4%
- Daily rates adjust to average $48
Seasonality Insights for Safi
- The Airbnb seasonality in Safi shows moderate seasonality with distinct peak and low periods. While the sections above show seasonal averages, it's also insightful to look at the extremes:
- During the high season, the absolute peak month showcases Safi's highest earning potential, with monthly revenues capable of climbing to $609, occupancy reaching a high of 40.7%, and ADRs peaking at $51.
- Conversely, the slowest single month of the year, typically falling within the low season, marks the market's lowest point. In this month, revenue might dip to $328, occupancy could drop to 25.2%, and ADRs may adjust down to $44.
- Understanding both the seasonal averages and these monthly peaks and troughs in revenue, occupancy, and ADR is crucial for maximizing your Airbnb profit potential in Safi.
Seasonal Strategies for Maximizing Profit
- Peak Season: Maximize revenue through premium pricing and potentially longer minimum stays. Ensure high availability.
- Low Season: Offer competitive pricing, special promotions (e.g., extended stay discounts), and flexible cancellation policies. Target off-season travelers like remote workers or budget-conscious guests.
- Shoulder Seasons: Implement dynamic pricing that balances peak and low rates. Target weekend travelers or specific events. Offer slightly more flexible terms than peak season.
- Regularly analyze your own performance against these Safi seasonality benchmarks and adjust your pricing and availability strategy accordingly.
Best Areas for Airbnb Investment in Safi (2026)
Exploring the top neighborhoods for short-term rentals in Safi? This section highlights key areas, outlining why they are attractive for hosts and guests, along with notable local attractions. Consider these locations based on your target guest profile and investment strategy.
| Neighborhood / Area | Why Host Here? (Target Guests & Appeal) | Key Attractions & Landmarks |
|---|---|---|
| Old Medina | Historic center of Safi, known for its traditional Moroccan architecture, artisanal shops, and vibrant street life. Attracts tourists interested in culture and history. | Safi Fortress, Ceramics Museum, Old Medina Market, Safi Beach |
| Safi Beach | Popular beach area offering sun, sand, and sea. Ideal for travelers looking to relax and enjoy water activities. | Safi Beach, Beachfront restaurants, Water sports activities |
| Boulevard Moulay Youssef | Main boulevard lined with shops, cafes, and restaurants. Great location for guests who prefer a lively atmosphere with amenities nearby. | Shopping centers, Cafes, Street performers |
| Safi Port | A bustling area with historical significance and beautiful views of the ocean. Popular with those interested in maritime activities and seafood dining. | Fishing port, Seafood restaurants, Ocean views |
| Dar Al Bahar | A premium residential area known for its luxury villas and proximity to the beach. Great for families and higher-end travelers. | Luxury villas, Proximity to beach access, Quiet environment |
| Hassan II Avenue | Main thoroughfare that connects key areas of Safi, offering a range of services and local culture. | Local shops, Restaurants, Cafes |
| Safi Museum | Attracts tourists interested in art and history. A great place to learn about Safi's rich cultural heritage. | Safi Museum, Cultural exhibitions, Art displays |
| Cascades de Sidi Chiker | Natural waterfall area nearby Safi, ideal for nature lovers and those seeking outdoor adventures. | Natural beauty, Hiking trails, Picnic areas |
Understanding Airbnb License Requirements & STR Laws in Safi (2026)
While Safi, Marrakech-Safi, Morocco currently shows low STR regulations, specific Airbnb license requirements might still exist or change. Always verify the latest short term rental regulations and Airbnb license requirements directly with local government authorities for Safi to ensure full compliance before hosting.
(Source: AirROI data, 2026, finding no licensed listings among those analyzed)
Top Performing Airbnb Properties in Safi (2026)
Benchmark your potential! Explore examples of top-performing Airbnb properties in Safibased on Trailing Twelve Month (TTM) revenue. Analyze their characteristics, revenue, occupancy rate, and ADR to understand what drives success in this market.
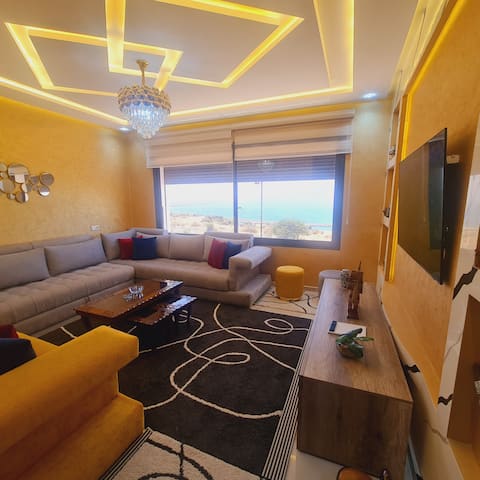
apartment with panoramic view
Entire Place • 2 bedrooms

Most Beautiful Apartment in Safi
Entire Place • 2 bedrooms
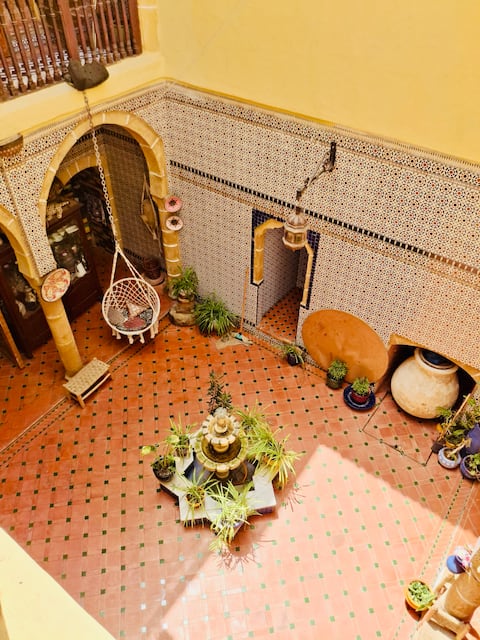
Entire air-conditioned Dar Dada Riad
Entire Place • 2 bedrooms
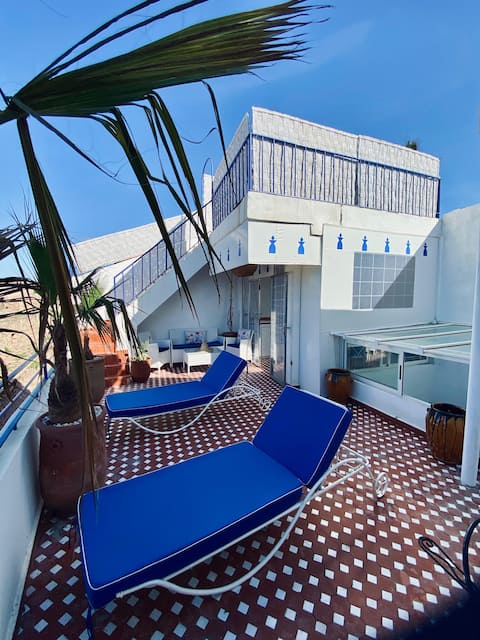
Beautiful Sea View, Entire Riad with Breakfast
Entire Place • 4 bedrooms

Luxury apartment with large terrace (villa)
Entire Place • 2 bedrooms
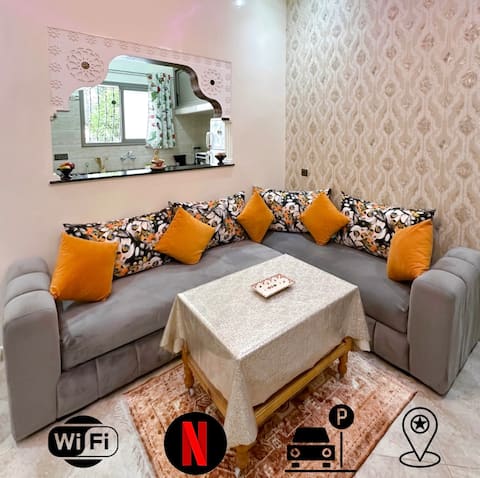
Cozy apartment in the city center.
Entire Place • 1 bedroom
Note: Performance varies based on location, size, amenities, seasonality, and management quality. Data reflects the past 12 months.
Top Performing Airbnb Hosts in Safi (2026)
Learn from the best! This table showcases top-performing Airbnb hosts in Safi based on the number of properties managed and estimated total revenue over the past year. Analyze their scale and performance metrics.
| Host Name | Properties | Grossing Revenue | Stay Reviews | Avg Rating |
|---|---|---|---|---|
| Mustafa | 1 | $15,746 | 48 | 4.94/5.0 |
| Achraf | 6 | $14,525 | 214 | 4.67/5.0 |
| Hakim And Assia | 1 | $14,383 | 99 | 4.96/5.0 |
| Louis | 1 | $11,872 | 38 | 4.97/5.0 |
| Habiba | 1 | $10,994 | 78 | 4.86/5.0 |
| Hakim | 1 | $10,797 | 94 | 4.82/5.0 |
| Lou | 4 | $10,377 | 92 | 4.68/5.0 |
| Adil | 2 | $10,232 | 103 | 4.91/5.0 |
| Atika | 2 | $9,379 | 32 | 4.93/5.0 |
| Anas | 4 | $8,316 | 219 | 4.63/5.0 |
Analyzing the strategies of top hosts, such as their property selection, pricing, and guest communication, can offer valuable lessons for optimizing your own Airbnb operations in Safi.
Dive Deeper: Advanced Safi STR Market Data (2026)
Ready to unlock more insights? AirROI provides access to advanced metrics and comprehensive Airbnb data for Safi. Explore detailed analytics beyond this report to refine your investment strategy, optimize pricing, and maximize your vacation rental profits.
Explore Advanced MetricsSafi Short-Term Rental Market Composition (2026): Property & Room Types
Room Type Distribution
Property Type Distribution
Market Composition Insights for Safi
- The Safi Airbnb market composition is heavily skewed towards Entire Home/Apt listings, which make up 83% of the 53 active rentals. This indicates strong guest preference for privacy and space.
- Looking at the property type distribution in Safi, Apartment/Condo properties are the most common (66%), reflecting the local real estate landscape.
- The presence of 13.2% Hotel/Boutique listings indicates integration with traditional hospitality.
Safi Airbnb Room Capacity Analysis (2026): Bedroom Distribution
Distribution of Listings by Number of Bedrooms
Room Capacity Insights for Safi
- The dominant room capacity in Safi is 2 bedrooms listings, making up 41.5% of the market. This suggests a strong demand for properties suitable for couples or solo travelers.
- Together, 2 bedrooms and 1 bedroom properties represent 81.1% of the active Airbnb listings in Safi, indicating a high concentration in these sizes.
- Listings with 3+ bedrooms (9.4%) represent a smaller niche, potentially indicating an underserved market for larger group accommodations in Safi.
Safi Vacation Rental Guest Capacity Trends (2026)
Distribution of Listings by Guest Capacity
Guest Capacity Insights for Safi
- The most common guest capacity trend in Safi vacation rentals is listings accommodating 4 guests (24.5%). This suggests the primary traveler segment is likely small families or groups.
- Properties designed for 4 guests and 6 guests dominate the Safi STR market, accounting for 49.0% of listings.
- 30.2% of properties accommodate 6+ guests, serving the market segment for larger families or group travel in Safi.
- On average, properties in Safi are equipped to host 4.1 guests.
Safi Airbnb Booking Patterns (2026): Available vs. Booked Days
Available Days Distribution
Booked Days Distribution
Booking Pattern Insights for Safi
- The most common availability pattern in Safi falls within the 271-366 days range, representing 71.7% of listings. This suggests many properties have significant open periods on their calendars.
- Approximately 94.3% of listings show high availability (181+ days open annually), indicating potential for increased bookings or specific owner usage patterns.
- For booked days, the 1-30 days range is most frequent in Safi (41.5%), reflecting common guest stay durations or potential owner blocking patterns.
- A notable 5.7% of properties secure long booking periods (181+ days booked per year), highlighting successful long-term rental strategies or significant owner usage.
Safi Airbnb Minimum Stay Requirements Analysis
Distribution of Listings by Minimum Night Requirement
1 Night
33 listings
62.3% of total
2 Nights
7 listings
13.2% of total
3 Nights
2 listings
3.8% of total
4-6 Nights
2 listings
3.8% of total
30+ Nights
9 listings
17% of total
Key Insights
- The most prevalent minimum stay requirement in Safi is 1 Night, adopted by 62.3% of listings. This highlights the market's preference for shorter, flexible bookings.
- A strong majority (75.5%) of the Safi Airbnb data shows acceptance of very short stays (1-2 nights), indicating a dynamic, high-turnover market.
- A significant segment (17%) caters to monthly stays (30+ nights) in Safi, pointing to opportunities in the extended-stay market.
Recommendations
- Align with the market by considering a 1 Night minimum stay, as 62.3% of Safi hosts use this setting.
- Explore offering discounts for stays of 30+ nights to attract the 17% of the market seeking extended stays.
- Adjust minimum nights based on seasonality – potentially shorter during low season and longer during peak demand periods in Safi.
Safi Airbnb Cancellation Policy Trends Analysis (2026)
Limited
6 listings
11.3% of total
Flexible
32 listings
60.4% of total
Moderate
4 listings
7.5% of total
Firm
9 listings
17% of total
Strict
2 listings
3.8% of total
Cancellation Policy Insights for Safi
- The prevailing Airbnb cancellation policy trend in Safi is Flexible, used by 60.4% of listings.
- There's a relatively balanced mix between guest-friendly (67.9%) and stricter (20.8%) policies, offering choices for different guest needs.
- Strict cancellation policies are quite rare (3.8%), potentially making listings with this policy less competitive unless justified by high demand or property type.
Recommendations for Hosts
- Consider adopting a Flexible policy to align with the 60.4% market standard in Safi.
- Given the high prevalence of Flexible policies (60.4%), offering this can enhance booking appeal, especially during shoulder seasons.
- Using a Strict policy might deter some guests, as only 3.8% of listings use it. Evaluate if potential revenue protection outweighs possible lower booking rates.
- Regularly review your cancellation policy against competitors and market demand shifts in Safi.
Safi STR Booking Lead Time Analysis (2026)
Average Booking Lead Time by Month
Booking Lead Time Insights for Safi
- The overall average booking lead time for vacation rentals in Safi is 24 days.
- Guests book furthest in advance for stays during November (average 39 days), likely coinciding with peak travel demand or local events.
- The shortest booking windows occur for stays in March (average 11 days), indicating more last-minute travel plans during this time.
- Seasonally, Fall (37 days avg.) sees the longest lead times, while Spring (17 days avg.) has the shortest, reflecting typical travel planning cycles.
Recommendations for Hosts
- Use the overall average lead time (24 days) as a baseline for your pricing and availability strategy in Safi.
- For November stays, consider implementing length-of-stay discounts or slightly higher rates for bookings made less than 39 days out to capitalize on advance planning.
- During March, focus on last-minute booking availability and promotions, as guests book with very short notice (11 days avg.).
- Target marketing efforts for the Fall season well in advance (at least 37 days) to capture early planners.
- Monitor your own booking lead times against these Safi averages to identify opportunities for dynamic pricing adjustments.
Popular & Essential Airbnb Amenities in Safi (2026)
Amenity Prevalence
Amenity Insights for Safi
- Popular amenities like Wifi, Kitchen, Free parking on premises are common but not universal. Offering these can provide a competitive edge.
- Warning: Wifi is not universally provided but is considered essential globally. Ensure reliable Wifi is offered.
Recommendations for Hosts
- Consider adding popular differentiators like Wifi or Kitchen to increase appeal.
- Highlight unique or less common amenities you offer (e.g., hot tub, dedicated workspace, EV charger) in your listing description and photos.
- Regularly check competitor amenities in Safi to stay competitive.
Safi Airbnb Guest Demographics & Profile Analysis (2026)
Guest Profile Summary for Safi
- The typical guest profile for Airbnb in Safi consists of predominantly international visitors (91%), with top international origins including Morocco, typically belonging to the Post-2000s (Gen Z/Alpha) group (50%), primarily speaking English or French.
- Domestic travelers account for 9.1% of guests.
- Key international markets include France (39.4%) and Morocco (9.1%).
- Top languages spoken are English (35.2%) followed by French (27.5%).
- A significant demographic segment is the Post-2000s (Gen Z/Alpha) group, representing 50% of guests.
Recommendations for Hosts
- Focus marketing internationally, particularly towards travelers from Morocco.
- Tailor amenities and listing descriptions to appeal to the dominant Post-2000s (Gen Z/Alpha) demographic (e.g., highlight fast WiFi, smart home features, local guides).
- Highlight unique local experiences or amenities relevant to the primary guest profile.
- Consider seasonal promotions aligned with peak travel times for key origin markets.
Nearby Short-Term Rental Market Comparison
How does the Safi Airbnb market stack up against its neighbors? Compare key performance metrics like average monthly revenue, ADR, and occupancy rates in surrounding areas to understand the broader regional STR landscape.
| Market | Active Properties | Monthly Revenue | Daily Rate | Avg. Occupancy |
|---|---|---|---|---|
| caïdat d'Aquermoud | 10 | $4,684 | $343.99 | 52% |
| Tameslouht | 90 | $3,556 | $430.48 | 33% |
| caïdat de Smimou | 16 | $2,804 | $216.12 | 40% |
| caïdat d'Ounagha | 14 | $2,755 | $243.35 | 30% |
| Aguerd اكرض | 73 | $2,750 | $314.32 | 39% |
| Ounagha | 89 | $1,903 | $233.37 | 35% |
| Saâda | 41 | $1,210 | $182.84 | 31% |
| Ghazoua | 18 | $1,095 | $166.41 | 33% |
| Essaouira | 1,571 | $1,012 | $108.34 | 39% |
| Haouzia | 22 | $1,011 | $248.67 | 28% |