Ourika Airbnb Market Analysis 2026: Short Term Rental Data & Vacation Rental Statistics in Marrakech-Safi, Morocco
Is Airbnb profitable in Ourika in 2026? Explore comprehensive Airbnb analytics for Ourika, Marrakech-Safi, Morocco to uncover income potential. This 2026 STR market report for Ourika, based on AirROI data from February 2025 to January 2026, reveals key trends in the niche market of 40 active listings.
Whether you're considering an Airbnb investment in Ourika, optimizing your existing vacation rental, or exploring rental arbitrage opportunities, understanding the Ourika Airbnb data is crucial. Leveraging the low regulation environment is key to maximizing your short term rental income potential. Let's dive into the specifics.
Key Ourika Airbnb Performance Metrics Overview
Monthly Airbnb Revenue Variations & Income Potential in Ourika (2026)
Understanding the monthly revenue variations for Airbnb listings in Ourika is key to maximizing your short term rental income potential. Seasonality significantly impacts earnings. Our analysis, based on data from the past 12 months, shows that the peak revenue month for STRs in Ourika is typically August, while March often presents the lowest earnings, highlighting opportunities for strategic pricing adjustments during shoulder and low seasons. Explore the typical Airbnb income in Ourika across different performance tiers:
- Best-in-class properties (Top 10%) achieve $3,750+ monthly, often utilizing dynamic pricing and superior guest experiences.
- Strong performing properties (Top 25%) earn $2,340 or more, indicating effective management and desirable locations/amenities.
- Typical properties (Median) generate around $1,149 per month, representing the average market performance.
- Entry-level properties (Bottom 25%) see earnings around $494, often with potential for optimization.
Average Monthly Airbnb Earnings Trend in Ourika
Ourika Airbnb Occupancy Rate Trends (2026)
Maximize your bookings by understanding the Ourika STR occupancy trends. Seasonal demand shifts significantly influence how often properties are booked. Typically, Augustsees the highest demand (peak season occupancy), while January experiences the lowest (low season). Effective strategies, like adjusting minimum stays or offering promotions, can boost occupancy during slower periods. Here's how different property tiers perform in Ourika:
- Best-in-class properties (Top 10%) achieve 56%+ occupancy, indicating high desirability and potentially optimized availability.
- Strong performing properties (Top 25%) maintain 43% or higher occupancy, suggesting good market fit and guest satisfaction.
- Typical properties (Median) have an occupancy rate around 26%.
- Entry-level properties (Bottom 25%) average 12% occupancy, potentially facing higher vacancy.
Average Monthly Occupancy Rate Trend in Ourika
Average Daily Rate (ADR) Airbnb Trends in Ourika (2026)
Effective short term rental pricing strategy in Ourika involves understanding monthly ADR fluctuations. The Average Daily Rate (ADR) for Airbnb in Ourika typically peaks in August and dips lowest during March. Leveraging Airbnb dynamic pricing tools or strategies based on this seasonality can significantly boost revenue. Here's a look at the typical nightly rates achieved:
- Best-in-class properties (Top 10%) command rates of $325+ per night, often due to premium features or locations.
- Strong performing properties (Top 25%) achieve nightly rates of $237 or more.
- Typical properties (Median) charge around $162 per night.
- Entry-level properties (Bottom 25%) earn around $96 per night.
Average Daily Rate (ADR) Trend by Month in Ourika
Get Live Ourika Market Intelligence 👇

Explore Real-time Analytics
Airbnb Seasonality Analysis & Trends in Ourika (2026)
Peak Season (August, July, April)
- Revenue averages $2,735 per month
- Occupancy rates average 44.0%
- Daily rates average $193
Shoulder Season
- Revenue averages $1,433 per month
- Occupancy maintains around 25.1%
- Daily rates hold near $183
Low Season (January, February, March)
- Revenue drops to average $1,019 per month
- Occupancy decreases to average 23.2%
- Daily rates adjust to average $173
Seasonality Insights for Ourika
- The Airbnb seasonality in Ourika shows highly seasonal trends requiring careful strategy. While the sections above show seasonal averages, it's also insightful to look at the extremes:
- During the high season, the absolute peak month showcases Ourika's highest earning potential, with monthly revenues capable of climbing to $3,476, occupancy reaching a high of 51.3%, and ADRs peaking at $205.
- Conversely, the slowest single month of the year, typically falling within the low season, marks the market's lowest point. In this month, revenue might dip to $894, occupancy could drop to 19.4%, and ADRs may adjust down to $169.
- Understanding both the seasonal averages and these monthly peaks and troughs in revenue, occupancy, and ADR is crucial for maximizing your Airbnb profit potential in Ourika.
Seasonal Strategies for Maximizing Profit
- Peak Season: Maximize revenue through premium pricing and potentially longer minimum stays. Ensure high availability.
- Low Season: Offer competitive pricing, special promotions (e.g., extended stay discounts), and flexible cancellation policies. Target off-season travelers like remote workers or budget-conscious guests.
- Shoulder Seasons: Implement dynamic pricing that balances peak and low rates. Target weekend travelers or specific events. Offer slightly more flexible terms than peak season.
- Regularly analyze your own performance against these Ourika seasonality benchmarks and adjust your pricing and availability strategy accordingly.
Best Areas for Airbnb Investment in Ourika (2026)
Exploring the top neighborhoods for short-term rentals in Ourika? This section highlights key areas, outlining why they are attractive for hosts and guests, along with notable local attractions. Consider these locations based on your target guest profile and investment strategy.
| Neighborhood / Area | Why Host Here? (Target Guests & Appeal) | Key Attractions & Landmarks |
|---|---|---|
| Ourika Valley | A stunning valley located near Marrakech, known for its natural beauty, traditional Berber villages, and the Atlas Mountains. Ideal for travelers seeking relaxation and outdoor activities such as hiking and exploring waterfalls. | Ourika River, Setti Fatma Waterfalls, Berber Traditional Markets, Atlas Mountain Views, Flora and Fauna Tours |
| Oukaimeden | One of the highest ski resorts in Africa, attracting adventure seekers and ski enthusiasts in winter, and hikers in summer. Perfect for outdoor activities year-round. | Oukaimeden Ski Resort, Akkoub Valley, Spectacular Mountain Scenery, Hiking Trails, Local Berber Culture |
| Imlil | A base for climbing Mount Toubkal, the highest peak in North Africa. Attracts trekkers and outdoor adventurers looking for challenging hikes and stunning views. | Mount Toubkal, Toubkal National Park, Berber Villages, Aremd Village, Hiking and Trekking Routes |
| Marrakech Medina | The historic center of Marrakech, famous for its vibrant markets, palaces, and rich cultural heritage, drawing tourists eager to experience traditional Moroccan life. | Jemaa el-Fnaa, Koutoubia Mosque, Saadian Tombs, Palais Bahia, Souks of Marrakech |
| Agafay Desert | A unique desert landscape near Marrakech, offering opportunities for camel rides and glamping experiences under the stars. Attractive to those wanting a desert adventure without traveling far. | Camel Riding Tours, Stargazing Experiences, Desert ATV Tours, Berber Camps |
| Atlas Mountains | A beautiful mountain range providing breathtaking scenery, hiking trails, and cultural experiences in Berber villages. Ideal for nature lovers and adventure enthusiasts. | Ait Benhaddou, Dades Gorge, Todra Gorge, Berber Villages, Various Trekking Opportunities |
| Asni | A charming village known for its beautiful surroundings, local markets, and access to hiking paths in the Atlas Mountains. Great for travelers looking for authentic tranquility. | Asni Market, Cascades d'Ouzoud, Trekking Paths, Views of Mount Toubkal, Local Berber Crafts |
| Skoura | A picturesque oasis in the south of Morocco, famous for its palm groves and kasbahs. Attracts visitors looking for a unique cultural experience and beautiful scenery. | Skoura Palm Grove, Kasbah Amridil, Local Craftsmen's Workshops, Stunning Desert Landscapes, Historical Kasbahs |
Understanding Airbnb License Requirements & STR Laws in Ourika (2026)
While Ourika, Marrakech-Safi, Morocco currently shows low STR regulations, specific Airbnb license requirements might still exist or change. Always verify the latest short term rental regulations and Airbnb license requirements directly with local government authorities for Ourika to ensure full compliance before hosting.
(Source: AirROI data, 2026, based on 3% licensed listings)
Top Performing Airbnb Properties in Ourika (2026)
Benchmark your potential! Explore examples of top-performing Airbnb properties in Ourikabased on Trailing Twelve Month (TTM) revenue. Analyze their characteristics, revenue, occupancy rate, and ADR to understand what drives success in this market.
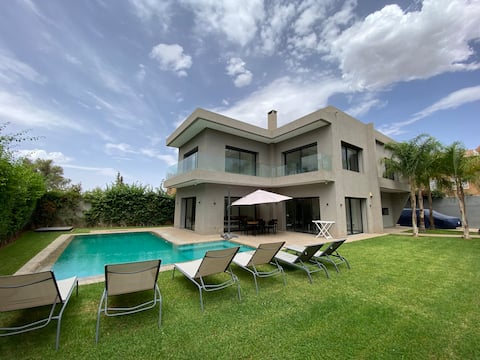
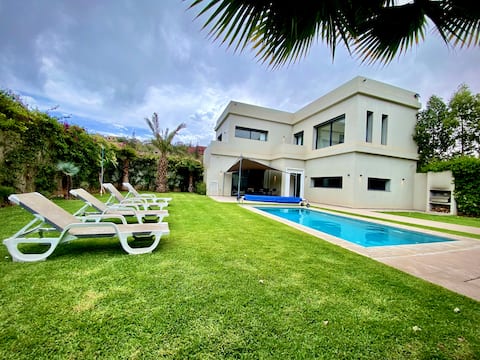
Villa Kamar free heated pool
Entire Place • 4 bedrooms
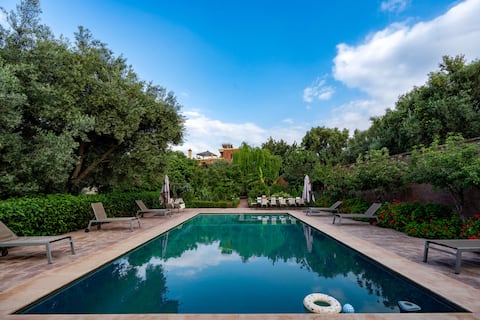
Villa of the Three Monkeys
Entire Place • 4 bedrooms
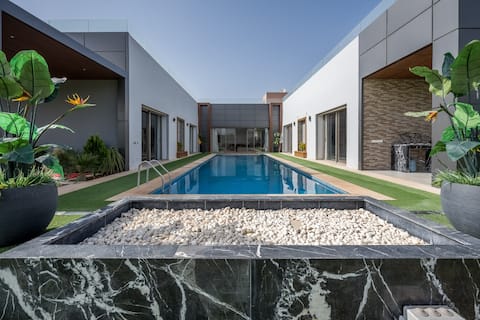
Modern VILLA with pool
Entire Place • 4 bedrooms
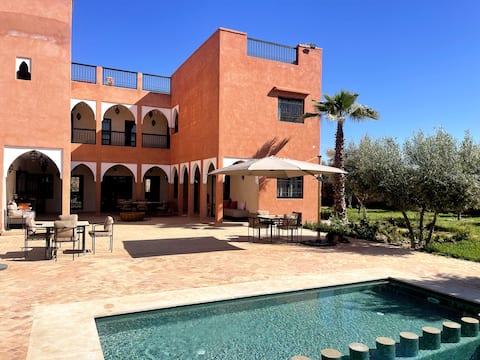
Luxury Riad La VillaRouge Marrakech
Entire Place • 6 bedrooms
Nejma d'Ourika Marrakech pool heating possible
Entire Place • 3 bedrooms
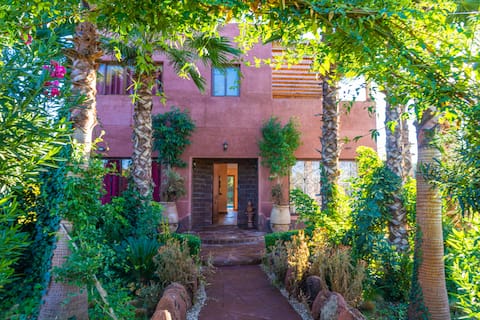
Villa al-Janb
Entire Place • 3 bedrooms
Note: Performance varies based on location, size, amenities, seasonality, and management quality. Data reflects the past 12 months.
Top Performing Airbnb Hosts in Ourika (2026)
Learn from the best! This table showcases top-performing Airbnb hosts in Ourika based on the number of properties managed and estimated total revenue over the past year. Analyze their scale and performance metrics.
| Host Name | Properties | Grossing Revenue | Stay Reviews | Avg Rating |
|---|---|---|---|---|
| Mosa | 2 | $49,828 | 85 | 4.89/5.0 |
| Mohamed | 1 | $44,235 | 89 | 4.80/5.0 |
| Zineb | 1 | $40,961 | 10 | 5.00/5.0 |
| Sabrina | 1 | $39,858 | 8 | 4.63/5.0 |
| Yassine | 3 | $32,905 | 73 | 4.89/5.0 |
| Mohamed | 1 | $30,886 | 2 | Not Rated |
| Nadia | 1 | $24,181 | 4 | 4.00/5.0 |
| Zahra | 1 | $17,823 | 9 | 5.00/5.0 |
| Anas | 1 | $16,977 | 4 | 5.00/5.0 |
| Amine | 1 | $15,687 | 19 | 4.84/5.0 |
Analyzing the strategies of top hosts, such as their property selection, pricing, and guest communication, can offer valuable lessons for optimizing your own Airbnb operations in Ourika.
Dive Deeper: Advanced Ourika STR Market Data (2026)
Ready to unlock more insights? AirROI provides access to advanced metrics and comprehensive Airbnb data for Ourika. Explore detailed analytics beyond this report to refine your investment strategy, optimize pricing, and maximize your vacation rental profits.
Explore Advanced MetricsOurika Short-Term Rental Market Composition (2026): Property & Room Types
Room Type Distribution
Property Type Distribution
Market Composition Insights for Ourika
- The Ourika Airbnb market composition is heavily skewed towards Entire Home/Apt listings, which make up 92.5% of the 40 active rentals. This indicates strong guest preference for privacy and space.
- Looking at the property type distribution in Ourika, House properties are the most common (80%), reflecting the local real estate landscape.
- Houses represent a significant 80% portion, catering likely to families or larger groups.
- The presence of 7.5% Hotel/Boutique listings indicates integration with traditional hospitality.
- Smaller segments like unique stays (combined 2.5%) offer potential for unique stay experiences.
Ourika Airbnb Room Capacity Analysis (2026): Bedroom Distribution
Distribution of Listings by Number of Bedrooms
Room Capacity Insights for Ourika
- The dominant room capacity in Ourika is 3 bedrooms listings, making up 25% of the market. This suggests a strong demand for properties suitable for families or small groups.
- Together, 3 bedrooms and 4 bedrooms properties represent 47.5% of the active Airbnb listings in Ourika, indicating a high concentration in these sizes.
- A significant 70.0% of listings offer 3+ bedrooms, catering to larger groups and families seeking more space in Ourika.
Ourika Vacation Rental Guest Capacity Trends (2026)
Distribution of Listings by Guest Capacity
Guest Capacity Insights for Ourika
- The most common guest capacity trend in Ourika vacation rentals is listings accommodating 8+ guests (62.5%). This suggests the primary traveler segment is likely larger groups.
- Properties designed for 8+ guests and 6 guests dominate the Ourika STR market, accounting for 77.5% of listings.
- 80.0% of properties accommodate 6+ guests, serving the market segment for larger families or group travel in Ourika.
- On average, properties in Ourika are equipped to host 6.8 guests.
Ourika Airbnb Booking Patterns (2026): Available vs. Booked Days
Available Days Distribution
Booked Days Distribution
Booking Pattern Insights for Ourika
- The most common availability pattern in Ourika falls within the 271-366 days range, representing 77.5% of listings. This suggests many properties have significant open periods on their calendars.
- Approximately 100.0% of listings show high availability (181+ days open annually), indicating potential for increased bookings or specific owner usage patterns.
- For booked days, the 31-90 days range is most frequent in Ourika (42.5%), reflecting common guest stay durations or potential owner blocking patterns.
Ourika Airbnb Minimum Stay Requirements Analysis
Distribution of Listings by Minimum Night Requirement
1 Night
11 listings
27.5% of total
2 Nights
17 listings
42.5% of total
3 Nights
4 listings
10% of total
4-6 Nights
1 listings
2.5% of total
30+ Nights
7 listings
17.5% of total
Key Insights
- The most prevalent minimum stay requirement in Ourika is 2 Nights, adopted by 42.5% of listings. This highlights the market's preference for shorter, flexible bookings.
- A strong majority (70.0%) of the Ourika Airbnb data shows acceptance of very short stays (1-2 nights), indicating a dynamic, high-turnover market.
- A significant segment (17.5%) caters to monthly stays (30+ nights) in Ourika, pointing to opportunities in the extended-stay market.
Recommendations
- Align with the market by considering a 2 Nights minimum stay, as 42.5% of Ourika hosts use this setting.
- If feasible, allowing 1-night stays, especially midweek or during low season, could capture last-minute bookings, as only 27.5% currently do.
- Explore offering discounts for stays of 30+ nights to attract the 17.5% of the market seeking extended stays.
- Adjust minimum nights based on seasonality – potentially shorter during low season and longer during peak demand periods in Ourika.
Ourika Airbnb Cancellation Policy Trends Analysis (2026)
Limited
2 listings
5% of total
Flexible
16 listings
40% of total
Moderate
9 listings
22.5% of total
Firm
13 listings
32.5% of total
Cancellation Policy Insights for Ourika
- The prevailing Airbnb cancellation policy trend in Ourika is Flexible, used by 40% of listings.
- There's a relatively balanced mix between guest-friendly (62.5%) and stricter (32.5%) policies, offering choices for different guest needs.
Recommendations for Hosts
- Consider adopting a Flexible policy to align with the 40% market standard in Ourika.
- Regularly review your cancellation policy against competitors and market demand shifts in Ourika.
Ourika STR Booking Lead Time Analysis (2026)
Average Booking Lead Time by Month
Booking Lead Time Insights for Ourika
- The overall average booking lead time for vacation rentals in Ourika is 33 days.
- Guests book furthest in advance for stays during August (average 42 days), likely coinciding with peak travel demand or local events.
- The shortest booking windows occur for stays in February (average 8 days), indicating more last-minute travel plans during this time.
- Seasonally, Fall (36 days avg.) sees the longest lead times, while Winter (24 days avg.) has the shortest, reflecting typical travel planning cycles.
Recommendations for Hosts
- Use the overall average lead time (33 days) as a baseline for your pricing and availability strategy in Ourika.
- During February, focus on last-minute booking availability and promotions, as guests book with very short notice (8 days avg.).
- Target marketing efforts for the Fall season well in advance (at least 36 days) to capture early planners.
- Monitor your own booking lead times against these Ourika averages to identify opportunities for dynamic pricing adjustments.
Popular & Essential Airbnb Amenities in Ourika (2026)
Amenity Prevalence
Amenity Insights for Ourika
- Essential amenities in Ourika that guests expect include: Free parking on premises, Kitchen, Hot water. Lacking these (any) could significantly impact bookings.
- Popular amenities like Washer, TV, Pool are common but not universal. Offering these can provide a competitive edge.
- A pool is a highly desired but not standard amenity, making it a key feature for attracting guests seeking leisure in Ourika.
- Warning: Wifi is not universally provided but is considered essential globally. Ensure reliable Wifi is offered.
Recommendations for Hosts
- Ensure your listing includes all essential amenities for Ourika: Free parking on premises, Kitchen, Hot water.
- Prioritize adding missing essentials: Kitchen, Hot water.
- Consider adding popular differentiators like Washer or TV to increase appeal.
- Highlight unique or less common amenities you offer (e.g., hot tub, dedicated workspace, EV charger) in your listing description and photos.
- Regularly check competitor amenities in Ourika to stay competitive.
Ourika Airbnb Guest Demographics & Profile Analysis (2026)
Guest Profile Summary for Ourika
- The typical guest profile for Airbnb in Ourika consists of predominantly international visitors (90%), with top international origins including United Kingdom, typically belonging to the Post-2000s (Gen Z/Alpha) group (50%), primarily speaking English or French.
- Domestic travelers account for 10.3% of guests.
- Key international markets include France (30.9%) and United Kingdom (17.5%).
- Top languages spoken are English (40.5%) followed by French (25%).
- A significant demographic segment is the Post-2000s (Gen Z/Alpha) group, representing 50% of guests.
Recommendations for Hosts
- Focus marketing internationally, particularly towards travelers from United Kingdom.
- Tailor amenities and listing descriptions to appeal to the dominant Post-2000s (Gen Z/Alpha) demographic (e.g., highlight fast WiFi, smart home features, local guides).
- Highlight unique local experiences or amenities relevant to the primary guest profile.
- Consider seasonal promotions aligned with peak travel times for key origin markets.
Nearby Short-Term Rental Market Comparison
How does the Ourika Airbnb market stack up against its neighbors? Compare key performance metrics like average monthly revenue, ADR, and occupancy rates in surrounding areas to understand the broader regional STR landscape.
| Market | Active Properties | Monthly Revenue | Daily Rate | Avg. Occupancy |
|---|---|---|---|---|
| Tamazouzte | 13 | $5,719 | $598.25 | 36% |
| Al Ouidane | 291 | $4,417 | $500.02 | 38% |
| Sidi Abdallah Ghiat سيدي عبد الله غيات | 84 | $3,889 | $477.80 | 36% |
| Tameslouht | 90 | $3,556 | $430.48 | 33% |
| Oulad Hassoune | 102 | $3,051 | $388.70 | 33% |
| Tassoultante | 464 | $2,600 | $284.71 | 40% |
| Mechouar Kasbah | 321 | $1,963 | $216.60 | 43% |
| Ghmate اغمات | 28 | $1,571 | $265.01 | 37% |
| Marrakesh | 8,108 | $1,408 | $151.20 | 42% |
| Ouahat Sidi Brahim | 68 | $1,380 | $169.71 | 37% |