Ounagha Airbnb Market Analysis 2026: Short Term Rental Data & Vacation Rental Statistics in Marrakech-Safi, Morocco
Is Airbnb profitable in Ounagha in 2026? Explore comprehensive Airbnb analytics for Ounagha, Marrakech-Safi, Morocco to uncover income potential. This 2026 STR market report for Ounagha, based on AirROI data from February 2025 to January 2026, reveals key trends in the niche market of 89 active listings.
Whether you're considering an Airbnb investment in Ounagha, optimizing your existing vacation rental, or exploring rental arbitrage opportunities, understanding the Ounagha Airbnb data is crucial. Leveraging the low regulation environment is key to maximizing your short term rental income potential. Let's dive into the specifics.
Key Ounagha Airbnb Performance Metrics Overview
Monthly Airbnb Revenue Variations & Income Potential in Ounagha (2026)
Understanding the monthly revenue variations for Airbnb listings in Ounagha is key to maximizing your short term rental income potential. Seasonality significantly impacts earnings. Our analysis, based on data from the past 12 months, shows that the peak revenue month for STRs in Ounagha is typically August, while February often presents the lowest earnings, highlighting opportunities for strategic pricing adjustments during shoulder and low seasons. Explore the typical Airbnb income in Ounagha across different performance tiers:
- Best-in-class properties (Top 10%) achieve $6,718+ monthly, often utilizing dynamic pricing and superior guest experiences.
- Strong performing properties (Top 25%) earn $3,562 or more, indicating effective management and desirable locations/amenities.
- Typical properties (Median) generate around $1,926 per month, representing the average market performance.
- Entry-level properties (Bottom 25%) see earnings around $929, often with potential for optimization.
Average Monthly Airbnb Earnings Trend in Ounagha
Ounagha Airbnb Occupancy Rate Trends (2026)
Maximize your bookings by understanding the Ounagha STR occupancy trends. Seasonal demand shifts significantly influence how often properties are booked. Typically, Augustsees the highest demand (peak season occupancy), while January experiences the lowest (low season). Effective strategies, like adjusting minimum stays or offering promotions, can boost occupancy during slower periods. Here's how different property tiers perform in Ounagha:
- Best-in-class properties (Top 10%) achieve 75%+ occupancy, indicating high desirability and potentially optimized availability.
- Strong performing properties (Top 25%) maintain 53% or higher occupancy, suggesting good market fit and guest satisfaction.
- Typical properties (Median) have an occupancy rate around 33%.
- Entry-level properties (Bottom 25%) average 17% occupancy, potentially facing higher vacancy.
Average Monthly Occupancy Rate Trend in Ounagha
Average Daily Rate (ADR) Airbnb Trends in Ounagha (2026)
Effective short term rental pricing strategy in Ounagha involves understanding monthly ADR fluctuations. The Average Daily Rate (ADR) for Airbnb in Ounagha typically peaks in August and dips lowest during February. Leveraging Airbnb dynamic pricing tools or strategies based on this seasonality can significantly boost revenue. Here's a look at the typical nightly rates achieved:
- Best-in-class properties (Top 10%) command rates of $440+ per night, often due to premium features or locations.
- Strong performing properties (Top 25%) achieve nightly rates of $317 or more.
- Typical properties (Median) charge around $195 per night.
- Entry-level properties (Bottom 25%) earn around $105 per night.
Average Daily Rate (ADR) Trend by Month in Ounagha
Get Live Ounagha Market Intelligence 👇

Explore Real-time Analytics
Airbnb Seasonality Analysis & Trends in Ounagha (2026)
Peak Season (August, July, September)
- Revenue averages $4,524 per month
- Occupancy rates average 50.9%
- Daily rates average $255
Shoulder Season
- Revenue averages $2,728 per month
- Occupancy maintains around 34.0%
- Daily rates hold near $233
Low Season (January, February, March)
- Revenue drops to average $1,981 per month
- Occupancy decreases to average 31.0%
- Daily rates adjust to average $216
Seasonality Insights for Ounagha
- The Airbnb seasonality in Ounagha shows highly seasonal trends requiring careful strategy. While the sections above show seasonal averages, it's also insightful to look at the extremes:
- During the high season, the absolute peak month showcases Ounagha's highest earning potential, with monthly revenues capable of climbing to $5,549, occupancy reaching a high of 61.9%, and ADRs peaking at $264.
- Conversely, the slowest single month of the year, typically falling within the low season, marks the market's lowest point. In this month, revenue might dip to $1,954, occupancy could drop to 19.7%, and ADRs may adjust down to $207.
- Understanding both the seasonal averages and these monthly peaks and troughs in revenue, occupancy, and ADR is crucial for maximizing your Airbnb profit potential in Ounagha.
Seasonal Strategies for Maximizing Profit
- Peak Season: Maximize revenue through premium pricing and potentially longer minimum stays. Ensure high availability.
- Low Season: Offer competitive pricing, special promotions (e.g., extended stay discounts), and flexible cancellation policies. Target off-season travelers like remote workers or budget-conscious guests.
- Shoulder Seasons: Implement dynamic pricing that balances peak and low rates. Target weekend travelers or specific events. Offer slightly more flexible terms than peak season.
- Regularly analyze your own performance against these Ounagha seasonality benchmarks and adjust your pricing and availability strategy accordingly.
Best Areas for Airbnb Investment in Ounagha (2026)
Exploring the top neighborhoods for short-term rentals in Ounagha? This section highlights key areas, outlining why they are attractive for hosts and guests, along with notable local attractions. Consider these locations based on your target guest profile and investment strategy.
| Neighborhood / Area | Why Host Here? (Target Guests & Appeal) | Key Attractions & Landmarks |
|---|---|---|
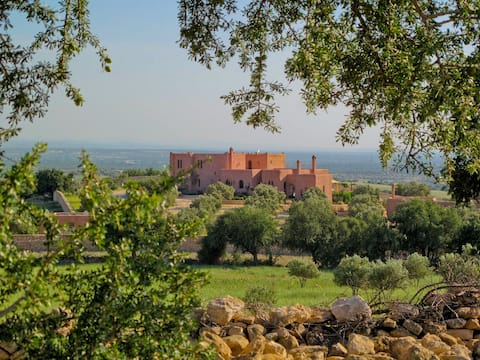
| Ounagha Beach | Northeast of Essaouira, it offers beautiful beaches and a laid-back atmosphere. Ideal for tourists looking to relax and enjoy the sun and sea. | Ounagha Beach, Sidi Kaouki Beach, Local seafood restaurants, Kitesurfing spots, Surrounding dunes |
| Essaouira Medina | A UNESCO World Heritage site, the Medina is famous for its historic architecture and vibrant souks, making it a hot spot for tourists. | Essaouira Citadel, Skala de la Ville, Souks of Essaouira, Moulay Hassan Square, Local craft shops |
| Mogador Island | Historic island with rich history and scenic views. A perfect spot for history enthusiasts and those traveling for nature experiences. | Mogador Island beaches, Ancient ruins, Bird watching, Scenic boat rides, Wildlife exploration |
| Sidi Kaouki | A small fishing village known for its laid-back vibe and excellent surfing conditions, popular among backpackers and surfers. | Sidi Kaouki Beach, Surf schools, Local cafes, Windsurfing opportunities, Scenic coastal paths |
| Coastal Roads | The scenic coastal roads near Ounagha are perfect for travelers interested in beautiful drives with sea views. | Scenic viewpoints, Local roadside cafes, Cultural landmarks, Natural parks, Photography opportunities |
| Dayet Aoua | A picturesque lake located near Ounagha, it offers a serene environment for nature lovers and those seeking a tranquil getaway. | Dayet Aoua Lake, Hiking trails, Fishing spots, Picnic areas, Wildlife observation |
| Bordj El Berod | A historical fortress offering views over the coast, it attracts visitors interested in history and photography. | Fortress ruins, Panoramic views of the coast, Historical significance, Birdwatching, Cultural events |
| Tamraght | A vibrant area popular among surfers and adventurers, offering a mix of local culture and outdoor activities. | Tamraght Beach, Surfing spots, Local markets, Cafes and restaurants, Oceanfront views |
Understanding Airbnb License Requirements & STR Laws in Ounagha (2026)
While Ounagha, Marrakech-Safi, Morocco currently shows low STR regulations, specific Airbnb license requirements might still exist or change. Always verify the latest short term rental regulations and Airbnb license requirements directly with local government authorities for Ounagha to ensure full compliance before hosting.
(Source: AirROI data, 2026, finding no licensed listings among those analyzed)
Top Performing Airbnb Properties in Ounagha (2026)
Benchmark your potential! Explore examples of top-performing Airbnb properties in Ounaghabased on Trailing Twelve Month (TTM) revenue. Analyze their characteristics, revenue, occupancy rate, and ADR to understand what drives success in this market.
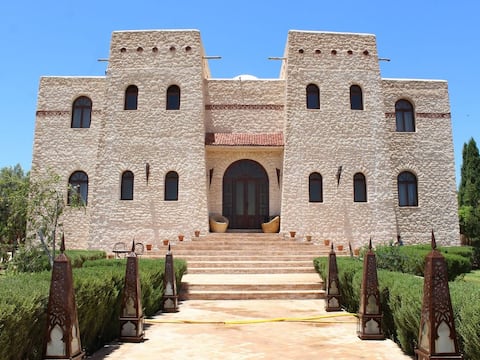
Privatization of Domaine la colline des oliviers (Olive Hill Estate)
Entire Place • 8 bedrooms
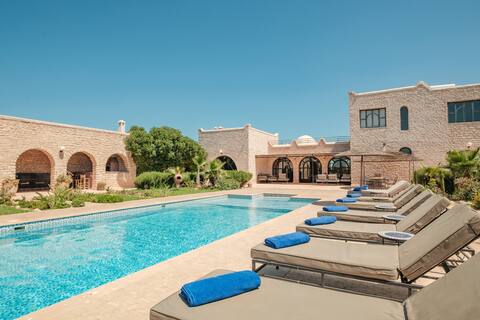
Luxurious Riad Dharma with pool, at PatPhil's
Entire Place • 7 bedrooms
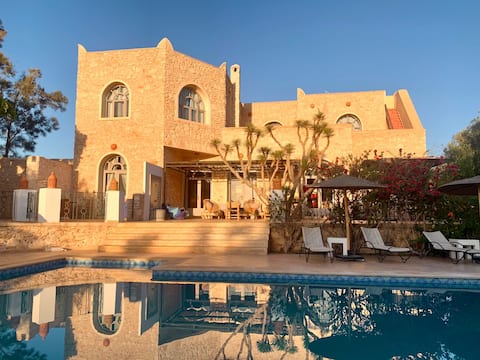
Villa Aruba - Staff and Heated Pool
Entire Place • 5 bedrooms
Domaine d'Eden - Heated Pool, Spa & Chef
Entire Place • 5 bedrooms
Bay'T NB - 6 bedroom villa 20 minutes from Essaouira
Entire Place • 6 bedrooms
Beautiful Luxury Villa with Pool and Yoga Area, 20 Guests Max
Entire Place • 7 bedrooms
Note: Performance varies based on location, size, amenities, seasonality, and management quality. Data reflects the past 12 months.
Top Performing Airbnb Hosts in Ounagha (2026)
Learn from the best! This table showcases top-performing Airbnb hosts in Ounagha based on the number of properties managed and estimated total revenue over the past year. Analyze their scale and performance metrics.
| Host Name | Properties | Grossing Revenue | Stay Reviews | Avg Rating |
|---|---|---|---|---|
| Philippe | 1 | $217,228 | 26 | 4.81/5.0 |
| Fatima Ezzahra | 1 | $149,730 | 45 | 4.87/5.0 |
| Teldj | 4 | $147,783 | 197 | 4.95/5.0 |
| Eddy | 1 | $109,516 | 15 | 5.00/5.0 |
| Philippe | 1 | $96,519 | 28 | 5.00/5.0 |
| Nicolas | 1 | $82,262 | 9 | 5.00/5.0 |
| Carla | 1 | $80,716 | 23 | 5.00/5.0 |
| Kameleon | 5 | $72,043 | 143 | 4.92/5.0 |
| Yan | 6 | $66,366 | 91 | 4.74/5.0 |
| Karl | 2 | $58,907 | 25 | 4.88/5.0 |
Analyzing the strategies of top hosts, such as their property selection, pricing, and guest communication, can offer valuable lessons for optimizing your own Airbnb operations in Ounagha.
Dive Deeper: Advanced Ounagha STR Market Data (2026)
Ready to unlock more insights? AirROI provides access to advanced metrics and comprehensive Airbnb data for Ounagha. Explore detailed analytics beyond this report to refine your investment strategy, optimize pricing, and maximize your vacation rental profits.
Explore Advanced MetricsOunagha Short-Term Rental Market Composition (2026): Property & Room Types
Room Type Distribution
Property Type Distribution
Market Composition Insights for Ounagha
- The Ounagha Airbnb market composition is heavily skewed towards Entire Home/Apt listings, which make up 74.2% of the 89 active rentals. This indicates strong guest preference for privacy and space.
- Looking at the property type distribution in Ounagha, House properties are the most common (75.3%), reflecting the local real estate landscape.
- Houses represent a significant 75.3% portion, catering likely to families or larger groups.
- The presence of 11.2% Hotel/Boutique listings indicates integration with traditional hospitality.
- Smaller segments like outdoor/unique, apartment/condo, others (combined 6.7%) offer potential for unique stay experiences.
Ounagha Airbnb Room Capacity Analysis (2026): Bedroom Distribution
Distribution of Listings by Number of Bedrooms
Room Capacity Insights for Ounagha
- The dominant room capacity in Ounagha is 5+ bedrooms listings, making up 25.8% of the market. This suggests a strong demand for properties suitable for families or small groups.
- Together, 5+ bedrooms and 3 bedrooms properties represent 47.1% of the active Airbnb listings in Ounagha, indicating a high concentration in these sizes.
- A significant 62.8% of listings offer 3+ bedrooms, catering to larger groups and families seeking more space in Ounagha.
Ounagha Vacation Rental Guest Capacity Trends (2026)
Distribution of Listings by Guest Capacity
Guest Capacity Insights for Ounagha
- The most common guest capacity trend in Ounagha vacation rentals is listings accommodating 8+ guests (55.1%). This suggests the primary traveler segment is likely larger groups.
- Properties designed for 8+ guests and 7 guests dominate the Ounagha STR market, accounting for 61.8% of listings.
- 67.4% of properties accommodate 6+ guests, serving the market segment for larger families or group travel in Ounagha.
- On average, properties in Ounagha are equipped to host 5.5 guests.
Ounagha Airbnb Booking Patterns (2026): Available vs. Booked Days
Available Days Distribution
Booked Days Distribution
Booking Pattern Insights for Ounagha
- The most common availability pattern in Ounagha falls within the 271-366 days range, representing 62.9% of listings. This suggests many properties have significant open periods on their calendars.
- Approximately 86.5% of listings show high availability (181+ days open annually), indicating potential for increased bookings or specific owner usage patterns.
- For booked days, the 31-90 days range is most frequent in Ounagha (37.1%), reflecting common guest stay durations or potential owner blocking patterns.
- A notable 15.7% of properties secure long booking periods (181+ days booked per year), highlighting successful long-term rental strategies or significant owner usage.
Ounagha Airbnb Minimum Stay Requirements Analysis
Distribution of Listings by Minimum Night Requirement
1 Night
33 listings
37.1% of total
2 Nights
11 listings
12.4% of total
3 Nights
5 listings
5.6% of total
4-6 Nights
5 listings
5.6% of total
7-29 Nights
3 listings
3.4% of total
30+ Nights
32 listings
36% of total
Key Insights
- The most prevalent minimum stay requirement in Ounagha is 1 Night, adopted by 37.1% of listings. This highlights the market's preference for shorter, flexible bookings.
- A significant segment (36%) caters to monthly stays (30+ nights) in Ounagha, pointing to opportunities in the extended-stay market.
Recommendations
- Align with the market by considering a 1 Night minimum stay, as 37.1% of Ounagha hosts use this setting.
- Explore offering discounts for stays of 30+ nights to attract the 36% of the market seeking extended stays.
- Adjust minimum nights based on seasonality – potentially shorter during low season and longer during peak demand periods in Ounagha.
Ounagha Airbnb Cancellation Policy Trends Analysis (2026)
Super Strict 30 Days
1 listings
1.1% of total
Limited
1 listings
1.1% of total
Super Strict 60 Days
1 listings
1.1% of total
Flexible
18 listings
20.7% of total
Moderate
35 listings
40.2% of total
Firm
24 listings
27.6% of total
Strict
7 listings
8% of total
Cancellation Policy Insights for Ounagha
- The prevailing Airbnb cancellation policy trend in Ounagha is Moderate, used by 40.2% of listings.
- There's a relatively balanced mix between guest-friendly (60.9%) and stricter (35.6%) policies, offering choices for different guest needs.
- Strict cancellation policies are quite rare (8%), potentially making listings with this policy less competitive unless justified by high demand or property type.
Recommendations for Hosts
- Consider adopting a Moderate policy to align with the 40.2% market standard in Ounagha.
- Using a Strict policy might deter some guests, as only 8% of listings use it. Evaluate if potential revenue protection outweighs possible lower booking rates.
- Regularly review your cancellation policy against competitors and market demand shifts in Ounagha.
Ounagha STR Booking Lead Time Analysis (2026)
Average Booking Lead Time by Month
Booking Lead Time Insights for Ounagha
- The overall average booking lead time for vacation rentals in Ounagha is 55 days.
- Guests book furthest in advance for stays during December (average 88 days), likely coinciding with peak travel demand or local events.
- The shortest booking windows occur for stays in March (average 31 days), indicating more last-minute travel plans during this time.
- Seasonally, Summer (66 days avg.) sees the longest lead times, while Spring (46 days avg.) has the shortest, reflecting typical travel planning cycles.
Recommendations for Hosts
- Use the overall average lead time (55 days) as a baseline for your pricing and availability strategy in Ounagha.
- For December stays, consider implementing length-of-stay discounts or slightly higher rates for bookings made less than 88 days out to capitalize on advance planning.
- Target marketing efforts for the Summer season well in advance (at least 66 days) to capture early planners.
- Monitor your own booking lead times against these Ounagha averages to identify opportunities for dynamic pricing adjustments.
Popular & Essential Airbnb Amenities in Ounagha (2026)
Amenity Prevalence
Amenity Insights for Ounagha
- Essential amenities in Ounagha that guests expect include: Pool, Free parking on premises. Lacking these (any) could significantly impact bookings.
- Popular amenities like Wifi, Washer, Outdoor dining area are common but not universal. Offering these can provide a competitive edge.
- Warning: Wifi is not universally provided but is considered essential globally. Ensure reliable Wifi is offered.
Recommendations for Hosts
- Ensure your listing includes all essential amenities for Ounagha: Pool, Free parking on premises.
- Prioritize adding missing essentials: Pool, Free parking on premises.
- Consider adding popular differentiators like Wifi or Washer to increase appeal.
- Highlight unique or less common amenities you offer (e.g., hot tub, dedicated workspace, EV charger) in your listing description and photos.
- Regularly check competitor amenities in Ounagha to stay competitive.
Ounagha Airbnb Guest Demographics & Profile Analysis (2026)
Guest Profile Summary for Ounagha
- The typical guest profile for Airbnb in Ounagha consists of predominantly international visitors (92%), with top international origins including United Kingdom, typically belonging to the Post-2000s (Gen Z/Alpha) group (50%), primarily speaking English or French.
- Domestic travelers account for 7.7% of guests.
- Key international markets include France (44.5%) and United Kingdom (11.8%).
- Top languages spoken are English (35.3%) followed by French (27.9%).
- A significant demographic segment is the Post-2000s (Gen Z/Alpha) group, representing 50% of guests.
Recommendations for Hosts
- Focus marketing internationally, particularly towards travelers from United Kingdom.
- Tailor amenities and listing descriptions to appeal to the dominant Post-2000s (Gen Z/Alpha) demographic (e.g., highlight fast WiFi, smart home features, local guides).
- Highlight unique local experiences or amenities relevant to the primary guest profile.
- Consider seasonal promotions aligned with peak travel times for key origin markets.
Nearby Short-Term Rental Market Comparison
How does the Ounagha Airbnb market stack up against its neighbors? Compare key performance metrics like average monthly revenue, ADR, and occupancy rates in surrounding areas to understand the broader regional STR landscape.
| Market | Active Properties | Monthly Revenue | Daily Rate | Avg. Occupancy |
|---|---|---|---|---|
| caïdat d'Aquermoud | 10 | $4,684 | $343.99 | 52% |
| Tameslouht | 90 | $3,556 | $430.48 | 33% |
| caïdat de Smimou | 16 | $2,804 | $216.12 | 40% |
| caïdat d'Ounagha | 14 | $2,755 | $243.35 | 30% |
| Aguerd اكرض | 73 | $2,750 | $314.32 | 39% |
| Drarga | 17 | $1,456 | $157.86 | 32% |
| Inezgane | 11 | $1,265 | $313.95 | 29% |
| Saâda | 41 | $1,210 | $182.84 | 31% |
| Ghazoua | 18 | $1,095 | $166.41 | 33% |
| Taghazout | 528 | $1,058 | $101.53 | 44% |