Marrakesh Airbnb Market Analysis 2026: Short Term Rental Data & Vacation Rental Statistics in Marrakech-Safi, Morocco
Is Airbnb profitable in Marrakesh in 2026? Explore comprehensive Airbnb analytics for Marrakesh, Marrakech-Safi, Morocco to uncover income potential. This 2026 STR market report for Marrakesh, based on AirROI data from February 2025 to January 2026, reveals key trends in the bustling market of 8,108 active listings.
Whether you're considering an Airbnb investment in Marrakesh, optimizing your existing vacation rental, or exploring rental arbitrage opportunities, understanding the Marrakesh Airbnb data is crucial. Leveraging the low regulation environment is key to maximizing your short term rental income potential. Let's dive into the specifics.
Key Marrakesh Airbnb Performance Metrics Overview
Monthly Airbnb Revenue Variations & Income Potential in Marrakesh (2026)
Understanding the monthly revenue variations for Airbnb listings in Marrakesh is key to maximizing your short term rental income potential. Seasonality significantly impacts earnings. Our analysis, based on data from the past 12 months, shows that the peak revenue month for STRs in Marrakesh is typically October, while January often presents the lowest earnings, highlighting opportunities for strategic pricing adjustments during shoulder and low seasons. Explore the typical Airbnb income in Marrakesh across different performance tiers:
- Best-in-class properties (Top 10%) achieve $4,743+ monthly, often utilizing dynamic pricing and superior guest experiences.
- Strong performing properties (Top 25%) earn $2,351 or more, indicating effective management and desirable locations/amenities.
- Typical properties (Median) generate around $1,213 per month, representing the average market performance.
- Entry-level properties (Bottom 25%) see earnings around $560, often with potential for optimization.
Average Monthly Airbnb Earnings Trend in Marrakesh
Marrakesh Airbnb Occupancy Rate Trends (2026)
Maximize your bookings by understanding the Marrakesh STR occupancy trends. Seasonal demand shifts significantly influence how often properties are booked. Typically, Aprilsees the highest demand (peak season occupancy), while January experiences the lowest (low season). Effective strategies, like adjusting minimum stays or offering promotions, can boost occupancy during slower periods. Here's how different property tiers perform in Marrakesh:
- Best-in-class properties (Top 10%) achieve 86%+ occupancy, indicating high desirability and potentially optimized availability.
- Strong performing properties (Top 25%) maintain 71% or higher occupancy, suggesting good market fit and guest satisfaction.
- Typical properties (Median) have an occupancy rate around 45%.
- Entry-level properties (Bottom 25%) average 21% occupancy, potentially facing higher vacancy.
Average Monthly Occupancy Rate Trend in Marrakesh
Average Daily Rate (ADR) Airbnb Trends in Marrakesh (2026)
Effective short term rental pricing strategy in Marrakesh involves understanding monthly ADR fluctuations. The Average Daily Rate (ADR) for Airbnb in Marrakesh typically peaks in December and dips lowest during March. Leveraging Airbnb dynamic pricing tools or strategies based on this seasonality can significantly boost revenue. Here's a look at the typical nightly rates achieved:
- Best-in-class properties (Top 10%) command rates of $320+ per night, often due to premium features or locations.
- Strong performing properties (Top 25%) achieve nightly rates of $150 or more.
- Typical properties (Median) charge around $90 per night.
- Entry-level properties (Bottom 25%) earn around $62 per night.
Average Daily Rate (ADR) Trend by Month in Marrakesh
Get Live Marrakesh Market Intelligence 👇

Explore Real-time Analytics
Airbnb Seasonality Analysis & Trends in Marrakesh (2026)
Peak Season (October, April, August)
- Revenue averages $2,402 per month
- Occupancy rates average 51.0%
- Daily rates average $150
Shoulder Season
- Revenue averages $2,041 per month
- Occupancy maintains around 44.9%
- Daily rates hold near $153
Low Season (January, February, June)
- Revenue drops to average $1,796 per month
- Occupancy decreases to average 44.1%
- Daily rates adjust to average $151
Seasonality Insights for Marrakesh
- The Airbnb seasonality in Marrakesh shows moderate seasonality with distinct peak and low periods. While the sections above show seasonal averages, it's also insightful to look at the extremes:
- During the high season, the absolute peak month showcases Marrakesh's highest earning potential, with monthly revenues capable of climbing to $2,443, occupancy reaching a high of 56.9%, and ADRs peaking at $168.
- Conversely, the slowest single month of the year, typically falling within the low season, marks the market's lowest point. In this month, revenue might dip to $1,529, occupancy could drop to 33.4%, and ADRs may adjust down to $141.
- Understanding both the seasonal averages and these monthly peaks and troughs in revenue, occupancy, and ADR is crucial for maximizing your Airbnb profit potential in Marrakesh.
Seasonal Strategies for Maximizing Profit
- Peak Season: Maximize revenue through premium pricing and potentially longer minimum stays. Ensure high availability.
- Low Season: Offer competitive pricing, special promotions (e.g., extended stay discounts), and flexible cancellation policies. Target off-season travelers like remote workers or budget-conscious guests.
- Shoulder Seasons: Implement dynamic pricing that balances peak and low rates. Target weekend travelers or specific events. Offer slightly more flexible terms than peak season.
- Regularly analyze your own performance against these Marrakesh seasonality benchmarks and adjust your pricing and availability strategy accordingly.
Best Areas for Airbnb Investment in Marrakesh (2026)
Exploring the top neighborhoods for short-term rentals in Marrakesh? This section highlights key areas, outlining why they are attractive for hosts and guests, along with notable local attractions. Consider these locations based on your target guest profile and investment strategy.
| Neighborhood / Area | Why Host Here? (Target Guests & Appeal) | Key Attractions & Landmarks |
|---|---|---|
| Medina | The historic heart of Marrakesh, the Medina is a UNESCO World Heritage site known for its vibrant souks, traditional riads, and cultural heritage. It is a major tourist attraction, making it ideal for Airbnb hosts. | Jemaa el-Fnaa, Koutoubia Mosque, Saadian Tombs, Ben Youssef Madrasa, Marrakech Museum |
| Guéliz | A modern district with a mix of contemporary shops, cafes, and art galleries. Guéliz appeals to both tourists and locals looking for a cosmopolitan atmosphere. Perfect for short-term rentals. | Carré Eden, Jardin Majorelle, Art Galleries, Restaurants and Bars, Cinema Vox |
| Hivernage | An upscale neighborhood known for luxury hotels and fine dining. Hivernage attracts affluent travelers seeking comfort and style, making it suitable for high-end Airbnb offerings. | Palazzo des Congrès, Luxury Hotels, Nightclubs, Restaurants, Hivernage Spa |
| Palmaraie | A resort area on the outskirts of Marrakesh, known for its beautiful palm trees and luxury villas. Ideal for guests looking for a tranquil stay with access to leisure facilities. | Luxury Resorts, Golf Courses, Spa Facilities, Palmeraie Golf Club, Horse Riding Trails |
| Agdal | A family-friendly neighborhood known for its gardens and parks, including the Agdal Gardens. Agdal is convenient for visitors wanting a quieter experience while being close to the city. | Agdal Gardens, Al Maaden Golf Resort, Restaurants, Shopping Areas, Marrakech Royal Palace |
| Casablanca Road | A major thoroughfare leading into Marrakesh, featuring a mix of residential and commercial spaces. This area is appealing for those looking to stay connected to Marrakesh's key locations. | Shopping Malls, Restaurants, Cafes, Local Markets, Cultural Attractions |
| Ourika Valley | Located just outside Marrakesh, the Ourika Valley is popular for its breathtaking landscapes and traditional Berber villages. A great spot for eco-tourism and cultural experiences. | Ourika Waterfalls, Berber Markets, Traditional Berber Homes, Nature Trails, River Activities |
| Menara | Close to the airport and known for its olive groves and the Menara Gardens. Suitable for travelers who want convenience and natural beauty in proximity to the city. | Menara Gardens, Olive Groves, Marrakech Airport, Restaurants, Walking Trails |
Understanding Airbnb License Requirements & STR Laws in Marrakesh (2026)
While Marrakesh, Marrakech-Safi, Morocco currently shows low STR regulations, specific Airbnb license requirements might still exist or change. Always verify the latest short term rental regulations and Airbnb license requirements directly with local government authorities for Marrakesh to ensure full compliance before hosting.
(Source: AirROI data, 2026, based on 0% licensed listings)
Top Performing Airbnb Properties in Marrakesh (2026)
Benchmark your potential! Explore examples of top-performing Airbnb properties in Marrakeshbased on Trailing Twelve Month (TTM) revenue. Analyze their characteristics, revenue, occupancy rate, and ADR to understand what drives success in this market.

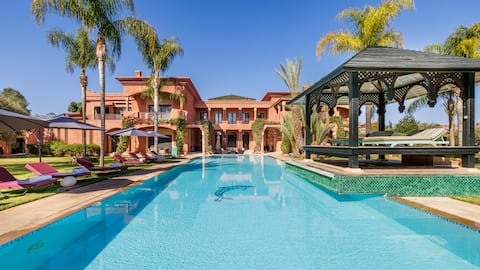
Private Hire RIAD & Heated Pool - Jemaa El Fna
Entire Place • 15 bedrooms
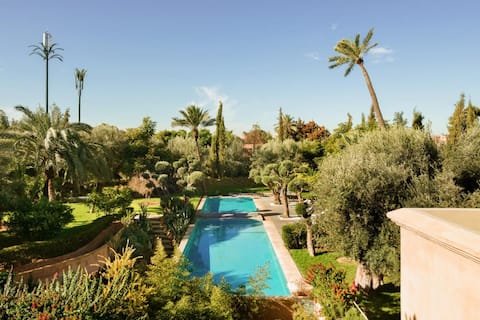
Villa Hiba Luxury & Paddle
Entire Place • 8 bedrooms

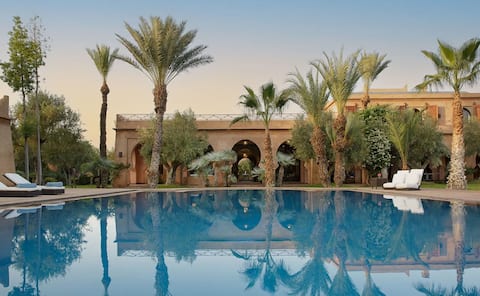
RIAD with 2 Patios & Heated Pool - MEDINA
Entire Place • 12 bedrooms
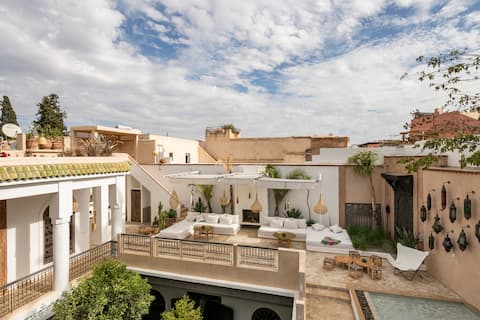
Tikida Palace 11ch Luxury, 2 Pools, Palm Grove
Entire Place • 11 bedrooms
Pool and garden | Breakfast and staff included
Entire Place • 5 bedrooms
Luxurious Riad - Rooftop Pool, AC & Staff
Entire Place • 6 bedrooms
Note: Performance varies based on location, size, amenities, seasonality, and management quality. Data reflects the past 12 months.
Top Performing Airbnb Hosts in Marrakesh (2026)
Learn from the best! This table showcases top-performing Airbnb hosts in Marrakesh based on the number of properties managed and estimated total revenue over the past year. Analyze their scale and performance metrics.
| Host Name | Properties | Grossing Revenue | Stay Reviews | Avg Rating |
|---|---|---|---|---|
| Fahd | 99 | $3,660,025 | 5836 | 4.77/5.0 |
| Julie & Anas | 28 | $2,026,617 | 1524 | 4.92/5.0 |
| Noredine | 54 | $1,571,637 | 9324 | 4.71/5.0 |
| Yan Cedric | 26 | $1,149,971 | 2150 | 4.84/5.0 |
| Anas | 34 | $896,019 | 858 | 4.76/5.0 |
| Mehdi Your Host.Ma | 36 | $811,406 | 999 | 4.79/5.0 |
| Prestige Stay | 26 | $726,104 | 1702 | 4.93/5.0 |
| Alain | 16 | $679,856 | 1290 | 4.72/5.0 |
| Prokeys | 38 | $645,210 | 1123 | 4.72/5.0 |
| WB START - Accueil Authentique | 61 | $643,617 | 1617 | 4.73/5.0 |
Analyzing the strategies of top hosts, such as their property selection, pricing, and guest communication, can offer valuable lessons for optimizing your own Airbnb operations in Marrakesh.
Dive Deeper: Advanced Marrakesh STR Market Data (2026)
Ready to unlock more insights? AirROI provides access to advanced metrics and comprehensive Airbnb data for Marrakesh. Explore detailed analytics beyond this report to refine your investment strategy, optimize pricing, and maximize your vacation rental profits.
Explore Advanced MetricsMarrakesh Short-Term Rental Market Composition (2026): Property & Room Types
Room Type Distribution
Property Type Distribution
Market Composition Insights for Marrakesh
- The Marrakesh Airbnb market composition is heavily skewed towards Entire Home/Apt listings, which make up 78.3% of the 8,108 active rentals. This indicates strong guest preference for privacy and space.
- Looking at the property type distribution in Marrakesh, Apartment/Condo properties are the most common (57.4%), reflecting the local real estate landscape.
- Houses represent a significant 18.2% portion, catering likely to families or larger groups.
- The presence of 13.4% Hotel/Boutique listings indicates integration with traditional hospitality.
- Smaller segments like outdoor/unique, others (combined 0.2%) offer potential for unique stay experiences.
Marrakesh Airbnb Room Capacity Analysis (2026): Bedroom Distribution
Distribution of Listings by Number of Bedrooms
Room Capacity Insights for Marrakesh
- The dominant room capacity in Marrakesh is 2 bedrooms listings, making up 31.6% of the market. This suggests a strong demand for properties suitable for couples or solo travelers.
- Together, 2 bedrooms and 1 bedroom properties represent 61.4% of the active Airbnb listings in Marrakesh, indicating a high concentration in these sizes.
- A significant 25.4% of listings offer 3+ bedrooms, catering to larger groups and families seeking more space in Marrakesh.
Marrakesh Vacation Rental Guest Capacity Trends (2026)
Distribution of Listings by Guest Capacity
Guest Capacity Insights for Marrakesh
- The most common guest capacity trend in Marrakesh vacation rentals is listings accommodating 4 guests (24.6%). This suggests the primary traveler segment is likely small families or groups.
- Properties designed for 4 guests and 6 guests dominate the Marrakesh STR market, accounting for 39.0% of listings.
- 30.6% of properties accommodate 6+ guests, serving the market segment for larger families or group travel in Marrakesh.
- On average, properties in Marrakesh are equipped to host 4.1 guests.
Marrakesh Airbnb Booking Patterns (2026): Available vs. Booked Days
Available Days Distribution
Booked Days Distribution
Booking Pattern Insights for Marrakesh
- The most common availability pattern in Marrakesh falls within the 271-366 days range, representing 48.7% of listings. This suggests many properties have significant open periods on their calendars.
- Approximately 75.9% of listings show high availability (181+ days open annually), indicating potential for increased bookings or specific owner usage patterns.
- For booked days, the 91-180 days range is most frequent in Marrakesh (27.7%), reflecting common guest stay durations or potential owner blocking patterns.
- A notable 25.1% of properties secure long booking periods (181+ days booked per year), highlighting successful long-term rental strategies or significant owner usage.
Marrakesh Airbnb Minimum Stay Requirements Analysis
Distribution of Listings by Minimum Night Requirement
1 Night
2690 listings
33.2% of total
2 Nights
2102 listings
25.9% of total
3 Nights
482 listings
5.9% of total
4-6 Nights
134 listings
1.7% of total
7-29 Nights
37 listings
0.5% of total
30+ Nights
2663 listings
32.8% of total
Key Insights
- The most prevalent minimum stay requirement in Marrakesh is 1 Night, adopted by 33.2% of listings. This highlights the market's preference for shorter, flexible bookings.
- A significant segment (32.8%) caters to monthly stays (30+ nights) in Marrakesh, pointing to opportunities in the extended-stay market.
Recommendations
- Align with the market by considering a 1 Night minimum stay, as 33.2% of Marrakesh hosts use this setting.
- Explore offering discounts for stays of 30+ nights to attract the 32.8% of the market seeking extended stays.
- Adjust minimum nights based on seasonality – potentially shorter during low season and longer during peak demand periods in Marrakesh.
Marrakesh Airbnb Cancellation Policy Trends Analysis (2026)
Super Strict 30 Days
33 listings
0.4% of total
Refundable
13 listings
0.2% of total
Limited
344 listings
4.3% of total
Non-refundable
6 listings
0.1% of total
Super Strict 60 Days
8 listings
0.1% of total
Flexible
2788 listings
34.5% of total
Moderate
2507 listings
31% of total
Firm
1912 listings
23.7% of total
Strict
466 listings
5.8% of total
Cancellation Policy Insights for Marrakesh
- The prevailing Airbnb cancellation policy trend in Marrakesh is Flexible, used by 34.5% of listings.
- There's a relatively balanced mix between guest-friendly (65.5%) and stricter (29.5%) policies, offering choices for different guest needs.
- Strict cancellation policies are quite rare (5.8%), potentially making listings with this policy less competitive unless justified by high demand or property type.
Recommendations for Hosts
- Consider adopting a Flexible policy to align with the 34.5% market standard in Marrakesh.
- Using a Strict policy might deter some guests, as only 5.8% of listings use it. Evaluate if potential revenue protection outweighs possible lower booking rates.
- Regularly review your cancellation policy against competitors and market demand shifts in Marrakesh.
Marrakesh STR Booking Lead Time Analysis (2026)
Average Booking Lead Time by Month
Booking Lead Time Insights for Marrakesh
- The overall average booking lead time for vacation rentals in Marrakesh is 39 days.
- Guests book furthest in advance for stays during October (average 51 days), likely coinciding with peak travel demand or local events.
- The shortest booking windows occur for stays in February (average 31 days), indicating more last-minute travel plans during this time.
- Seasonally, Fall (45 days avg.) sees the longest lead times, while Winter (36 days avg.) has the shortest, reflecting typical travel planning cycles.
Recommendations for Hosts
- Use the overall average lead time (39 days) as a baseline for your pricing and availability strategy in Marrakesh.
- For October stays, consider implementing length-of-stay discounts or slightly higher rates for bookings made less than 51 days out to capitalize on advance planning.
- Target marketing efforts for the Fall season well in advance (at least 45 days) to capture early planners.
- Monitor your own booking lead times against these Marrakesh averages to identify opportunities for dynamic pricing adjustments.
Popular & Essential Airbnb Amenities in Marrakesh (2026)
Amenity Prevalence
Amenity Insights for Marrakesh
- Essential amenities in Marrakesh that guests expect include: Wifi, Air conditioning. Lacking these (any) could significantly impact bookings.
- Popular amenities like Hot water, Kitchen, Heating are common but not universal. Offering these can provide a competitive edge.
Recommendations for Hosts
- Ensure your listing includes all essential amenities for Marrakesh: Wifi, Air conditioning.
- Prioritize adding missing essentials: Wifi, Air conditioning.
- Consider adding popular differentiators like Hot water or Kitchen to increase appeal.
- Highlight unique or less common amenities you offer (e.g., hot tub, dedicated workspace, EV charger) in your listing description and photos.
- Regularly check competitor amenities in Marrakesh to stay competitive.
Marrakesh Airbnb Guest Demographics & Profile Analysis (2026)
Guest Profile Summary for Marrakesh
- The typical guest profile for Airbnb in Marrakesh consists of predominantly international visitors (94%), with top international origins including United Kingdom, typically belonging to the Post-2000s (Gen Z/Alpha) group (50%), primarily speaking English or French.
- Domestic travelers account for 6.0% of guests.
- Key international markets include France (36.1%) and United Kingdom (15%).
- Top languages spoken are English (37%) followed by French (24.8%).
- A significant demographic segment is the Post-2000s (Gen Z/Alpha) group, representing 50% of guests.
Recommendations for Hosts
- Focus marketing internationally, particularly towards travelers from United Kingdom.
- Tailor amenities and listing descriptions to appeal to the dominant Post-2000s (Gen Z/Alpha) demographic (e.g., highlight fast WiFi, smart home features, local guides).
- Highlight unique local experiences or amenities relevant to the primary guest profile.
- Consider seasonal promotions aligned with peak travel times for key origin markets.
Nearby Short-Term Rental Market Comparison
How does the Marrakesh Airbnb market stack up against its neighbors? Compare key performance metrics like average monthly revenue, ADR, and occupancy rates in surrounding areas to understand the broader regional STR landscape.
| Market | Active Properties | Monthly Revenue | Daily Rate | Avg. Occupancy |
|---|---|---|---|---|
| Tamazouzte | 13 | $5,719 | $598.25 | 36% |
| Al Ouidane | 291 | $4,417 | $500.02 | 38% |
| Sidi Abdallah Ghiat سيدي عبد الله غيات | 84 | $3,889 | $477.80 | 36% |
| Tameslouht | 90 | $3,556 | $430.48 | 33% |
| Oulad Hassoune | 102 | $3,051 | $388.70 | 33% |
| Tassoultante | 464 | $2,600 | $284.71 | 40% |
| Mechouar Kasbah | 321 | $1,963 | $216.60 | 43% |
| Ghmate اغمات | 28 | $1,571 | $265.01 | 37% |
| Ouahat Sidi Brahim | 68 | $1,380 | $169.71 | 37% |
| Aghouatim اغواطيم | 28 | $1,309 | $184.19 | 28% |