Sidi Rahal Chatai Airbnb Market Analysis 2026: Short Term Rental Data & Vacation Rental Statistics in Casablanca-Settat, Morocco
Is Airbnb profitable in Sidi Rahal Chatai in 2026? Explore comprehensive Airbnb analytics for Sidi Rahal Chatai, Casablanca-Settat, Morocco to uncover income potential. This 2026 STR market report for Sidi Rahal Chatai, based on AirROI data from February 2025 to January 2026, reveals key trends in the niche market of 177 active listings.
Whether you're considering an Airbnb investment in Sidi Rahal Chatai, optimizing your existing vacation rental, or exploring rental arbitrage opportunities, understanding the Sidi Rahal Chatai Airbnb data is crucial. Leveraging the low regulation environment is key to maximizing your short term rental income potential. Let's dive into the specifics.
Key Sidi Rahal Chatai Airbnb Performance Metrics Overview
Monthly Airbnb Revenue Variations & Income Potential in Sidi Rahal Chatai (2026)
Understanding the monthly revenue variations for Airbnb listings in Sidi Rahal Chatai is key to maximizing your short term rental income potential. Seasonality significantly impacts earnings. Our analysis, based on data from the past 12 months, shows that the peak revenue month for STRs in Sidi Rahal Chatai is typically August, while January often presents the lowest earnings, highlighting opportunities for strategic pricing adjustments during shoulder and low seasons. Explore the typical Airbnb income in Sidi Rahal Chatai across different performance tiers:
- Best-in-class properties (Top 10%) achieve $1,342+ monthly, often utilizing dynamic pricing and superior guest experiences.
- Strong performing properties (Top 25%) earn $899 or more, indicating effective management and desirable locations/amenities.
- Typical properties (Median) generate around $467 per month, representing the average market performance.
- Entry-level properties (Bottom 25%) see earnings around $217, often with potential for optimization.
Average Monthly Airbnb Earnings Trend in Sidi Rahal Chatai
Sidi Rahal Chatai Airbnb Occupancy Rate Trends (2026)
Maximize your bookings by understanding the Sidi Rahal Chatai STR occupancy trends. Seasonal demand shifts significantly influence how often properties are booked. Typically, Augustsees the highest demand (peak season occupancy), while January experiences the lowest (low season). Effective strategies, like adjusting minimum stays or offering promotions, can boost occupancy during slower periods. Here's how different property tiers perform in Sidi Rahal Chatai:
- Best-in-class properties (Top 10%) achieve 46%+ occupancy, indicating high desirability and potentially optimized availability.
- Strong performing properties (Top 25%) maintain 33% or higher occupancy, suggesting good market fit and guest satisfaction.
- Typical properties (Median) have an occupancy rate around 20%.
- Entry-level properties (Bottom 25%) average 10% occupancy, potentially facing higher vacancy.
Average Monthly Occupancy Rate Trend in Sidi Rahal Chatai
Average Daily Rate (ADR) Airbnb Trends in Sidi Rahal Chatai (2026)
Effective short term rental pricing strategy in Sidi Rahal Chatai involves understanding monthly ADR fluctuations. The Average Daily Rate (ADR) for Airbnb in Sidi Rahal Chatai typically peaks in August and dips lowest during March. Leveraging Airbnb dynamic pricing tools or strategies based on this seasonality can significantly boost revenue. Here's a look at the typical nightly rates achieved:
- Best-in-class properties (Top 10%) command rates of $148+ per night, often due to premium features or locations.
- Strong performing properties (Top 25%) achieve nightly rates of $111 or more.
- Typical properties (Median) charge around $89 per night.
- Entry-level properties (Bottom 25%) earn around $67 per night.
Average Daily Rate (ADR) Trend by Month in Sidi Rahal Chatai
Get Live Sidi Rahal Chatai Market Intelligence 👇

Explore Real-time Analytics
Airbnb Seasonality Analysis & Trends in Sidi Rahal Chatai (2026)
Peak Season (August, July, September)
- Revenue averages $1,221 per month
- Occupancy rates average 37.1%
- Daily rates average $103
Shoulder Season
- Revenue averages $488 per month
- Occupancy maintains around 20.5%
- Daily rates hold near $92
Low Season (January, October, November)
- Revenue drops to average $371 per month
- Occupancy decreases to average 16.0%
- Daily rates adjust to average $95
Seasonality Insights for Sidi Rahal Chatai
- The Airbnb seasonality in Sidi Rahal Chatai shows highly seasonal trends requiring careful strategy. While the sections above show seasonal averages, it's also insightful to look at the extremes:
- During the high season, the absolute peak month showcases Sidi Rahal Chatai's highest earning potential, with monthly revenues capable of climbing to $1,653, occupancy reaching a high of 47.1%, and ADRs peaking at $106.
- Conversely, the slowest single month of the year, typically falling within the low season, marks the market's lowest point. In this month, revenue might dip to $285, occupancy could drop to 14.2%, and ADRs may adjust down to $88.
- Understanding both the seasonal averages and these monthly peaks and troughs in revenue, occupancy, and ADR is crucial for maximizing your Airbnb profit potential in Sidi Rahal Chatai.
Seasonal Strategies for Maximizing Profit
- Peak Season: Maximize revenue through premium pricing and potentially longer minimum stays. Ensure high availability.
- Low Season: Offer competitive pricing, special promotions (e.g., extended stay discounts), and flexible cancellation policies. Target off-season travelers like remote workers or budget-conscious guests.
- Shoulder Seasons: Implement dynamic pricing that balances peak and low rates. Target weekend travelers or specific events. Offer slightly more flexible terms than peak season.
- Regularly analyze your own performance against these Sidi Rahal Chatai seasonality benchmarks and adjust your pricing and availability strategy accordingly.
Best Areas for Airbnb Investment in Sidi Rahal Chatai (2026)
Exploring the top neighborhoods for short-term rentals in Sidi Rahal Chatai? This section highlights key areas, outlining why they are attractive for hosts and guests, along with notable local attractions. Consider these locations based on your target guest profile and investment strategy.
| Neighborhood / Area | Why Host Here? (Target Guests & Appeal) | Key Attractions & Landmarks |
|---|---|---|
| Plage Sidi Rahal | A popular beach destination for both locals and tourists, known for its sandy shores and water activities. Ideal for attracting summer visitors looking for relaxation and beach fun. | Beautiful sandy beaches, Water sports, Local seafood restaurants, Beach clubs, Sunset views |
| Sidi Rahal Town Center | The central area of Sidi Rahal, featuring local shops and cafes. A good spot for visitors wanting to experience local culture and everyday Moroccan life. | Local markets, Cafes and restaurants, Cultural experiences, Proximity to the beach, Community events |
| Golf Sidi Rahal | Home to several golf courses, attracting golf enthusiasts. A tranquil area with greenery and serene surroundings, suitable for vacationers looking for a peaceful retreat. | Golf courses, Scenic views, Clubhouses, Relaxing atmosphere, Spa facilities |
| Cascades d'Ouzoud | A bit further afield, but a popular day trip destination. Known for its stunning waterfalls and natural beauty, perfect for nature lovers and adventure seekers. | Ouzoud Waterfalls, Hiking trails, Local wildlife, Photography opportunities, Picnic spots |
| Bord de Mer | A coastal area stretching along the shore, ideal for beachfront properties. Great for visitors looking for a coastal lifestyle with outdoor activities. | Sea views, Fishing spots, Horse riding, Walking trails along the coast, Beach sports |
| Sidi Rahal Majorelle | A new residential area that is becoming a favorite for tourists seeking modern facilities and accommodations. Close to attractions and amenities. | Modern apartments, Shops and restaurants, Easy access to coastal areas, Family-friendly environment, Community parks |
| Sidi Rahal Nature Reserve | Known for its natural beauty and wildlife, this area draws eco-tourists and nature enthusiasts, ideal for those looking for a getaway in nature. | Nature trails, Wildlife watching, Scenic viewpoints, Photography, Picnic areas |
| Sidi Rahal Cultural Center | A hub for arts and culture, ideal for tourists interested in local events, workshops, and traditions. A great place to immerse oneself in Moroccan culture. | Cultural workshops, Local art exhibitions, Traditional performances, Community events, Culinary experiences |
Understanding Airbnb License Requirements & STR Laws in Sidi Rahal Chatai (2026)
While Sidi Rahal Chatai, Casablanca-Settat, Morocco currently shows low STR regulations, specific Airbnb license requirements might still exist or change. Always verify the latest short term rental regulations and Airbnb license requirements directly with local government authorities for Sidi Rahal Chatai to ensure full compliance before hosting.
(Source: AirROI data, 2026, based on 1% licensed listings)
Top Performing Airbnb Properties in Sidi Rahal Chatai (2026)
Benchmark your potential! Explore examples of top-performing Airbnb properties in Sidi Rahal Chataibased on Trailing Twelve Month (TTM) revenue. Analyze their characteristics, revenue, occupancy rate, and ADR to understand what drives success in this market.

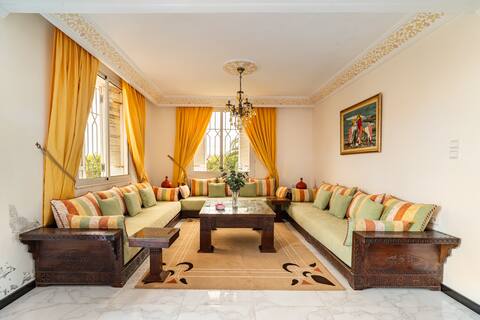
Villa Mazagan with private pool – Sidi Rahal beach
Entire Place • 4 bedrooms

Beautiful villa with pool, not overlooked.
Entire Place • 4 bedrooms
Entire villa with private pool next to the beach
Entire Place • 3 bedrooms
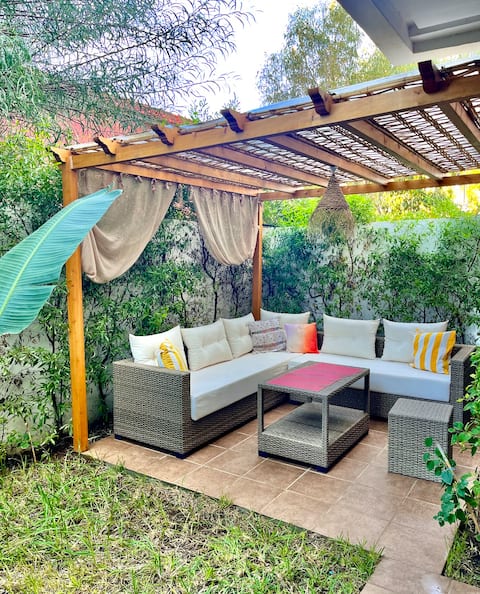
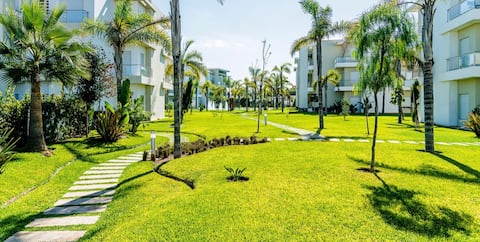
Beautiful apartment with private garden, beach access, pool
Entire Place • 2 bedrooms
Superb apartment with pool and feet on the ground.
Entire Place • 2 bedrooms
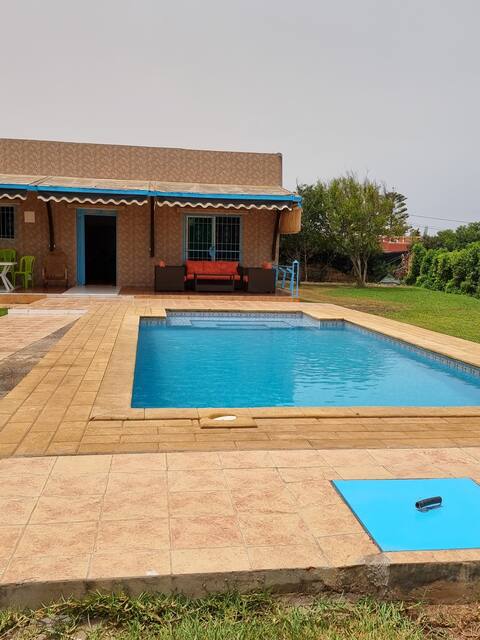
Cozy villa with pool
Entire Place • 3 bedrooms
Note: Performance varies based on location, size, amenities, seasonality, and management quality. Data reflects the past 12 months.
Top Performing Airbnb Hosts in Sidi Rahal Chatai (2026)
Learn from the best! This table showcases top-performing Airbnb hosts in Sidi Rahal Chatai based on the number of properties managed and estimated total revenue over the past year. Analyze their scale and performance metrics.
| Host Name | Properties | Grossing Revenue | Stay Reviews | Avg Rating |
|---|---|---|---|---|
| Nezha Isabelle | 1 | $30,562 | 80 | 4.78/5.0 |
| Mehdi | 1 | $17,682 | 18 | 4.67/5.0 |
| Talia | 1 | $16,693 | 49 | 4.78/5.0 |
| Imane | 2 | $15,453 | 15 | 4.25/5.0 |
| Benjelloun | 3 | $12,523 | 4 | Not Rated |
| Salma | 2 | $11,968 | 22 | 4.78/5.0 |
| Myriam | 1 | $11,492 | 22 | 4.82/5.0 |
| Oussama | 2 | $10,678 | 5 | 5.00/5.0 |
| Ahmed | 1 | $10,250 | 15 | 4.80/5.0 |
| Ahmed | 1 | $10,028 | 9 | 4.89/5.0 |
Analyzing the strategies of top hosts, such as their property selection, pricing, and guest communication, can offer valuable lessons for optimizing your own Airbnb operations in Sidi Rahal Chatai.
Dive Deeper: Advanced Sidi Rahal Chatai STR Market Data (2026)
Ready to unlock more insights? AirROI provides access to advanced metrics and comprehensive Airbnb data for Sidi Rahal Chatai. Explore detailed analytics beyond this report to refine your investment strategy, optimize pricing, and maximize your vacation rental profits.
Explore Advanced MetricsSidi Rahal Chatai Short-Term Rental Market Composition (2026): Property & Room Types
Room Type Distribution
Property Type Distribution
Market Composition Insights for Sidi Rahal Chatai
- The Sidi Rahal Chatai Airbnb market composition is heavily skewed towards Entire Home/Apt listings, which make up 100% of the 177 active rentals. This indicates strong guest preference for privacy and space.
- Looking at the property type distribution in Sidi Rahal Chatai, Apartment/Condo properties are the most common (79.1%), reflecting the local real estate landscape.
- Houses represent a significant 20.9% portion, catering likely to families or larger groups.
Sidi Rahal Chatai Airbnb Room Capacity Analysis (2026): Bedroom Distribution
Distribution of Listings by Number of Bedrooms
Room Capacity Insights for Sidi Rahal Chatai
- The dominant room capacity in Sidi Rahal Chatai is 2 bedrooms listings, making up 67.2% of the market. This suggests a strong demand for properties suitable for couples or solo travelers.
- Together, 2 bedrooms and 3 bedrooms properties represent 83.0% of the active Airbnb listings in Sidi Rahal Chatai, indicating a high concentration in these sizes.
- A significant 23.1% of listings offer 3+ bedrooms, catering to larger groups and families seeking more space in Sidi Rahal Chatai.
Sidi Rahal Chatai Vacation Rental Guest Capacity Trends (2026)
Distribution of Listings by Guest Capacity
Guest Capacity Insights for Sidi Rahal Chatai
- The most common guest capacity trend in Sidi Rahal Chatai vacation rentals is listings accommodating 6 guests (42.9%). This suggests the primary traveler segment is likely larger groups.
- Properties designed for 6 guests and 8+ guests dominate the Sidi Rahal Chatai STR market, accounting for 63.8% of listings.
- 70.0% of properties accommodate 6+ guests, serving the market segment for larger families or group travel in Sidi Rahal Chatai.
- On average, properties in Sidi Rahal Chatai are equipped to host 6.1 guests.
Sidi Rahal Chatai Airbnb Booking Patterns (2026): Available vs. Booked Days
Available Days Distribution
Booked Days Distribution
Booking Pattern Insights for Sidi Rahal Chatai
- The most common availability pattern in Sidi Rahal Chatai falls within the 271-366 days range, representing 92.7% of listings. This suggests many properties have significant open periods on their calendars.
- Approximately 100.0% of listings show high availability (181+ days open annually), indicating potential for increased bookings or specific owner usage patterns.
- For booked days, the 1-30 days range is most frequent in Sidi Rahal Chatai (47.5%), reflecting common guest stay durations or potential owner blocking patterns.
Sidi Rahal Chatai Airbnb Minimum Stay Requirements Analysis
Distribution of Listings by Minimum Night Requirement
1 Night
33 listings
18.6% of total
2 Nights
42 listings
23.7% of total
3 Nights
32 listings
18.1% of total
4-6 Nights
25 listings
14.1% of total
7-29 Nights
2 listings
1.1% of total
30+ Nights
43 listings
24.3% of total
Key Insights
- The most prevalent minimum stay requirement in Sidi Rahal Chatai is 30+ Nights, adopted by 24.3% of listings. This highlights the market's preference for longer commitments.
- A significant segment (24.3%) caters to monthly stays (30+ nights) in Sidi Rahal Chatai, pointing to opportunities in the extended-stay market.
Recommendations
- Align with the market by considering a 30+ Nights minimum stay, as 24.3% of Sidi Rahal Chatai hosts use this setting.
- If feasible, allowing 1-night stays, especially midweek or during low season, could capture last-minute bookings, as only 18.6% currently do.
- Explore offering discounts for stays of 30+ nights to attract the 24.3% of the market seeking extended stays.
- Adjust minimum nights based on seasonality – potentially shorter during low season and longer during peak demand periods in Sidi Rahal Chatai.
Sidi Rahal Chatai Airbnb Cancellation Policy Trends Analysis (2026)
Limited
13 listings
7.3% of total
Flexible
71 listings
40.1% of total
Moderate
40 listings
22.6% of total
Firm
50 listings
28.2% of total
Strict
3 listings
1.7% of total
Cancellation Policy Insights for Sidi Rahal Chatai
- The prevailing Airbnb cancellation policy trend in Sidi Rahal Chatai is Flexible, used by 40.1% of listings.
- There's a relatively balanced mix between guest-friendly (62.7%) and stricter (29.9%) policies, offering choices for different guest needs.
- Strict cancellation policies are quite rare (1.7%), potentially making listings with this policy less competitive unless justified by high demand or property type.
Recommendations for Hosts
- Consider adopting a Flexible policy to align with the 40.1% market standard in Sidi Rahal Chatai.
- Using a Strict policy might deter some guests, as only 1.7% of listings use it. Evaluate if potential revenue protection outweighs possible lower booking rates.
- Regularly review your cancellation policy against competitors and market demand shifts in Sidi Rahal Chatai.
Sidi Rahal Chatai STR Booking Lead Time Analysis (2026)
Average Booking Lead Time by Month
Booking Lead Time Insights for Sidi Rahal Chatai
- The overall average booking lead time for vacation rentals in Sidi Rahal Chatai is 25 days.
- Guests book furthest in advance for stays during August (average 40 days), likely coinciding with peak travel demand or local events.
- The shortest booking windows occur for stays in December (average 8 days), indicating more last-minute travel plans during this time.
- Seasonally, Summer (30 days avg.) sees the longest lead times, while Winter (9 days avg.) has the shortest, reflecting typical travel planning cycles.
Recommendations for Hosts
- Use the overall average lead time (25 days) as a baseline for your pricing and availability strategy in Sidi Rahal Chatai.
- For August stays, consider implementing length-of-stay discounts or slightly higher rates for bookings made less than 40 days out to capitalize on advance planning.
- During December, focus on last-minute booking availability and promotions, as guests book with very short notice (8 days avg.).
- Target marketing efforts for the Summer season well in advance (at least 30 days) to capture early planners.
- Monitor your own booking lead times against these Sidi Rahal Chatai averages to identify opportunities for dynamic pricing adjustments.
Popular & Essential Airbnb Amenities in Sidi Rahal Chatai (2026)
Amenity Prevalence
Amenity Insights for Sidi Rahal Chatai
- Essential amenities in Sidi Rahal Chatai that guests expect include: TV, Kitchen, Free parking on premises. Lacking these (any) could significantly impact bookings.
- Popular amenities like Pool, Washer, Beach access are common but not universal. Offering these can provide a competitive edge.
- A pool is a highly desired but not standard amenity, making it a key feature for attracting guests seeking leisure in Sidi Rahal Chatai.
- Warning: Wifi is not universally provided but is considered essential globally. Ensure reliable Wifi is offered.
Recommendations for Hosts
- Ensure your listing includes all essential amenities for Sidi Rahal Chatai: TV, Kitchen, Free parking on premises.
- Prioritize adding missing essentials: TV, Kitchen, Free parking on premises.
- Consider adding popular differentiators like Pool or Washer to increase appeal.
- Highlight unique or less common amenities you offer (e.g., hot tub, dedicated workspace, EV charger) in your listing description and photos.
- Regularly check competitor amenities in Sidi Rahal Chatai to stay competitive.
Sidi Rahal Chatai Airbnb Guest Demographics & Profile Analysis (2026)
Guest Profile Summary for Sidi Rahal Chatai
- The typical guest profile for Airbnb in Sidi Rahal Chatai consists of predominantly international visitors (74%), with top international origins including Morocco, typically belonging to the Post-2000s (Gen Z/Alpha) group (50%), primarily speaking French or English.
- Domestic travelers account for 26.3% of guests.
- Key international markets include France (39.1%) and Morocco (26.3%).
- Top languages spoken are French (32.9%) followed by English (30.9%).
- A significant demographic segment is the Post-2000s (Gen Z/Alpha) group, representing 50% of guests.
Recommendations for Hosts
- Focus marketing internationally, particularly towards travelers from Morocco.
- Offer listing details and communication support in French.
- Tailor amenities and listing descriptions to appeal to the dominant Post-2000s (Gen Z/Alpha) demographic (e.g., highlight fast WiFi, smart home features, local guides).
- Highlight unique local experiences or amenities relevant to the primary guest profile.
- Consider seasonal promotions aligned with peak travel times for key origin markets.
Nearby Short-Term Rental Market Comparison
How does the Sidi Rahal Chatai Airbnb market stack up against its neighbors? Compare key performance metrics like average monthly revenue, ADR, and occupancy rates in surrounding areas to understand the broader regional STR landscape.
| Market | Active Properties | Monthly Revenue | Daily Rate | Avg. Occupancy |
|---|---|---|---|---|
| Shoul السهول | 10 | $1,584 | $159.25 | 41% |
| Bouskoura | 46 | $1,132 | $130.77 | 41% |
| Haouzia | 22 | $1,011 | $248.67 | 28% |
| Oulad Azzouz ⵡⵍⴰⴷ ⵄⵣⵣⵓⵣ أولاد عزوز | 13 | $812 | $161.42 | 31% |
| Harhoura | 132 | $789 | $114.80 | 34% |
| Ameur عامر | 62 | $785 | $129.87 | 34% |
| Sidi Taibi | 19 | $741 | $155.32 | 29% |
| Rabat | 1,432 | $740 | $88.00 | 38% |
| Cherrat ⵛⵔⴰⵟ الشراط | 121 | $730 | $128.02 | 33% |
| arrondissement de Sidi Belyout مقاطعة سيدي بليوط | 418 | $643 | $84.96 | 35% |