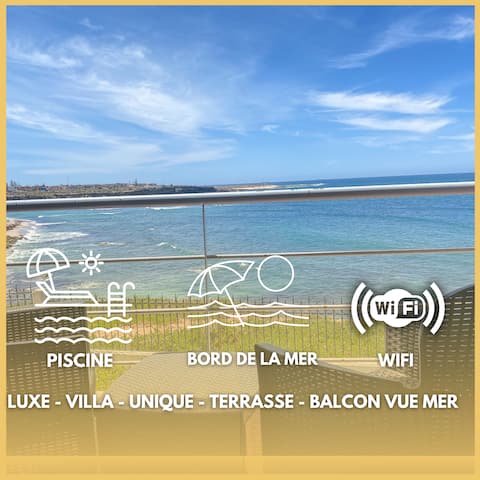
Moulay Abdallah Airbnb Market Analysis 2026: Short Term Rental Data & Vacation Rental Statistics in Casablanca-Settat, Morocco
Is Airbnb profitable in Moulay Abdallah in 2026? Explore comprehensive Airbnb analytics for Moulay Abdallah, Casablanca-Settat, Morocco to uncover income potential. This 2026 STR market report for Moulay Abdallah, based on AirROI data from February 2025 to January 2026, reveals key trends in the niche market of 59 active listings.
Whether you're considering an Airbnb investment in Moulay Abdallah, optimizing your existing vacation rental, or exploring rental arbitrage opportunities, understanding the Moulay Abdallah Airbnb data is crucial. Leveraging the low regulation environment is key to maximizing your short term rental income potential. Let's dive into the specifics.
Key Moulay Abdallah Airbnb Performance Metrics Overview
Monthly Airbnb Revenue Variations & Income Potential in Moulay Abdallah (2026)
Understanding the monthly revenue variations for Airbnb listings in Moulay Abdallah is key to maximizing your short term rental income potential. Seasonality significantly impacts earnings. Our analysis, based on data from the past 12 months, shows that the peak revenue month for STRs in Moulay Abdallah is typically August, while December often presents the lowest earnings, highlighting opportunities for strategic pricing adjustments during shoulder and low seasons. Explore the typical Airbnb income in Moulay Abdallah across different performance tiers:
- Best-in-class properties (Top 10%) achieve $1,930+ monthly, often utilizing dynamic pricing and superior guest experiences.
- Strong performing properties (Top 25%) earn $1,032 or more, indicating effective management and desirable locations/amenities.
- Typical properties (Median) generate around $485 per month, representing the average market performance.
- Entry-level properties (Bottom 25%) see earnings around $185, often with potential for optimization.
Average Monthly Airbnb Earnings Trend in Moulay Abdallah
Moulay Abdallah Airbnb Occupancy Rate Trends (2026)
Maximize your bookings by understanding the Moulay Abdallah STR occupancy trends. Seasonal demand shifts significantly influence how often properties are booked. Typically, Augustsees the highest demand (peak season occupancy), while December experiences the lowest (low season). Effective strategies, like adjusting minimum stays or offering promotions, can boost occupancy during slower periods. Here's how different property tiers perform in Moulay Abdallah:
- Best-in-class properties (Top 10%) achieve 61%+ occupancy, indicating high desirability and potentially optimized availability.
- Strong performing properties (Top 25%) maintain 42% or higher occupancy, suggesting good market fit and guest satisfaction.
- Typical properties (Median) have an occupancy rate around 24%.
- Entry-level properties (Bottom 25%) average 11% occupancy, potentially facing higher vacancy.
Average Monthly Occupancy Rate Trend in Moulay Abdallah
Average Daily Rate (ADR) Airbnb Trends in Moulay Abdallah (2026)
Effective short term rental pricing strategy in Moulay Abdallah involves understanding monthly ADR fluctuations. The Average Daily Rate (ADR) for Airbnb in Moulay Abdallah typically peaks in August and dips lowest during April. Leveraging Airbnb dynamic pricing tools or strategies based on this seasonality can significantly boost revenue. Here's a look at the typical nightly rates achieved:
- Best-in-class properties (Top 10%) command rates of $127+ per night, often due to premium features or locations.
- Strong performing properties (Top 25%) achieve nightly rates of $98 or more.
- Typical properties (Median) charge around $76 per night.
- Entry-level properties (Bottom 25%) earn around $57 per night.
Average Daily Rate (ADR) Trend by Month in Moulay Abdallah
Get Live Moulay Abdallah Market Intelligence 👇

Explore Real-time Analytics
Airbnb Seasonality Analysis & Trends in Moulay Abdallah (2026)
Peak Season (August, July, September)
- Revenue averages $1,351 per month
- Occupancy rates average 40.9%
- Daily rates average $91
Shoulder Season
- Revenue averages $758 per month
- Occupancy maintains around 27.1%
- Daily rates hold near $79
Low Season (February, April, December)
- Revenue drops to average $483 per month
- Occupancy decreases to average 22.2%
- Daily rates adjust to average $76
Seasonality Insights for Moulay Abdallah
- The Airbnb seasonality in Moulay Abdallah shows highly seasonal trends requiring careful strategy. While the sections above show seasonal averages, it's also insightful to look at the extremes:
- During the high season, the absolute peak month showcases Moulay Abdallah's highest earning potential, with monthly revenues capable of climbing to $1,661, occupancy reaching a high of 50.0%, and ADRs peaking at $96.
- Conversely, the slowest single month of the year, typically falling within the low season, marks the market's lowest point. In this month, revenue might dip to $431, occupancy could drop to 17.1%, and ADRs may adjust down to $73.
- Understanding both the seasonal averages and these monthly peaks and troughs in revenue, occupancy, and ADR is crucial for maximizing your Airbnb profit potential in Moulay Abdallah.
Seasonal Strategies for Maximizing Profit
- Peak Season: Maximize revenue through premium pricing and potentially longer minimum stays. Ensure high availability.
- Low Season: Offer competitive pricing, special promotions (e.g., extended stay discounts), and flexible cancellation policies. Target off-season travelers like remote workers or budget-conscious guests.
- Shoulder Seasons: Implement dynamic pricing that balances peak and low rates. Target weekend travelers or specific events. Offer slightly more flexible terms than peak season.
- Regularly analyze your own performance against these Moulay Abdallah seasonality benchmarks and adjust your pricing and availability strategy accordingly.
Best Areas for Airbnb Investment in Moulay Abdallah (2026)
Exploring the top neighborhoods for short-term rentals in Moulay Abdallah? This section highlights key areas, outlining why they are attractive for hosts and guests, along with notable local attractions. Consider these locations based on your target guest profile and investment strategy.
| Neighborhood / Area | Why Host Here? (Target Guests & Appeal) | Key Attractions & Landmarks |
|---|---|---|
| Moulay Abdallah Beach | A serene seaside destination known for its beautiful beaches and tranquil atmosphere, perfect for families and beach lovers. | Moulay Abdallah Beach, Laguna de Moulay Abdalllah, local seafood restaurants, fishing activities, water sports |
| Ksar el Kebir | A historical site with a unique blend of culture and history, attracting tourists interested in Moroccan heritage and traditions. | Ksar el Kebir ruins, local markets, historical museums, traditional Moroccan architecture |
| Oum Er-Rbia | A picturesque area known for its scenic landscapes and outdoor activities, ideal for nature lovers and adventure seekers. | Oum Er-Rbia River, hiking trails, camping sites, nature reserves |
| Azemmour | A charming town with rich history, famous for its medina and proximity to the coast, making it an appealing destination for tourists. | Azemmour medina, historic sites, river views, cultural festivals |
| El Jadida | Famous for its Portuguese city and beaches, this area attracts both history buffs and beachgoers, providing a unique blend of culture and leisure. | Cité Portugaise, beach resorts, historical architecture, Portuguese fortress, local cafes |
| Bir Jdid | A local town known for its traditional ambiance and proximity to various attractions, appealing for those seeking an authentic Moroccan experience. | local souks, traditional cafes, cultural festivals, community events |
| Sidi Bouzid | A popular beach destination known for its sandy shores and vibrant beach life, attracting tourists seeking relaxation and water sports. | Sidi Bouzid Beach, water sports, beachside cafes, nightlife opportunities |
| Dar Bouazza | A coastal community offering a mix of residential comfort and resort amenities, appealing to both short-term and long-term rentals. | Dar Bouazza beaches, resorts and hotels, local restaurants, water activities |
Understanding Airbnb License Requirements & STR Laws in Moulay Abdallah (2026)
While Moulay Abdallah, Casablanca-Settat, Morocco currently shows low STR regulations, specific Airbnb license requirements might still exist or change. Always verify the latest short term rental regulations and Airbnb license requirements directly with local government authorities for Moulay Abdallah to ensure full compliance before hosting.
(Source: AirROI data, 2026, finding no licensed listings among those analyzed)
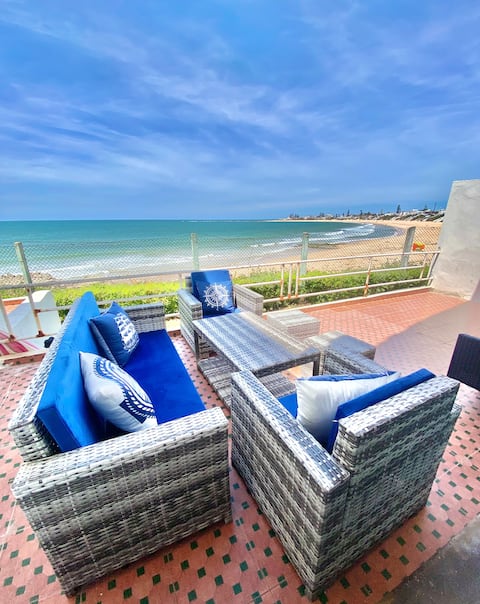
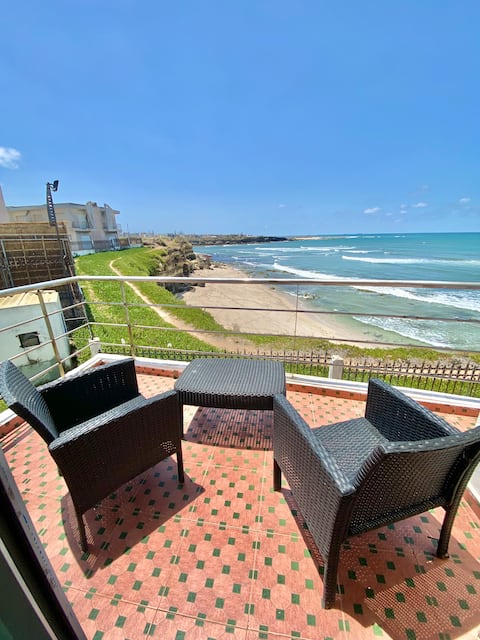
Top Performing Airbnb Properties in Moulay Abdallah (2026)
Benchmark your potential! Explore examples of top-performing Airbnb properties in Moulay Abdallahbased on Trailing Twelve Month (TTM) revenue. Analyze their characteristics, revenue, occupancy rate, and ADR to understand what drives success in this market.
Luxury beachside villa with pool
Entire Place • 4 bedrooms
2-Story Villa | Direct access to the beach | 5 bds
Entire Place • 5 bedrooms

Villa Premium Blue Horizon - Beachfront - 5 bdrs
Entire Place • 5 bedrooms
Villa OceanView 5 bedrooms - Sunset & Peace
Entire Place • 5 bedrooms
Apartment + pools 4 min beach - netflix iptv
Entire Place • 1 bedroom

OCEAN VIEW
Entire Place • 5 bedrooms
Note: Performance varies based on location, size, amenities, seasonality, and management quality. Data reflects the past 12 months.
Top Performing Airbnb Hosts in Moulay Abdallah (2026)
Learn from the best! This table showcases top-performing Airbnb hosts in Moulay Abdallah based on the number of properties managed and estimated total revenue over the past year. Analyze their scale and performance metrics.
| Host Name | Properties | Grossing Revenue | Stay Reviews | Avg Rating |
|---|---|---|---|---|
| Aida | 3 | $65,556 | 234 | 4.52/5.0 |
| Zakaria | 1 | $35,384 | 84 | 4.75/5.0 |
| Khaled | 3 | $18,658 | 103 | 4.90/5.0 |
| Mohammed-Rida | 1 | $10,920 | 107 | 4.80/5.0 |
| Zhor | 1 | $8,878 | 74 | 4.57/5.0 |
| Mohamed | 1 | $8,127 | 42 | 5.00/5.0 |
| Loubna | 1 | $7,398 | 18 | 4.83/5.0 |
| Mohammed Najib | 1 | $6,963 | 16 | 4.56/5.0 |
| Sam | 1 | $5,366 | 7 | 4.86/5.0 |
| Planet Facility | 1 | $5,308 | 7 | 4.86/5.0 |
Analyzing the strategies of top hosts, such as their property selection, pricing, and guest communication, can offer valuable lessons for optimizing your own Airbnb operations in Moulay Abdallah.
Dive Deeper: Advanced Moulay Abdallah STR Market Data (2026)
Ready to unlock more insights? AirROI provides access to advanced metrics and comprehensive Airbnb data for Moulay Abdallah. Explore detailed analytics beyond this report to refine your investment strategy, optimize pricing, and maximize your vacation rental profits.
Explore Advanced MetricsMoulay Abdallah Short-Term Rental Market Composition (2026): Property & Room Types
Room Type Distribution
Property Type Distribution
Market Composition Insights for Moulay Abdallah
- The Moulay Abdallah Airbnb market composition is heavily skewed towards Entire Home/Apt listings, which make up 100% of the 59 active rentals. This indicates strong guest preference for privacy and space.
- Looking at the property type distribution in Moulay Abdallah, House properties are the most common (54.2%), reflecting the local real estate landscape.
- Houses represent a significant 54.2% portion, catering likely to families or larger groups.
- Smaller segments like hotel/boutique (combined 1.7%) offer potential for unique stay experiences.
Moulay Abdallah Airbnb Room Capacity Analysis (2026): Bedroom Distribution
Distribution of Listings by Number of Bedrooms
Room Capacity Insights for Moulay Abdallah
- The dominant room capacity in Moulay Abdallah is 2 bedrooms listings, making up 49.2% of the market. This suggests a strong demand for properties suitable for couples or solo travelers.
- Together, 2 bedrooms and 3 bedrooms properties represent 71.2% of the active Airbnb listings in Moulay Abdallah, indicating a high concentration in these sizes.
- A significant 37.3% of listings offer 3+ bedrooms, catering to larger groups and families seeking more space in Moulay Abdallah.
Moulay Abdallah Vacation Rental Guest Capacity Trends (2026)
Distribution of Listings by Guest Capacity
Guest Capacity Insights for Moulay Abdallah
- The most common guest capacity trend in Moulay Abdallah vacation rentals is listings accommodating 8+ guests (32.2%). This suggests the primary traveler segment is likely larger groups.
- Properties designed for 8+ guests and 6 guests dominate the Moulay Abdallah STR market, accounting for 57.6% of listings.
- 64.4% of properties accommodate 6+ guests, serving the market segment for larger families or group travel in Moulay Abdallah.
- On average, properties in Moulay Abdallah are equipped to host 6.0 guests.
Moulay Abdallah Airbnb Booking Patterns (2026): Available vs. Booked Days
Available Days Distribution
Booked Days Distribution
Booking Pattern Insights for Moulay Abdallah
- The most common availability pattern in Moulay Abdallah falls within the 271-366 days range, representing 88.1% of listings. This suggests many properties have significant open periods on their calendars.
- Approximately 96.6% of listings show high availability (181+ days open annually), indicating potential for increased bookings or specific owner usage patterns.
- For booked days, the 1-30 days range is most frequent in Moulay Abdallah (47.5%), reflecting common guest stay durations or potential owner blocking patterns.
- A notable 3.4% of properties secure long booking periods (181+ days booked per year), highlighting successful long-term rental strategies or significant owner usage.
Moulay Abdallah Airbnb Minimum Stay Requirements Analysis
Distribution of Listings by Minimum Night Requirement
1 Night
18 listings
30.5% of total
2 Nights
15 listings
25.4% of total
3 Nights
5 listings
8.5% of total
4-6 Nights
1 listings
1.7% of total
7-29 Nights
2 listings
3.4% of total
30+ Nights
18 listings
30.5% of total
Key Insights
- The most prevalent minimum stay requirement in Moulay Abdallah is 1 Night, adopted by 30.5% of listings. This highlights the market's preference for shorter, flexible bookings.
- A significant segment (30.5%) caters to monthly stays (30+ nights) in Moulay Abdallah, pointing to opportunities in the extended-stay market.
Recommendations
- Align with the market by considering a 1 Night minimum stay, as 30.5% of Moulay Abdallah hosts use this setting.
- Explore offering discounts for stays of 30+ nights to attract the 30.5% of the market seeking extended stays.
- Adjust minimum nights based on seasonality – potentially shorter during low season and longer during peak demand periods in Moulay Abdallah.
Moulay Abdallah Airbnb Cancellation Policy Trends Analysis (2026)
Limited
1 listings
1.7% of total
Flexible
29 listings
50% of total
Moderate
15 listings
25.9% of total
Firm
11 listings
19% of total
Strict
2 listings
3.4% of total
Cancellation Policy Insights for Moulay Abdallah
- The prevailing Airbnb cancellation policy trend in Moulay Abdallah is Flexible, used by 50% of listings.
- The market strongly favors guest-friendly terms, with 75.9% of listings offering Flexible or Moderate policies. This suggests guests in Moulay Abdallah may expect booking flexibility.
- Strict cancellation policies are quite rare (3.4%), potentially making listings with this policy less competitive unless justified by high demand or property type.
Recommendations for Hosts
- Consider adopting a Flexible policy to align with the 50% market standard in Moulay Abdallah.
- Using a Strict policy might deter some guests, as only 3.4% of listings use it. Evaluate if potential revenue protection outweighs possible lower booking rates.
- Regularly review your cancellation policy against competitors and market demand shifts in Moulay Abdallah.
Moulay Abdallah STR Booking Lead Time Analysis (2026)
Average Booking Lead Time by Month
Booking Lead Time Insights for Moulay Abdallah
- The overall average booking lead time for vacation rentals in Moulay Abdallah is 28 days.
- Guests book furthest in advance for stays during January (average 61 days), likely coinciding with peak travel demand or local events.
- The shortest booking windows occur for stays in December (average 6 days), indicating more last-minute travel plans during this time.
- Seasonally, Spring (31 days avg.) sees the longest lead times, while Winter (26 days avg.) has the shortest, reflecting typical travel planning cycles.
Recommendations for Hosts
- Use the overall average lead time (28 days) as a baseline for your pricing and availability strategy in Moulay Abdallah.
- For January stays, consider implementing length-of-stay discounts or slightly higher rates for bookings made less than 61 days out to capitalize on advance planning.
- During December, focus on last-minute booking availability and promotions, as guests book with very short notice (6 days avg.).
- Target marketing efforts for the Spring season well in advance (at least 31 days) to capture early planners.
- Monitor your own booking lead times against these Moulay Abdallah averages to identify opportunities for dynamic pricing adjustments.
Popular & Essential Airbnb Amenities in Moulay Abdallah (2026)
Amenity Prevalence
Amenity Insights for Moulay Abdallah
- Essential amenities in Moulay Abdallah that guests expect include: TV, Kitchen. Lacking these (any) could significantly impact bookings.
- Popular amenities like Free parking on premises, Washer, Refrigerator are common but not universal. Offering these can provide a competitive edge.
- Warning: Wifi is not universally provided but is considered essential globally. Ensure reliable Wifi is offered.
Recommendations for Hosts
- Ensure your listing includes all essential amenities for Moulay Abdallah: TV, Kitchen.
- Prioritize adding missing essentials: TV, Kitchen.
- Consider adding popular differentiators like Free parking on premises or Washer to increase appeal.
- Highlight unique or less common amenities you offer (e.g., hot tub, dedicated workspace, EV charger) in your listing description and photos.
- Regularly check competitor amenities in Moulay Abdallah to stay competitive.
Moulay Abdallah Airbnb Guest Demographics & Profile Analysis (2026)
Guest Profile Summary for Moulay Abdallah
- The typical guest profile for Airbnb in Moulay Abdallah consists of predominantly international visitors (78%), with top international origins including Morocco, typically belonging to the Post-2000s (Gen Z/Alpha) group (50%), primarily speaking French or English.
- Domestic travelers account for 22.0% of guests.
- Key international markets include France (44.9%) and Morocco (22%).
- Top languages spoken are French (32.2%) followed by English (29.2%).
- A significant demographic segment is the Post-2000s (Gen Z/Alpha) group, representing 50% of guests.
Recommendations for Hosts
- Focus marketing internationally, particularly towards travelers from Morocco.
- Offer listing details and communication support in French.
- Tailor amenities and listing descriptions to appeal to the dominant Post-2000s (Gen Z/Alpha) demographic (e.g., highlight fast WiFi, smart home features, local guides).
- Highlight unique local experiences or amenities relevant to the primary guest profile.
- Consider seasonal promotions aligned with peak travel times for key origin markets.
Nearby Short-Term Rental Market Comparison
How does the Moulay Abdallah Airbnb market stack up against its neighbors? Compare key performance metrics like average monthly revenue, ADR, and occupancy rates in surrounding areas to understand the broader regional STR landscape.
| Market | Active Properties | Monthly Revenue | Daily Rate | Avg. Occupancy |
|---|---|---|---|---|
| Bouskoura | 46 | $1,132 | $130.77 | 41% |
| Haouzia | 22 | $1,011 | $248.67 | 28% |
| Oulad Azzouz ⵡⵍⴰⴷ ⵄⵣⵣⵓⵣ أولاد عزوز | 13 | $812 | $161.42 | 31% |
| Cherrat ⵛⵔⴰⵟ الشراط | 121 | $730 | $128.02 | 33% |
| arrondissement de Sidi Belyout مقاطعة سيدي بليوط | 418 | $643 | $84.96 | 35% |
| Skhirat | 103 | $643 | $126.63 | 30% |
| Dar Bouazza | 183 | $620 | $135.26 | 30% |
| Ben Slimane | 13 | $607 | $134.54 | 27% |
| arrondissement d'Anfa مقاطعة أنفا | 342 | $599 | $87.10 | 33% |
| Ain Harrouda | 13 | $596 | $63.24 | 35% |