San Francisco Mazapa Airbnb Market Analysis 2025: Short Term Rental Data & Vacation Rental Statistics in Teotihuacán, Mexico
Is Airbnb profitable in San Francisco Mazapa in 2025? Explore comprehensive Airbnb analytics for San Francisco Mazapa, Teotihuacán, Mexico to uncover income potential. This 2025 STR market report for San Francisco Mazapa, based on AirROI data from April 2024 to March 2025, reveals key trends in the niche market of 19 active listings.
Whether you're considering an Airbnb investment in San Francisco Mazapa, optimizing your existing vacation rental, or exploring rental arbitrage opportunities, understanding the San Francisco Mazapa Airbnb data is crucial. Leveraging the low regulation environment is key to maximizing your short term rental income potential. Let's dive into the specifics.
Key San Francisco Mazapa Airbnb Performance Metrics Overview
Monthly Airbnb Revenue Variations & Income Potential in San Francisco Mazapa (2025)
Understanding the monthly revenue variations for Airbnb listings in San Francisco Mazapa is key to maximizing your short term rental income potential. Seasonality significantly impacts earnings. Our analysis, based on data from the past 12 months, shows that the peak revenue month for STRs in San Francisco Mazapa is typically December, while September often presents the lowest earnings, highlighting opportunities for strategic pricing adjustments during shoulder and low seasons. Explore the typical Airbnb income in San Francisco Mazapa across different performance tiers:
- Best-in-class properties (Top 10%) achieve $2,816+ monthly, often utilizing dynamic pricing and superior guest experiences.
- Strong performing properties (Top 25%) earn $1,983 or more, indicating effective management and desirable locations/amenities.
- Typical properties (Median) generate around $1,359 per month, representing the average market performance.
- Entry-level properties (Bottom 25%) see earnings around $724, often with potential for optimization.
Average Monthly Airbnb Earnings Trend in San Francisco Mazapa
San Francisco Mazapa Airbnb Occupancy Rate Trends (2025)
Maximize your bookings by understanding the San Francisco Mazapa STR occupancy trends. Seasonal demand shifts significantly influence how often properties are booked. Typically, Aprilsees the highest demand (peak season occupancy), while September experiences the lowest (low season). Effective strategies, like adjusting minimum stays or offering promotions, can boost occupancy during slower periods. Here's how different property tiers perform in San Francisco Mazapa:
- Best-in-class properties (Top 10%) achieve 75%+ occupancy, indicating high desirability and potentially optimized availability.
- Strong performing properties (Top 25%) maintain 65% or higher occupancy, suggesting good market fit and guest satisfaction.
- Typical properties (Median) have an occupancy rate around 50%.
- Entry-level properties (Bottom 25%) average 33% occupancy, potentially facing higher vacancy.
Average Monthly Occupancy Rate Trend in San Francisco Mazapa
Average Daily Rate (ADR) Airbnb Trends in San Francisco Mazapa (2025)
Effective short term rental pricing strategy in San Francisco Mazapa involves understanding monthly ADR fluctuations. The Average Daily Rate (ADR) for Airbnb in San Francisco Mazapa typically peaks in December and dips lowest during April. Leveraging Airbnb dynamic pricing tools or strategies based on this seasonality can significantly boost revenue. Here's a look at the typical nightly rates achieved:
- Best-in-class properties (Top 10%) command rates of $140+ per night, often due to premium features or locations.
- Strong performing properties (Top 25%) achieve nightly rates of $93 or more.
- Typical properties (Median) charge around $71 per night.
- Entry-level properties (Bottom 25%) earn around $39 per night.
Average Daily Rate (ADR) Trend by Month in San Francisco Mazapa
Get Live San Francisco Mazapa Market Intelligence 👇

Explore Real-time Analytics
Airbnb Seasonality Analysis & Trends in San Francisco Mazapa (2025)
Peak Season (December, June, January)
- Revenue averages $1,855 per month
- Occupancy rates average 53.3%
- Daily rates average $77
Shoulder Season
- Revenue averages $1,484 per month
- Occupancy maintains around 50.0%
- Daily rates hold near $72
Low Season (April, September, November)
- Revenue drops to average $1,106 per month
- Occupancy decreases to average 45.5%
- Daily rates adjust to average $69
Seasonality Insights for San Francisco Mazapa
- The Airbnb seasonality in San Francisco Mazapa shows moderate seasonality with distinct peak and low periods. While the sections above show seasonal averages, it's also insightful to look at the extremes:
- During the high season, the absolute peak month showcases San Francisco Mazapa's highest earning potential, with monthly revenues capable of climbing to $1,880, occupancy reaching a high of 66.7%, and ADRs peaking at $83.
- Conversely, the slowest single month of the year, typically falling within the low season, marks the market's lowest point. In this month, revenue might dip to $881, occupancy could drop to 31.8%, and ADRs may adjust down to $65.
- Understanding both the seasonal averages and these monthly peaks and troughs in revenue, occupancy, and ADR is crucial for maximizing your Airbnb profit potential in San Francisco Mazapa.
Seasonal Strategies for Maximizing Profit
- Peak Season: Maximize revenue through premium pricing and potentially longer minimum stays. Ensure high availability.
- Low Season: Offer competitive pricing, special promotions (e.g., extended stay discounts), and flexible cancellation policies. Target off-season travelers like remote workers or budget-conscious guests.
- Shoulder Seasons: Implement dynamic pricing that balances peak and low rates. Target weekend travelers or specific events. Offer slightly more flexible terms than peak season.
- Regularly analyze your own performance against these San Francisco Mazapa seasonality benchmarks and adjust your pricing and availability strategy accordingly.
Best Areas for Airbnb Investment in San Francisco Mazapa (2025)
Exploring the top neighborhoods for short-term rentals in San Francisco Mazapa? This section highlights key areas, outlining why they are attractive for hosts and guests, along with notable local attractions. Consider these locations based on your target guest profile and investment strategy.
| Neighborhood / Area | Why Host Here? (Target Guests & Appeal) | Key Attractions & Landmarks |
|---|---|---|
| Centro Histórico | A UNESCO World Heritage site known for its rich history, stunning architecture, and vibrant cultural scene. Ideal for tourists looking to explore historical landmarks and experience Mexican culture. | Teotihuacán Pyramids, Palacio de la Cultura, Museo de la Máscara, Templo de Quetzalcóatl, Calle de los Muertos |
| San Juan Teotihuacán | Close proximity to the ruins of Teotihuacán, this area attracts travelers interested in archaeology and culture. Perfect for visitors wanting to explore the ancient city and take guided tours. | Teotihuacán Pyramids, Museum of Teotihuacán, Avenue of the Dead, Quetzalcoatl Temple, Archaeological Zone of Teotihuacán |
| La Zona Arqueológica | Directly adjacent to the archaeological site, this area offers unique accommodation options for tourists interested in early morning visits to the pyramids before the crowds arrive. | Pyramid of the Sun, Pyramid of the Moon, Templo de la Serpiente Emplumada, Museum of the Site, Pyramid of Quetzalcoatl |
| San Martín de las Pirámides | A quaint town near the pyramids, offering a more local experience with authentic Mexican culture. Ideal for guests looking for a quieter stay while still being close to the main attractions. | Local markets, Traditional eateries, Pyramid tours, Cultural exchange experiences, Nature walks |
| Pueblo de la Magia | A vibrant area with various accommodations that reflect the local culture. It's perfect for families and groups looking for plenty of amenities and cultural immersion without being too far from the ruins. | Cultural festivals, Artisan shops, Dining experiences, Community events, Nature excursions |
| Santiago | A scenic and tranquil area ideal for nature lovers, providing a different perspective of the surrounding landscape, with chances for hiking and exploring nature, while also being a short distance to the pyramids. | Nature parks, Hiking trails, Local flora and fauna, Scenic viewpoints, Cultural workshops |
| Teotihuacán de Arista | A more residential area providing authentic local experience with easy access to experiences related to the ancient civilization, perfect for guests wanting to immerse themselves in the culture. | Local artisan workshops, Cultural events, Traditional Mexican restaurants, Community gatherings, Shopping for handicrafts |
| Ampliación San Juan | This area offers budget-friendly options while maintaining proximity to historical sites; suitable for solo travelers and backpackers looking to explore without breaking the bank. | Budget accommodations, Local markets, Community events, Public transport access, Cultural experiences |
Understanding Airbnb License Requirements & STR Laws in San Francisco Mazapa (2025)
While San Francisco Mazapa, Teotihuacán, Mexico currently shows low STR regulations, specific Airbnb license requirements might still exist or change. Always verify the latest short term rental regulations and Airbnb license requirements directly with local government authorities for San Francisco Mazapa to ensure full compliance before hosting.
(Source: AirROI data, 2025, finding no licensed listings among those analyzed)
Top Performing Airbnb Properties in San Francisco Mazapa (2025)
Benchmark your potential! Explore examples of top-performing Airbnb properties in San Francisco Mazapabased on Trailing Twelve Month (TTM) revenue. Analyze their characteristics, revenue, occupancy rate, and ADR to understand what drives success in this market.

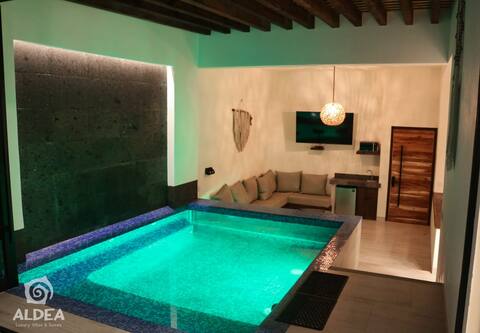
VILLA HUIZACHE PRIVATE POOL +EXCLUSIVITY+LUXURY
Entire Place • 2 bedrooms
Villa Naj´Lujosa Private inn
Entire Place • 2 bedrooms

Loft+alberca privada+Teotihuacan
Entire Place • 2 bedrooms

LUXURIOUS SUITE+ PRIVATE JACUZZI + ARCHAEOLOGICAL AREA
Entire Place • 1 bedroom

SPECTACULAR SUITE+JACUZZI AND PRIVATE TERRACE
Entire Place • 1 bedroom

Master suite+2 Rooms 6px+Pool w/Jacuzzi
Private Room • 2 bedrooms
Note: Performance varies based on location, size, amenities, seasonality, and management quality. Data reflects the past 12 months.
Top Performing Airbnb Hosts in San Francisco Mazapa (2025)
Learn from the best! This table showcases top-performing Airbnb hosts in San Francisco Mazapa based on the number of properties managed and estimated total revenue over the past year. Analyze their scale and performance metrics.
| Host Name | Properties | Grossing Revenue | Stay Reviews | Avg Rating |
|---|---|---|---|---|
| Lofts | 11 | $221,459 | 815 | 4.79/5.0 |
| Host #456152565 | 1 | $5,509 | 0 | 0.00/5.0 |
| Host #53452723 | 3 | $4,845 | 47 | 4.81/5.0 |
| Juan | 4 | $3,885 | 11 | 2.20/5.0 |
Analyzing the strategies of top hosts, such as their property selection, pricing, and guest communication, can offer valuable lessons for optimizing your own Airbnb operations in San Francisco Mazapa.
Dive Deeper: Advanced San Francisco Mazapa STR Market Data (2025)
Ready to unlock more insights? AirROI provides access to advanced metrics and comprehensive Airbnb data for San Francisco Mazapa. Explore detailed analytics beyond this report to refine your investment strategy, optimize pricing, and maximize your vacation rental profits.
Explore Advanced MetricsSan Francisco Mazapa Short-Term Rental Market Composition (2025): Property & Room Types
Room Type Distribution
Property Type Distribution
Market Composition Insights for San Francisco Mazapa
- The San Francisco Mazapa Airbnb market composition is heavily skewed towards Entire Home/Apt listings, which make up 57.9% of the 19 active rentals. This indicates strong guest preference for privacy and space.
- However, a notable 42.1% share for Private Rooms suggests opportunities for budget-conscious travelers or hosts renting out spare rooms.
- Looking at the property type distribution in San Francisco Mazapa, Apartment/Condo properties are the most common (31.6%), reflecting the local real estate landscape.
- The presence of 26.3% Hotel/Boutique listings indicates integration with traditional hospitality.
San Francisco Mazapa Airbnb Room Capacity Analysis (2025): Bedroom Distribution
Distribution of Listings by Number of Bedrooms
Room Capacity Insights for San Francisco Mazapa
- The dominant room capacity in San Francisco Mazapa is 1 bedroom listings, making up 52.6% of the market. This suggests a strong demand for properties suitable for couples or solo travelers.
- Together, 1 bedroom and 2 bedrooms properties represent 100.0% of the active Airbnb listings in San Francisco Mazapa, indicating a high concentration in these sizes.
- With over half the market (52.6%) consisting of studios or 1-bedroom units, San Francisco Mazapa is particularly well-suited for individuals or couples.
San Francisco Mazapa Vacation Rental Guest Capacity Trends (2025)
Distribution of Listings by Guest Capacity
Guest Capacity Insights for San Francisco Mazapa
- The most common guest capacity trend in San Francisco Mazapa vacation rentals is listings accommodating 2 guests (31.6%). This suggests the primary traveler segment is likely couples or solo travelers.
- Properties designed for 2 guests and 6 guests dominate the San Francisco Mazapa STR market, accounting for 52.7% of listings.
- 31.6% of properties accommodate 6+ guests, serving the market segment for larger families or group travel in San Francisco Mazapa.
- On average, properties in San Francisco Mazapa are equipped to host 4.0 guests.
San Francisco Mazapa Airbnb Booking Patterns (2025): Available vs. Booked Days
Available Days Distribution
Booked Days Distribution
Booking Pattern Insights for San Francisco Mazapa
- The most common availability pattern in San Francisco Mazapa falls within the 91-180 days range, representing 36.8% of listings. This suggests many properties have significant open periods on their calendars.
- Approximately 63.1% of listings show high availability (181+ days open annually), indicating potential for increased bookings or specific owner usage patterns.
- For booked days, the 181-270 days range is most frequent in San Francisco Mazapa (42.1%), reflecting common guest stay durations or potential owner blocking patterns.
- A notable 42.1% of properties secure long booking periods (181+ days booked per year), highlighting successful long-term rental strategies or significant owner usage.
San Francisco Mazapa Airbnb Minimum Stay Requirements Analysis
Distribution of Listings by Minimum Night Requirement
1 Night
15 listings
100% of total
Key Insights
- The most prevalent minimum stay requirement in San Francisco Mazapa is 1 Night, adopted by 100% of listings. This highlights the market's preference for shorter, flexible bookings.
- A strong majority (100.0%) of the San Francisco Mazapa Airbnb data shows acceptance of very short stays (1-2 nights), indicating a dynamic, high-turnover market.
Recommendations
- Align with the market by considering a 1 Night minimum stay, as 100% of San Francisco Mazapa hosts use this setting.
- Adjust minimum nights based on seasonality – potentially shorter during low season and longer during peak demand periods in San Francisco Mazapa.
San Francisco Mazapa Airbnb Cancellation Policy Trends Analysis (2025)
Flexible
2 listings
16.7% of total
Firm
6 listings
50% of total
Strict
4 listings
33.3% of total
Cancellation Policy Insights for San Francisco Mazapa
- The prevailing Airbnb cancellation policy trend in San Francisco Mazapa is Firm, used by 50% of listings.
- A majority (83.3%) of hosts in San Francisco Mazapa utilize Firm or Strict policies, indicating a market where hosts prioritize booking security.
Recommendations for Hosts
- Consider adopting a Firm policy to align with the 50% market standard in San Francisco Mazapa.
- With 33.3% using Strict terms, this is a viable option in San Francisco Mazapa, particularly for high-value properties or during peak demand periods.
- Regularly review your cancellation policy against competitors and market demand shifts in San Francisco Mazapa.
San Francisco Mazapa STR Booking Lead Time Analysis (2025)
Average Booking Lead Time by Month
Booking Lead Time Insights for San Francisco Mazapa
- The overall average booking lead time for vacation rentals in San Francisco Mazapa is 17 days.
- Guests book furthest in advance for stays during April (average 42 days), likely coinciding with peak travel demand or local events.
- The shortest booking windows occur for stays in August (average 10 days), indicating more last-minute travel plans during this time.
- Seasonally, Spring (28 days avg.) sees the longest lead times, while Winter (14 days avg.) has the shortest, reflecting typical travel planning cycles.
Recommendations for Hosts
- Use the overall average lead time (17 days) as a baseline for your pricing and availability strategy in San Francisco Mazapa.
- For April stays, consider implementing length-of-stay discounts or slightly higher rates for bookings made less than 42 days out to capitalize on advance planning.
- Target marketing efforts for the Spring season well in advance (at least 28 days) to capture early planners.
- Monitor your own booking lead times against these San Francisco Mazapa averages to identify opportunities for dynamic pricing adjustments.
Popular & Essential Airbnb Amenities in San Francisco Mazapa (2025)
Amenity Prevalence
Amenity Insights for San Francisco Mazapa
- Popular amenities like TV, Free parking on premises, Smoke alarm are common but not universal. Offering these can provide a competitive edge.
- A pool is a highly desired but not standard amenity, making it a key feature for attracting guests seeking leisure in San Francisco Mazapa.
- Warning: Wifi is not universally provided but is considered essential globally. Ensure reliable Wifi is offered.
Recommendations for Hosts
- Consider adding popular differentiators like TV or Free parking on premises to increase appeal.
- Highlight unique or less common amenities you offer (e.g., hot tub, dedicated workspace, EV charger) in your listing description and photos.
- Regularly check competitor amenities in San Francisco Mazapa to stay competitive.
San Francisco Mazapa Airbnb Guest Demographics & Profile Analysis (2025)
Guest Profile Summary for San Francisco Mazapa
- The typical guest profile for Airbnb in San Francisco Mazapa consists of primarily domestic travelers (82%), often arriving from nearby Mexico City, typically belonging to the Post-2000s (Gen Z/Alpha) group (50%), primarily speaking Spanish or English.
- Domestic travelers account for 81.7% of guests.
- Key international markets include Mexico (81.7%) and United States (9.3%).
- Top languages spoken are Spanish (59%) followed by English (34.2%).
- A significant demographic segment is the Post-2000s (Gen Z/Alpha) group, representing 50% of guests.
Recommendations for Hosts
- Target domestic marketing efforts towards travelers from Mexico City and Santiago de Querétaro.
- Tailor amenities and listing descriptions to appeal to the dominant Post-2000s (Gen Z/Alpha) demographic (e.g., highlight fast WiFi, smart home features, local guides).
- Highlight unique local experiences or amenities relevant to the primary guest profile.
- Consider seasonal promotions aligned with peak travel times for key origin markets.
Nearby Short-Term Rental Market Comparison
How does the San Francisco Mazapa Airbnb market stack up against its neighbors? Compare key performance metrics like average monthly revenue, ADR, and occupancy rates in surrounding areas to understand the broader regional STR landscape.
| Market | Active Properties | Monthly Revenue | Daily Rate | Avg. Occupancy |
|---|---|---|---|---|
| Tepeji del Rio de Ocampo | 12 | $2,855 | $317.65 | 27% |
| Yautepec de Zaragoza | 12 | $2,753 | $246.48 | 27% |
| Rancho San Diego | 19 | $2,367 | $256.96 | 33% |
| La Ladrillera | 28 | $2,273 | $235.35 | 32% |
| Tzibantzá | 12 | $2,240 | $251.83 | 26% |
| La Tortuga | 66 | $2,167 | $231.84 | 32% |
| Xalmolonco | 21 | $2,075 | $276.55 | 28% |
| Granjas Mérida | 21 | $1,927 | $238.09 | 31% |
| Atlatlahucan | 69 | $1,863 | $249.73 | 28% |
| Lomas de Cocoyoc | 149 | $1,752 | $250.75 | 28% |