Pereybere Airbnb Market Analysis 2026: Short Term Rental Data & Vacation Rental Statistics in Rivière du Rempart District, Mauritius
Is Airbnb profitable in Pereybere in 2026? Explore comprehensive Airbnb analytics for Pereybere, Rivière du Rempart District, Mauritius to uncover income potential. This 2026 STR market report for Pereybere, based on AirROI data from February 2025 to January 2026, reveals key trends in the market of 215 active listings.
Whether you're considering an Airbnb investment in Pereybere, optimizing your existing vacation rental, or exploring rental arbitrage opportunities, understanding the Pereybere Airbnb data is crucial. Leveraging the low regulation environment is key to maximizing your short term rental income potential. Let's dive into the specifics.
Key Pereybere Airbnb Performance Metrics Overview
Monthly Airbnb Revenue Variations & Income Potential in Pereybere (2026)
Understanding the monthly revenue variations for Airbnb listings in Pereybere is key to maximizing your short term rental income potential. Seasonality significantly impacts earnings. Our analysis, based on data from the past 12 months, shows that the peak revenue month for STRs in Pereybere is typically November, while June often presents the lowest earnings, highlighting opportunities for strategic pricing adjustments during shoulder and low seasons. Explore the typical Airbnb income in Pereybere across different performance tiers:
- Best-in-class properties (Top 10%) achieve $3,456+ monthly, often utilizing dynamic pricing and superior guest experiences.
- Strong performing properties (Top 25%) earn $1,848 or more, indicating effective management and desirable locations/amenities.
- Typical properties (Median) generate around $897 per month, representing the average market performance.
- Entry-level properties (Bottom 25%) see earnings around $345, often with potential for optimization.
Average Monthly Airbnb Earnings Trend in Pereybere
Pereybere Airbnb Occupancy Rate Trends (2026)
Maximize your bookings by understanding the Pereybere STR occupancy trends. Seasonal demand shifts significantly influence how often properties are booked. Typically, Novembersees the highest demand (peak season occupancy), while June experiences the lowest (low season). Effective strategies, like adjusting minimum stays or offering promotions, can boost occupancy during slower periods. Here's how different property tiers perform in Pereybere:
- Best-in-class properties (Top 10%) achieve 84%+ occupancy, indicating high desirability and potentially optimized availability.
- Strong performing properties (Top 25%) maintain 66% or higher occupancy, suggesting good market fit and guest satisfaction.
- Typical properties (Median) have an occupancy rate around 37%.
- Entry-level properties (Bottom 25%) average 15% occupancy, potentially facing higher vacancy.
Average Monthly Occupancy Rate Trend in Pereybere
Average Daily Rate (ADR) Airbnb Trends in Pereybere (2026)
Effective short term rental pricing strategy in Pereybere involves understanding monthly ADR fluctuations. The Average Daily Rate (ADR) for Airbnb in Pereybere typically peaks in December and dips lowest during May. Leveraging Airbnb dynamic pricing tools or strategies based on this seasonality can significantly boost revenue. Here's a look at the typical nightly rates achieved:
- Best-in-class properties (Top 10%) command rates of $229+ per night, often due to premium features or locations.
- Strong performing properties (Top 25%) achieve nightly rates of $139 or more.
- Typical properties (Median) charge around $77 per night.
- Entry-level properties (Bottom 25%) earn around $53 per night.
Average Daily Rate (ADR) Trend by Month in Pereybere
Get Live Pereybere Market Intelligence 👇

Explore Real-time Analytics
Airbnb Seasonality Analysis & Trends in Pereybere (2026)
Peak Season (November, December, October)
- Revenue averages $1,978 per month
- Occupancy rates average 49.6%
- Daily rates average $123
Shoulder Season
- Revenue averages $1,448 per month
- Occupancy maintains around 42.0%
- Daily rates hold near $113
Low Season (May, June, September)
- Revenue drops to average $1,077 per month
- Occupancy decreases to average 32.9%
- Daily rates adjust to average $109
Seasonality Insights for Pereybere
- The Airbnb seasonality in Pereybere shows highly seasonal trends requiring careful strategy. While the sections above show seasonal averages, it's also insightful to look at the extremes:
- During the high season, the absolute peak month showcases Pereybere's highest earning potential, with monthly revenues capable of climbing to $2,151, occupancy reaching a high of 56.9%, and ADRs peaking at $129.
- Conversely, the slowest single month of the year, typically falling within the low season, marks the market's lowest point. In this month, revenue might dip to $763, occupancy could drop to 26.1%, and ADRs may adjust down to $107.
- Understanding both the seasonal averages and these monthly peaks and troughs in revenue, occupancy, and ADR is crucial for maximizing your Airbnb profit potential in Pereybere.
Seasonal Strategies for Maximizing Profit
- Peak Season: Maximize revenue through premium pricing and potentially longer minimum stays. Ensure high availability.
- Low Season: Offer competitive pricing, special promotions (e.g., extended stay discounts), and flexible cancellation policies. Target off-season travelers like remote workers or budget-conscious guests.
- Shoulder Seasons: Implement dynamic pricing that balances peak and low rates. Target weekend travelers or specific events. Offer slightly more flexible terms than peak season.
- Regularly analyze your own performance against these Pereybere seasonality benchmarks and adjust your pricing and availability strategy accordingly.
Best Areas for Airbnb Investment in Pereybere (2026)
Exploring the top neighborhoods for short-term rentals in Pereybere? This section highlights key areas, outlining why they are attractive for hosts and guests, along with notable local attractions. Consider these locations based on your target guest profile and investment strategy.
| Neighborhood / Area | Why Host Here? (Target Guests & Appeal) | Key Attractions & Landmarks |
|---|---|---|
| Pereybere Beach | Famous for its stunning white sand beach and crystal clear waters. Ideal for families and couples looking for relaxation or water sports, making it a favored destination for tourists. | Pereybere Public Beach, Grand Baie, Water Sports Activities, Shopping and Dining Options, Turtle Bay, Cap Malheureux |
| Grand Baie | A bustling tourist hub known for its nightlife, restaurants, and shopping. Attracts younger crowds and international travelers looking for entertainment and enjoyment. | La Cuvette Beach, Shopping Malls, Nightlife Spots, Restaurants, Grand Baie Bazaar, Beachfront Activities |
| Cap Malheureux | Known for its picturesque red-roofed church and stunning coastal views, it appeals to those looking for a quieter seaside experience with local charm. | Notre Dame Auxiliatrice, Cap Malheureux Beach, Local Markets, Scenic Views, Fishing Village Charm |
| Mont Choisy | Features a long stretch of beach and a beautiful lagoon, it’s a hotspot for sunbathers and water sports lovers, ideal for holiday makers. | Mont Choisy Beach, Water Sports, Golf Courses, National Parks, Local Cuisine |
| Trou aux Biches | Offers a quieter, more laid-back atmosphere with natural beauty and family-friendly activities. Great for long stays and family vacations. | Trou aux Biches Beach, Safe swimming areas, Local restaurants, Snorkeling spots, Village Charm |
| Balaclava | A luxury destination with high-end resorts and beachfront properties. Attracts affluent travelers and those looking for a more upscale experience. | Balaclava Beach, Five Star Resorts, Spas, Sailing and Boating, Underwater research center |
| Flic en Flac | Another popular beach destination known for its vibrant nightlife and beautiful beaches, appealing to both local tourists and international visitors. | Flic en Flac Beach, Nightlife, Local Markets, Water Sports, Diving Sites |
| Rivière Noire | A beautiful coastal area offering stunning views and adventure sports like dolphin watching and deep-sea fishing, ideal for eco-tourism. | Black River Gorges National Park, Dolphin Watching Tours, Tamarind Falls, Local Cuisine, Adventure Sports |
Understanding Airbnb License Requirements & STR Laws in Pereybere (2026)
While Pereybere, Rivière du Rempart District, Mauritius currently shows low STR regulations, specific Airbnb license requirements might still exist or change. Always verify the latest short term rental regulations and Airbnb license requirements directly with local government authorities for Pereybere to ensure full compliance before hosting.
(Source: AirROI data, 2026, finding no licensed listings among those analyzed)
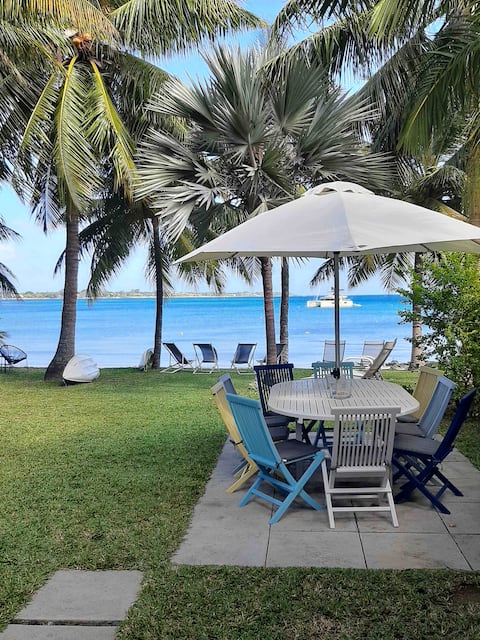
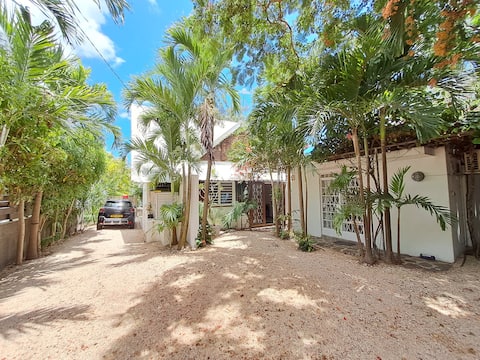
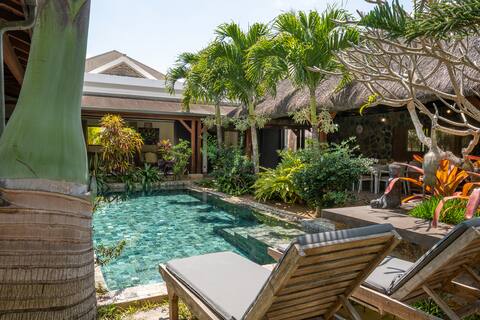
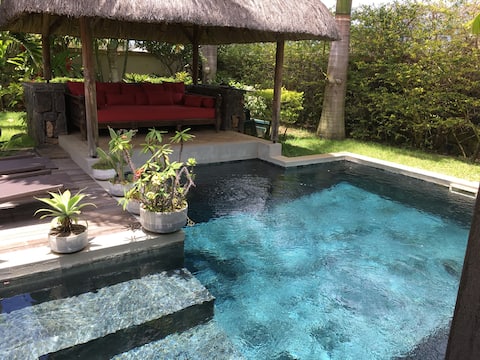
Top Performing Airbnb Properties in Pereybere (2026)
Benchmark your potential! Explore examples of top-performing Airbnb properties in Pereyberebased on Trailing Twelve Month (TTM) revenue. Analyze their characteristics, revenue, occupancy rate, and ADR to understand what drives success in this market.
Waterfront, Merville Beach
Entire Place • 4 bedrooms
Seaside Villa in North Mauritius-cook and cleaner
Entire Place • 4 bedrooms
LUXURY PARADIS VILLA *****
Entire Place • 4 bedrooms
Balinese paradise
Entire Place • 2 bedrooms

Facing the ocean and the Coin de Mire
Entire Place • 3 bedrooms

Rooftop Villa for an Unforgettable Vacation
Entire Place • 3 bedrooms
Note: Performance varies based on location, size, amenities, seasonality, and management quality. Data reflects the past 12 months.
Top Performing Airbnb Hosts in Pereybere (2026)
Learn from the best! This table showcases top-performing Airbnb hosts in Pereybere based on the number of properties managed and estimated total revenue over the past year. Analyze their scale and performance metrics.
| Host Name | Properties | Grossing Revenue | Stay Reviews | Avg Rating |
|---|---|---|---|---|
| Nathalie | 1 | $97,856 | 58 | 4.93/5.0 |
| Diane | 1 | $86,231 | 33 | 4.85/5.0 |
| Eliott | 1 | $82,618 | 48 | 4.79/5.0 |
| Jlsk | 2 | $75,148 | 17 | 4.87/5.0 |
| Xavier | 1 | $73,337 | 113 | 4.94/5.0 |
| Villa Palma | 2 | $62,798 | 102 | 4.95/5.0 |
| Gian Rodolfo | 1 | $56,330 | 35 | 4.94/5.0 |
| Pereybere Apartment | 4 | $54,903 | 335 | 4.68/5.0 |
| Naushikha | 1 | $52,435 | 30 | 4.70/5.0 |
| Nathalie | 1 | $52,061 | 1 | Not Rated |
Analyzing the strategies of top hosts, such as their property selection, pricing, and guest communication, can offer valuable lessons for optimizing your own Airbnb operations in Pereybere.
Dive Deeper: Advanced Pereybere STR Market Data (2026)
Ready to unlock more insights? AirROI provides access to advanced metrics and comprehensive Airbnb data for Pereybere. Explore detailed analytics beyond this report to refine your investment strategy, optimize pricing, and maximize your vacation rental profits.
Explore Advanced MetricsPereybere Short-Term Rental Market Composition (2026): Property & Room Types
Room Type Distribution
Property Type Distribution
Market Composition Insights for Pereybere
- The Pereybere Airbnb market composition is heavily skewed towards Entire Home/Apt listings, which make up 91.2% of the 215 active rentals. This indicates strong guest preference for privacy and space.
- Looking at the property type distribution in Pereybere, Apartment/Condo properties are the most common (64.7%), reflecting the local real estate landscape.
- Houses represent a significant 33% portion, catering likely to families or larger groups.
- Smaller segments like hotel/boutique, unique stays, others (combined 2.4%) offer potential for unique stay experiences.
Pereybere Airbnb Room Capacity Analysis (2026): Bedroom Distribution
Distribution of Listings by Number of Bedrooms
Room Capacity Insights for Pereybere
- The dominant room capacity in Pereybere is 2 bedrooms listings, making up 38.1% of the market. This suggests a strong demand for properties suitable for couples or solo travelers.
- Together, 2 bedrooms and 1 bedroom properties represent 59.0% of the active Airbnb listings in Pereybere, indicating a high concentration in these sizes.
- A significant 28.9% of listings offer 3+ bedrooms, catering to larger groups and families seeking more space in Pereybere.
Pereybere Vacation Rental Guest Capacity Trends (2026)
Distribution of Listings by Guest Capacity
Guest Capacity Insights for Pereybere
- The most common guest capacity trend in Pereybere vacation rentals is listings accommodating 4 guests (31.2%). This suggests the primary traveler segment is likely small families or groups.
- Properties designed for 4 guests and 2 guests dominate the Pereybere STR market, accounting for 54.0% of listings.
- 27.9% of properties accommodate 6+ guests, serving the market segment for larger families or group travel in Pereybere.
- On average, properties in Pereybere are equipped to host 4.0 guests.
Pereybere Airbnb Booking Patterns (2026): Available vs. Booked Days
Available Days Distribution
Booked Days Distribution
Booking Pattern Insights for Pereybere
- The most common availability pattern in Pereybere falls within the 271-366 days range, representing 62.8% of listings. This suggests many properties have significant open periods on their calendars.
- Approximately 83.3% of listings show high availability (181+ days open annually), indicating potential for increased bookings or specific owner usage patterns.
- For booked days, the 31-90 days range is most frequent in Pereybere (30.7%), reflecting common guest stay durations or potential owner blocking patterns.
- A notable 17.6% of properties secure long booking periods (181+ days booked per year), highlighting successful long-term rental strategies or significant owner usage.
Pereybere Airbnb Minimum Stay Requirements Analysis
Distribution of Listings by Minimum Night Requirement
1 Night
6 listings
2.8% of total
2 Nights
18 listings
8.4% of total
3 Nights
50 listings
23.3% of total
4-6 Nights
63 listings
29.3% of total
7-29 Nights
29 listings
13.5% of total
30+ Nights
49 listings
22.8% of total
Key Insights
- The most prevalent minimum stay requirement in Pereybere is 4-6 Nights, adopted by 29.3% of listings. This highlights the market's preference for longer commitments.
- Very short stays (1-2 nights) are less common (11.2%), suggesting hosts prefer slightly longer bookings to optimize turnover.
- A significant segment (22.8%) caters to monthly stays (30+ nights) in Pereybere, pointing to opportunities in the extended-stay market.
Recommendations
- Align with the market by considering a 4-6 Nights minimum stay, as 29.3% of Pereybere hosts use this setting.
- If feasible, allowing 1-night stays, especially midweek or during low season, could capture last-minute bookings, as only 2.8% currently do.
- Explore offering discounts for stays of 30+ nights to attract the 22.8% of the market seeking extended stays.
- Adjust minimum nights based on seasonality – potentially shorter during low season and longer during peak demand periods in Pereybere.
Pereybere Airbnb Cancellation Policy Trends Analysis (2026)
Super Strict 60 Days
2 listings
0.9% of total
Super Strict 30 Days
2 listings
0.9% of total
Limited
1 listings
0.5% of total
Flexible
54 listings
25.2% of total
Moderate
44 listings
20.6% of total
Firm
83 listings
38.8% of total
Strict
28 listings
13.1% of total
Cancellation Policy Insights for Pereybere
- The prevailing Airbnb cancellation policy trend in Pereybere is Firm, used by 38.8% of listings.
- A majority (51.9%) of hosts in Pereybere utilize Firm or Strict policies, indicating a market where hosts prioritize booking security.
Recommendations for Hosts
- Consider adopting a Firm policy to align with the 38.8% market standard in Pereybere.
- Using a Strict policy might deter some guests, as only 13.1% of listings use it. Evaluate if potential revenue protection outweighs possible lower booking rates.
- Regularly review your cancellation policy against competitors and market demand shifts in Pereybere.
Pereybere STR Booking Lead Time Analysis (2026)
Average Booking Lead Time by Month
Booking Lead Time Insights for Pereybere
- The overall average booking lead time for vacation rentals in Pereybere is 66 days.
- Guests book furthest in advance for stays during October (average 107 days), likely coinciding with peak travel demand or local events.
- The shortest booking windows occur for stays in June (average 25 days), indicating more last-minute travel plans during this time.
- Seasonally, Winter (90 days avg.) sees the longest lead times, while Summer (50 days avg.) has the shortest, reflecting typical travel planning cycles.
Recommendations for Hosts
- Use the overall average lead time (66 days) as a baseline for your pricing and availability strategy in Pereybere.
- For October stays, consider implementing length-of-stay discounts or slightly higher rates for bookings made less than 107 days out to capitalize on advance planning.
- Target marketing efforts for the Winter season well in advance (at least 90 days) to capture early planners.
- Monitor your own booking lead times against these Pereybere averages to identify opportunities for dynamic pricing adjustments.
Popular & Essential Airbnb Amenities in Pereybere (2026)
Amenity Prevalence
Amenity Insights for Pereybere
- Essential amenities in Pereybere that guests expect include: Wifi, Air conditioning. Lacking these (any) could significantly impact bookings.
- Popular amenities like TV, Kitchen, Free parking on premises are common but not universal. Offering these can provide a competitive edge.
Recommendations for Hosts
- Ensure your listing includes all essential amenities for Pereybere: Wifi, Air conditioning.
- Prioritize adding missing essentials: Wifi, Air conditioning.
- Consider adding popular differentiators like TV or Kitchen to increase appeal.
- Highlight unique or less common amenities you offer (e.g., hot tub, dedicated workspace, EV charger) in your listing description and photos.
- Regularly check competitor amenities in Pereybere to stay competitive.
Pereybere Airbnb Guest Demographics & Profile Analysis (2026)
Guest Profile Summary for Pereybere
- The typical guest profile for Airbnb in Pereybere consists of predominantly international visitors (99%), with top international origins including Germany, typically belonging to the Post-2000s (Gen Z/Alpha) group (50%), primarily speaking English or French.
- Domestic travelers account for 1.0% of guests.
- Key international markets include France (41.9%) and Germany (12.8%).
- Top languages spoken are English (41.5%) followed by French (27%).
- A significant demographic segment is the Post-2000s (Gen Z/Alpha) group, representing 50% of guests.
Recommendations for Hosts
- Focus marketing internationally, particularly towards travelers from Germany.
- Tailor amenities and listing descriptions to appeal to the dominant Post-2000s (Gen Z/Alpha) demographic (e.g., highlight fast WiFi, smart home features, local guides).
- Highlight unique local experiences or amenities relevant to the primary guest profile.
- Consider seasonal promotions aligned with peak travel times for key origin markets.
Nearby Short-Term Rental Market Comparison
How does the Pereybere Airbnb market stack up against its neighbors? Compare key performance metrics like average monthly revenue, ADR, and occupancy rates in surrounding areas to understand the broader regional STR landscape.
| Market | Active Properties | Monthly Revenue | Daily Rate | Avg. Occupancy |
|---|---|---|---|---|
| Grande Rivière Noire VCA | 49 | $4,032 | $238.78 | 56% |
| Grand River South East | 21 | $3,523 | $804.67 | 32% |
| Poste de Flacq | 39 | $3,291 | $466.82 | 36% |
| Grand River South-East | 13 | $3,158 | $510.13 | 37% |
| Tamarin VCA | 38 | $2,866 | $237.67 | 50% |
| Le Morne | 50 | $2,759 | $200.53 | 54% |
| Grande Rivière Noire | 116 | $2,376 | $210.56 | 47% |
| Roches Noires | 31 | $2,342 | $302.46 | 42% |
| Albion VCA | 14 | $2,309 | $156.27 | 57% |
| Grand Gaube | 73 | $1,990 | $163.37 | 44% |