Luqa Airbnb Market Analysis 2026: Short Term Rental Data & Vacation Rental Statistics in Southern Region, Malta
Is Airbnb profitable in Luqa in 2026? Explore comprehensive Airbnb analytics for Luqa, Southern Region, Malta to uncover income potential. This 2026 STR market report for Luqa, based on AirROI data from February 2025 to January 2026, reveals key trends in the niche market of 28 active listings.
Whether you're considering an Airbnb investment in Luqa, optimizing your existing vacation rental, or exploring rental arbitrage opportunities, understanding the Luqa Airbnb data is crucial. Leveraging the low regulation environment is key to maximizing your short term rental income potential. Let's dive into the specifics.
Key Luqa Airbnb Performance Metrics Overview
Monthly Airbnb Revenue Variations & Income Potential in Luqa (2026)
Understanding the monthly revenue variations for Airbnb listings in Luqa is key to maximizing your short term rental income potential. Seasonality significantly impacts earnings. Our analysis, based on data from the past 12 months, shows that the peak revenue month for STRs in Luqa is typically August, while January often presents the lowest earnings, highlighting opportunities for strategic pricing adjustments during shoulder and low seasons. Explore the typical Airbnb income in Luqa across different performance tiers:
- Best-in-class properties (Top 10%) achieve $2,631+ monthly, often utilizing dynamic pricing and superior guest experiences.
- Strong performing properties (Top 25%) earn $2,030 or more, indicating effective management and desirable locations/amenities.
- Typical properties (Median) generate around $1,322 per month, representing the average market performance.
- Entry-level properties (Bottom 25%) see earnings around $852, often with potential for optimization.
Average Monthly Airbnb Earnings Trend in Luqa
Luqa Airbnb Occupancy Rate Trends (2026)
Maximize your bookings by understanding the Luqa STR occupancy trends. Seasonal demand shifts significantly influence how often properties are booked. Typically, Augustsees the highest demand (peak season occupancy), while January experiences the lowest (low season). Effective strategies, like adjusting minimum stays or offering promotions, can boost occupancy during slower periods. Here's how different property tiers perform in Luqa:
- Best-in-class properties (Top 10%) achieve 83%+ occupancy, indicating high desirability and potentially optimized availability.
- Strong performing properties (Top 25%) maintain 71% or higher occupancy, suggesting good market fit and guest satisfaction.
- Typical properties (Median) have an occupancy rate around 52%.
- Entry-level properties (Bottom 25%) average 30% occupancy, potentially facing higher vacancy.
Average Monthly Occupancy Rate Trend in Luqa
Average Daily Rate (ADR) Airbnb Trends in Luqa (2026)
Effective short term rental pricing strategy in Luqa involves understanding monthly ADR fluctuations. The Average Daily Rate (ADR) for Airbnb in Luqa typically peaks in December and dips lowest during February. Leveraging Airbnb dynamic pricing tools or strategies based on this seasonality can significantly boost revenue. Here's a look at the typical nightly rates achieved:
- Best-in-class properties (Top 10%) command rates of $202+ per night, often due to premium features or locations.
- Strong performing properties (Top 25%) achieve nightly rates of $162 or more.
- Typical properties (Median) charge around $115 per night.
- Entry-level properties (Bottom 25%) earn around $68 per night.
Average Daily Rate (ADR) Trend by Month in Luqa
Get Live Luqa Market Intelligence 👇

Explore Real-time Analytics
Airbnb Seasonality Analysis & Trends in Luqa (2026)
Peak Season (August, July, September)
- Revenue averages $2,522 per month
- Occupancy rates average 70.9%
- Daily rates average $131
Shoulder Season
- Revenue averages $1,370 per month
- Occupancy maintains around 50.8%
- Daily rates hold near $117
Low Season (January, February, November)
- Revenue drops to average $669 per month
- Occupancy decreases to average 30.7%
- Daily rates adjust to average $118
Seasonality Insights for Luqa
- The Airbnb seasonality in Luqa shows highly seasonal trends requiring careful strategy. While the sections above show seasonal averages, it's also insightful to look at the extremes:
- During the high season, the absolute peak month showcases Luqa's highest earning potential, with monthly revenues capable of climbing to $2,715, occupancy reaching a high of 71.5%, and ADRs peaking at $140.
- Conversely, the slowest single month of the year, typically falling within the low season, marks the market's lowest point. In this month, revenue might dip to $550, occupancy could drop to 25.4%, and ADRs may adjust down to $92.
- Understanding both the seasonal averages and these monthly peaks and troughs in revenue, occupancy, and ADR is crucial for maximizing your Airbnb profit potential in Luqa.
Seasonal Strategies for Maximizing Profit
- Peak Season: Maximize revenue through premium pricing and potentially longer minimum stays. Ensure high availability.
- Low Season: Offer competitive pricing, special promotions (e.g., extended stay discounts), and flexible cancellation policies. Target off-season travelers like remote workers or budget-conscious guests.
- Shoulder Seasons: Implement dynamic pricing that balances peak and low rates. Target weekend travelers or specific events. Offer slightly more flexible terms than peak season.
- Regularly analyze your own performance against these Luqa seasonality benchmarks and adjust your pricing and availability strategy accordingly.
Best Areas for Airbnb Investment in Luqa (2026)
Exploring the top neighborhoods for short-term rentals in Luqa? This section highlights key areas, outlining why they are attractive for hosts and guests, along with notable local attractions. Consider these locations based on your target guest profile and investment strategy.
| Neighborhood / Area | Why Host Here? (Target Guests & Appeal) | Key Attractions & Landmarks |
|---|---|---|
| Marsaxlokk | Traditional fishing village known for its picturesque waterfront, colorful boats, and local seafood cuisine. Popular with tourists looking for a relaxing and authentic Maltese experience. | Marsaxlokk Bay, Fish Market, St. Peter's Pool, Delimara, Braħal Bil-Baħar |
| Zabbar | Rich in history and culture, with beautiful baroque architecture and proximity to historical sites. Great for guests interested in Maltese heritage and local life. | St. James Bastion, Zabbar Parish Church, Siggiewi Church, Forti Sant'Anġlu, Maltese culture centers |
| Bormla (Cospicua) | One of the three cities, known for its historical significance and less touristy environment. Appeals to visitors looking for an authentic Maltese city experience. | Cospicua Waterfront, Fort Bormla, Historical museums, Gardens of the Three Cities, Local eateries |
| Sliema | A bustling town known for its shopping, restaurants, and nightlife. Sliema is also close to Valletta and is attractive to tourists seeking a vibrant urban vibe. | Sliema Promenade, Shopping Malls, Fort Tigne, Mediterranean Sea views, Numerous cafes and bars |
| Paceville | The nightlife hub of Malta, popular among younger tourists. Known for clubs, bars, and a vibrant social scene, making it a top choice for fun-seeking visitors. | St. George's Beach, Nightclubs, Pubs and bars, Entertainment options, Shopping areas |
| Valletta | The capital city of Malta, packed with history, architecture, and culture. Ideal for tourists looking to explore the rich heritage of the island. | St. John's Co-Cathedral, Upper Barracca Gardens, The Forts, National Museum of Archaeology, Valletta Waterfront |
| Mosta | Famous for its large dome church, Mosta is a lovely town that combines history with modern living. Ideal for visitors interested in cultural exploration and tranquility. | Rotunda of Mosta, Mosta Dome, Historic sites, Local markets, Nearby parks |
| Gozo | A smaller island that offers a more laid-back vibe compared to Malta. Known for its natural beauty, history, and outdoor activities. A favorite for nature lovers and families. | Azure Window, Victoria Citadel, Ramla Bay, Dwejra Bay, Gozo's countryside |
Understanding Airbnb License Requirements & STR Laws in Luqa (2026)
While Luqa, Southern Region, Malta currently shows low STR regulations, specific Airbnb license requirements might still exist or change. Always verify the latest short term rental regulations and Airbnb license requirements directly with local government authorities for Luqa to ensure full compliance before hosting.
(Source: AirROI data, 2026, finding no licensed listings among those analyzed)
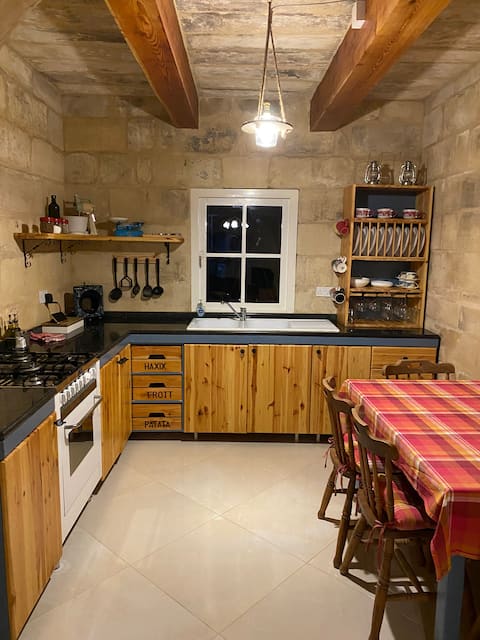
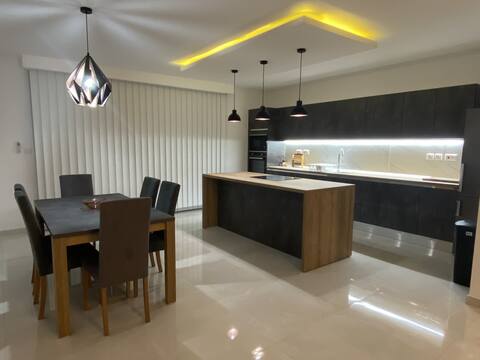
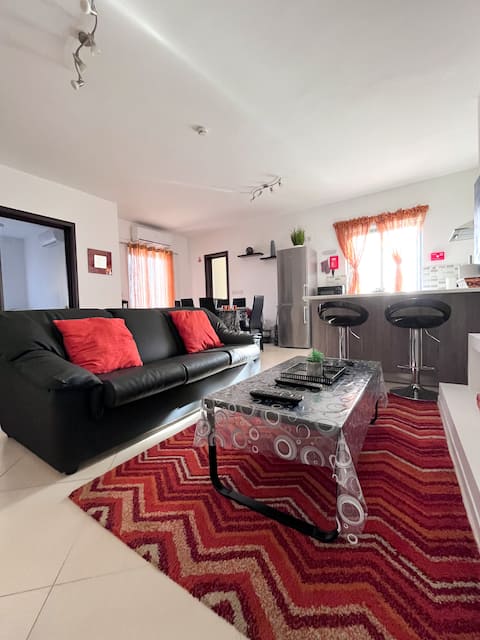
Top Performing Airbnb Properties in Luqa (2026)
Benchmark your potential! Explore examples of top-performing Airbnb properties in Luqabased on Trailing Twelve Month (TTM) revenue. Analyze their characteristics, revenue, occupancy rate, and ADR to understand what drives success in this market.
The Cottage
Entire Place • 1 bedroom
Amazing Apartment Sleeps 7 near Malta Airport
Entire Place • 3 bedrooms
Modern Penthouse w/ 2 Terraces - Close to Airport
Entire Place • 2 bedrooms

One Lemon Tree apartment (1.6 km from Airport)
Entire Place • 1 bedroom

Private One Bedroom Apartment close to Airport
Entire Place • 1 bedroom

Modern 3 bedroom apartment
Entire Place • 3 bedrooms
Note: Performance varies based on location, size, amenities, seasonality, and management quality. Data reflects the past 12 months.
Top Performing Airbnb Hosts in Luqa (2026)
Learn from the best! This table showcases top-performing Airbnb hosts in Luqa based on the number of properties managed and estimated total revenue over the past year. Analyze their scale and performance metrics.
| Host Name | Properties | Grossing Revenue | Stay Reviews | Avg Rating |
|---|---|---|---|---|
| Carmel | 4 | $55,415 | 1713 | 4.35/5.0 |
| Elle | 3 | $44,310 | 376 | 4.79/5.0 |
| Matthew | 2 | $40,811 | 13 | 4.57/5.0 |
| Giovanni | 1 | $22,235 | 36 | 4.94/5.0 |
| Claire | 1 | $21,862 | 13 | 5.00/5.0 |
| Nathan | 1 | $21,319 | 6 | 4.67/5.0 |
| Josianne | 1 | $21,188 | 184 | 4.97/5.0 |
| Andrea | 1 | $20,938 | 143 | 4.87/5.0 |
| Rita | 1 | $20,920 | 16 | 5.00/5.0 |
| Liam | 1 | $20,720 | 11 | 4.82/5.0 |
Analyzing the strategies of top hosts, such as their property selection, pricing, and guest communication, can offer valuable lessons for optimizing your own Airbnb operations in Luqa.
Dive Deeper: Advanced Luqa STR Market Data (2026)
Ready to unlock more insights? AirROI provides access to advanced metrics and comprehensive Airbnb data for Luqa. Explore detailed analytics beyond this report to refine your investment strategy, optimize pricing, and maximize your vacation rental profits.
Explore Advanced MetricsLuqa Short-Term Rental Market Composition (2026): Property & Room Types
Room Type Distribution
Property Type Distribution
Market Composition Insights for Luqa
- The Luqa Airbnb market composition is heavily skewed towards Entire Home/Apt listings, which make up 60.7% of the 28 active rentals. This indicates strong guest preference for privacy and space.
- However, a notable 39.3% share for Private Rooms suggests opportunities for budget-conscious travelers or hosts renting out spare rooms.
- Looking at the property type distribution in Luqa, Apartment/Condo properties are the most common (53.6%), reflecting the local real estate landscape.
- Houses represent a significant 46.4% portion, catering likely to families or larger groups.
Luqa Airbnb Room Capacity Analysis (2026): Bedroom Distribution
Distribution of Listings by Number of Bedrooms
Room Capacity Insights for Luqa
- The dominant room capacity in Luqa is 3 bedrooms listings, making up 32.1% of the market. This suggests a strong demand for properties suitable for families or small groups.
- Together, 3 bedrooms and 2 bedrooms properties represent 46.4% of the active Airbnb listings in Luqa, indicating a high concentration in these sizes.
- A significant 32.1% of listings offer 3+ bedrooms, catering to larger groups and families seeking more space in Luqa.
Luqa Vacation Rental Guest Capacity Trends (2026)
Distribution of Listings by Guest Capacity
Guest Capacity Insights for Luqa
- The most common guest capacity trend in Luqa vacation rentals is listings accommodating 6 guests (28.6%). This suggests the primary traveler segment is likely larger groups.
- Properties designed for 6 guests and 7 guests dominate the Luqa STR market, accounting for 39.3% of listings.
- 39.3% of properties accommodate 6+ guests, serving the market segment for larger families or group travel in Luqa.
- On average, properties in Luqa are equipped to host 3.1 guests.
Luqa Airbnb Booking Patterns (2026): Available vs. Booked Days
Available Days Distribution
Booked Days Distribution
Booking Pattern Insights for Luqa
- The most common availability pattern in Luqa falls within the 181-270 days range, representing 35.7% of listings. This suggests many properties have significant open periods on their calendars.
- Approximately 67.8% of listings show high availability (181+ days open annually), indicating potential for increased bookings or specific owner usage patterns.
- For booked days, the 91-180 days range is most frequent in Luqa (32.1%), reflecting common guest stay durations or potential owner blocking patterns.
- A notable 35.7% of properties secure long booking periods (181+ days booked per year), highlighting successful long-term rental strategies or significant owner usage.
Luqa Airbnb Minimum Stay Requirements Analysis
Distribution of Listings by Minimum Night Requirement
1 Night
16 listings
57.1% of total
2 Nights
3 listings
10.7% of total
3 Nights
3 listings
10.7% of total
30+ Nights
6 listings
21.4% of total
Key Insights
- The most prevalent minimum stay requirement in Luqa is 1 Night, adopted by 57.1% of listings. This highlights the market's preference for shorter, flexible bookings.
- A strong majority (67.8%) of the Luqa Airbnb data shows acceptance of very short stays (1-2 nights), indicating a dynamic, high-turnover market.
- A significant segment (21.4%) caters to monthly stays (30+ nights) in Luqa, pointing to opportunities in the extended-stay market.
Recommendations
- Align with the market by considering a 1 Night minimum stay, as 57.1% of Luqa hosts use this setting.
- Explore offering discounts for stays of 30+ nights to attract the 21.4% of the market seeking extended stays.
- Adjust minimum nights based on seasonality – potentially shorter during low season and longer during peak demand periods in Luqa.
Luqa Airbnb Cancellation Policy Trends Analysis (2026)
Limited
2 listings
7.1% of total
Flexible
8 listings
28.6% of total
Moderate
11 listings
39.3% of total
Firm
6 listings
21.4% of total
Strict
1 listings
3.6% of total
Cancellation Policy Insights for Luqa
- The prevailing Airbnb cancellation policy trend in Luqa is Moderate, used by 39.3% of listings.
- There's a relatively balanced mix between guest-friendly (67.9%) and stricter (25.0%) policies, offering choices for different guest needs.
- Strict cancellation policies are quite rare (3.6%), potentially making listings with this policy less competitive unless justified by high demand or property type.
Recommendations for Hosts
- Consider adopting a Moderate policy to align with the 39.3% market standard in Luqa.
- Using a Strict policy might deter some guests, as only 3.6% of listings use it. Evaluate if potential revenue protection outweighs possible lower booking rates.
- Regularly review your cancellation policy against competitors and market demand shifts in Luqa.
Luqa STR Booking Lead Time Analysis (2026)
Average Booking Lead Time by Month
Booking Lead Time Insights for Luqa
- The overall average booking lead time for vacation rentals in Luqa is 56 days.
- Guests book furthest in advance for stays during August (average 79 days), likely coinciding with peak travel demand or local events.
- The shortest booking windows occur for stays in February (average 26 days), indicating more last-minute travel plans during this time.
- Seasonally, Summer (65 days avg.) sees the longest lead times, while Winter (31 days avg.) has the shortest, reflecting typical travel planning cycles.
Recommendations for Hosts
- Use the overall average lead time (56 days) as a baseline for your pricing and availability strategy in Luqa.
- For August stays, consider implementing length-of-stay discounts or slightly higher rates for bookings made less than 79 days out to capitalize on advance planning.
- Target marketing efforts for the Summer season well in advance (at least 65 days) to capture early planners.
- Monitor your own booking lead times against these Luqa averages to identify opportunities for dynamic pricing adjustments.
Popular & Essential Airbnb Amenities in Luqa (2026)
Amenity Prevalence
Amenity Insights for Luqa
- Essential amenities in Luqa that guests expect include: Air conditioning, Wifi. Lacking these (any) could significantly impact bookings.
- Popular amenities like Hot water, Hair dryer, Iron are common but not universal. Offering these can provide a competitive edge.
Recommendations for Hosts
- Ensure your listing includes all essential amenities for Luqa: Air conditioning, Wifi.
- Consider adding popular differentiators like Hot water or Hair dryer to increase appeal.
- Highlight unique or less common amenities you offer (e.g., hot tub, dedicated workspace, EV charger) in your listing description and photos.
- Regularly check competitor amenities in Luqa to stay competitive.
Luqa Airbnb Guest Demographics & Profile Analysis (2026)
Guest Profile Summary for Luqa
- The typical guest profile for Airbnb in Luqa consists of predominantly international visitors (96%), with top international origins including Germany, typically belonging to the Post-2000s (Gen Z/Alpha) group (50%), primarily speaking English or German.
- Domestic travelers account for 3.6% of guests.
- Key international markets include United Kingdom (16.7%) and Germany (13.8%).
- Top languages spoken are English (36.9%) followed by German (13.1%).
- A significant demographic segment is the Post-2000s (Gen Z/Alpha) group, representing 50% of guests.
Recommendations for Hosts
- Focus marketing internationally, particularly towards travelers from Germany.
- Tailor amenities and listing descriptions to appeal to the dominant Post-2000s (Gen Z/Alpha) demographic (e.g., highlight fast WiFi, smart home features, local guides).
- Highlight unique local experiences or amenities relevant to the primary guest profile.
- Consider seasonal promotions aligned with peak travel times for key origin markets.
Nearby Short-Term Rental Market Comparison
How does the Luqa Airbnb market stack up against its neighbors? Compare key performance metrics like average monthly revenue, ADR, and occupancy rates in surrounding areas to understand the broader regional STR landscape.
| Market | Active Properties | Monthly Revenue | Daily Rate | Avg. Occupancy |
|---|---|---|---|---|
| Mdina | 16 | $3,124 | $218.25 | 57% |
| Valletta | 604 | $2,598 | $187.70 | 53% |
| Mellieħa | 455 | $2,387 | $181.28 | 51% |
| Senglea | 106 | $2,216 | $142.33 | 60% |
| Żejtun | 44 | $2,210 | $189.49 | 45% |
| Birgu | 108 | $2,141 | $156.24 | 57% |
| Xgħajra | 14 | $2,132 | $162.45 | 46% |
| Żurrieq | 27 | $2,112 | $199.49 | 40% |
| Kalkara | 33 | $2,084 | $148.11 | 59% |
| Sliema | 1,326 | $2,070 | $170.23 | 51% |