Żabbar Airbnb Market Analysis 2026: Short Term Rental Data & Vacation Rental Statistics in South Eastern Region, Malta
Is Airbnb profitable in Żabbar in 2026? Explore comprehensive Airbnb analytics for Żabbar, South Eastern Region, Malta to uncover income potential. This 2026 STR market report for Żabbar, based on AirROI data from February 2025 to January 2026, reveals key trends in the niche market of 29 active listings.
Whether you're considering an Airbnb investment in Żabbar, optimizing your existing vacation rental, or exploring rental arbitrage opportunities, understanding the Żabbar Airbnb data is crucial. Leveraging the low regulation environment is key to maximizing your short term rental income potential. Let's dive into the specifics.
Key Żabbar Airbnb Performance Metrics Overview
Monthly Airbnb Revenue Variations & Income Potential in Żabbar (2026)
Understanding the monthly revenue variations for Airbnb listings in Żabbar is key to maximizing your short term rental income potential. Seasonality significantly impacts earnings. Our analysis, based on data from the past 12 months, shows that the peak revenue month for STRs in Żabbar is typically August, while February often presents the lowest earnings, highlighting opportunities for strategic pricing adjustments during shoulder and low seasons. Explore the typical Airbnb income in Żabbar across different performance tiers:
- Best-in-class properties (Top 10%) achieve $3,667+ monthly, often utilizing dynamic pricing and superior guest experiences.
- Strong performing properties (Top 25%) earn $2,647 or more, indicating effective management and desirable locations/amenities.
- Typical properties (Median) generate around $1,732 per month, representing the average market performance.
- Entry-level properties (Bottom 25%) see earnings around $969, often with potential for optimization.
Average Monthly Airbnb Earnings Trend in Żabbar
Żabbar Airbnb Occupancy Rate Trends (2026)
Maximize your bookings by understanding the Żabbar STR occupancy trends. Seasonal demand shifts significantly influence how often properties are booked. Typically, Augustsees the highest demand (peak season occupancy), while February experiences the lowest (low season). Effective strategies, like adjusting minimum stays or offering promotions, can boost occupancy during slower periods. Here's how different property tiers perform in Żabbar:
- Best-in-class properties (Top 10%) achieve 78%+ occupancy, indicating high desirability and potentially optimized availability.
- Strong performing properties (Top 25%) maintain 70% or higher occupancy, suggesting good market fit and guest satisfaction.
- Typical properties (Median) have an occupancy rate around 52%.
- Entry-level properties (Bottom 25%) average 33% occupancy, potentially facing higher vacancy.
Average Monthly Occupancy Rate Trend in Żabbar
Average Daily Rate (ADR) Airbnb Trends in Żabbar (2026)
Effective short term rental pricing strategy in Żabbar involves understanding monthly ADR fluctuations. The Average Daily Rate (ADR) for Airbnb in Żabbar typically peaks in July and dips lowest during March. Leveraging Airbnb dynamic pricing tools or strategies based on this seasonality can significantly boost revenue. Here's a look at the typical nightly rates achieved:
- Best-in-class properties (Top 10%) command rates of $174+ per night, often due to premium features or locations.
- Strong performing properties (Top 25%) achieve nightly rates of $134 or more.
- Typical properties (Median) charge around $97 per night.
- Entry-level properties (Bottom 25%) earn around $66 per night.
Average Daily Rate (ADR) Trend by Month in Żabbar
Get Live Żabbar Market Intelligence 👇

Explore Real-time Analytics
Airbnb Seasonality Analysis & Trends in Żabbar (2026)
Peak Season (August, July, October)
- Revenue averages $3,247 per month
- Occupancy rates average 67.5%
- Daily rates average $117
Shoulder Season
- Revenue averages $2,030 per month
- Occupancy maintains around 51.9%
- Daily rates hold near $108
Low Season (January, February, November)
- Revenue drops to average $1,043 per month
- Occupancy decreases to average 31.1%
- Daily rates adjust to average $102
Seasonality Insights for Żabbar
- The Airbnb seasonality in Żabbar shows highly seasonal trends requiring careful strategy. While the sections above show seasonal averages, it's also insightful to look at the extremes:
- During the high season, the absolute peak month showcases Żabbar's highest earning potential, with monthly revenues capable of climbing to $3,592, occupancy reaching a high of 78.6%, and ADRs peaking at $123.
- Conversely, the slowest single month of the year, typically falling within the low season, marks the market's lowest point. In this month, revenue might dip to $675, occupancy could drop to 27.4%, and ADRs may adjust down to $93.
- Understanding both the seasonal averages and these monthly peaks and troughs in revenue, occupancy, and ADR is crucial for maximizing your Airbnb profit potential in Żabbar.
Seasonal Strategies for Maximizing Profit
- Peak Season: Maximize revenue through premium pricing and potentially longer minimum stays. Ensure high availability.
- Low Season: Offer competitive pricing, special promotions (e.g., extended stay discounts), and flexible cancellation policies. Target off-season travelers like remote workers or budget-conscious guests.
- Shoulder Seasons: Implement dynamic pricing that balances peak and low rates. Target weekend travelers or specific events. Offer slightly more flexible terms than peak season.
- Regularly analyze your own performance against these Żabbar seasonality benchmarks and adjust your pricing and availability strategy accordingly.
Best Areas for Airbnb Investment in Żabbar (2026)
Exploring the top neighborhoods for short-term rentals in Żabbar? This section highlights key areas, outlining why they are attractive for hosts and guests, along with notable local attractions. Consider these locations based on your target guest profile and investment strategy.
| Neighborhood / Area | Why Host Here? (Target Guests & Appeal) | Key Attractions & Landmarks |
|---|---|---|
| Żabbar Town Center | The heart of Żabbar, with historical buildings and local shops. It's ideal for guests wanting to immerse themselves in local culture and history. | Żabbar Parish Church, The Chapel of Our Lady of Grace, Local markets, Old Town streets, Cafes and restaurants |
| Birżebbuġa Beach | Close to the beautiful Mediterranean coast, this area attracts beach lovers. Perfect for summer visitors looking for sun and fun. | Birżebbuġa Beach, Pretty Bay, St. George's Bay, Water sports rentals, Seaside promenade |
| L-Għar Dalam | Famous for its prehistoric cave and archaeological site, tourists interested in history will find this area fascinating. | Għar Dalam Cave, Prehistoric Museum, Nature walks, Local wildlife, Educational tours |
| Marsaxlokk Fisherman's Village | Known for its vibrant market and colorful fishing boats, this picturesque village is a hit with tourists and locals alike. | Marsaxlokk Market, The traditional fishing boats, Seafood restaurants, Harbour views, St. Peter's Pool |
| Cospicua (Bormla) | A historic fortified city that is rich in culture and architecture. Offers a glimpse into Malta's past. | Fort St. Angelo, Cospicua Waterfront, Local museums, Historical walking tours, Traditional Maltese architecture |
| Bormla (Birgu) | Another historic city known for its maritime history. It's charming and attracts visitors interested in culture and history. | Malta Maritime Museum, Vittoriosa Waterfront, Fort St. Angelo, Casa Orefice, Historical re-enactments |
| Smart City Malta | A modern project focused on technology and innovation. This attractive area offers a unique contrast to Malta's historic sites. | Smart City facilities, Co-working spaces, Restaurants and cafes, Events and festivals, Waterfront views |
| Senglea (Isla) | A scenic area with stunning views of the Grand Harbour, perfect for visitors who enjoy architecture and panoramic scenery. | Gardjola Gardens, Senglea Point, Historical fortifications, Harbour views, Local bars and eateries |
Understanding Airbnb License Requirements & STR Laws in Żabbar (2026)
While Żabbar, South Eastern Region, Malta currently shows low STR regulations, specific Airbnb license requirements might still exist or change. Always verify the latest short term rental regulations and Airbnb license requirements directly with local government authorities for Żabbar to ensure full compliance before hosting.
(Source: AirROI data, 2026, finding no licensed listings among those analyzed)
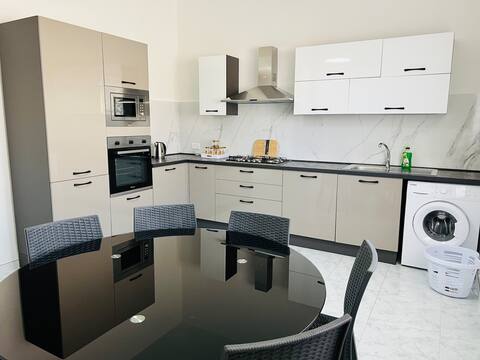
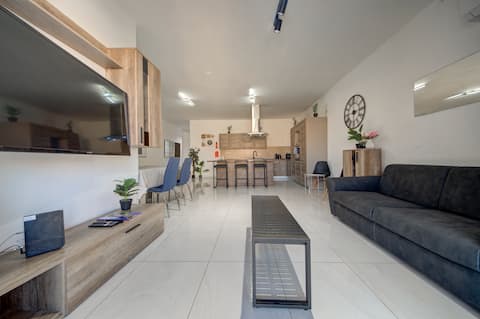
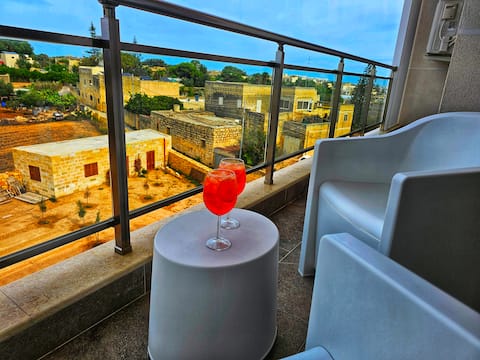
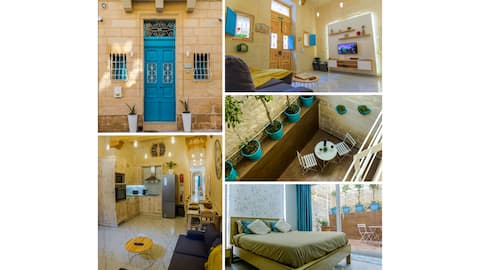
Top Performing Airbnb Properties in Żabbar (2026)
Benchmark your potential! Explore examples of top-performing Airbnb properties in Żabbarbased on Trailing Twelve Month (TTM) revenue. Analyze their characteristics, revenue, occupancy rate, and ADR to understand what drives success in this market.
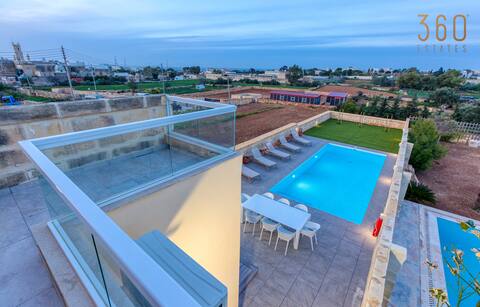
LUX Villa with Private Pool, BBQ & Rooftop Oasis
Entire Place • 4 bedrooms

Ta Drinu romantic character house
Entire Place • 1 bedroom
5 Bedroom spacious apartment
Entire Place • 5 bedrooms
Spacious 3BR home with Private Terrace & WIFI
Entire Place • 3 bedrooms
Country View Retreat
Entire Place • 1 bedroom
Cozy & Quiet 3 bedroom house - "Ta' Ġilard"
Entire Place • 3 bedrooms
Note: Performance varies based on location, size, amenities, seasonality, and management quality. Data reflects the past 12 months.
Top Performing Airbnb Hosts in Żabbar (2026)
Learn from the best! This table showcases top-performing Airbnb hosts in Żabbar based on the number of properties managed and estimated total revenue over the past year. Analyze their scale and performance metrics.
| Host Name | Properties | Grossing Revenue | Stay Reviews | Avg Rating |
|---|---|---|---|---|
| Matthew | 3 | $128,695 | 53 | 4.75/5.0 |
| Adrian | 1 | $50,558 | 168 | 4.88/5.0 |
| Edgar | 3 | $38,670 | 55 | 4.89/5.0 |
| Julia | 1 | $33,970 | 40 | 4.85/5.0 |
| Antoinette | 3 | $30,129 | 76 | 4.94/5.0 |
| Clint | 1 | $26,387 | 12 | 5.00/5.0 |
| Family Micallef | 1 | $24,229 | 84 | 4.99/5.0 |
| Stephen | 1 | $23,798 | 20 | 5.00/5.0 |
| Julian | 1 | $23,679 | 14 | 5.00/5.0 |
| Jesabel | 1 | $22,607 | 22 | 4.86/5.0 |
Analyzing the strategies of top hosts, such as their property selection, pricing, and guest communication, can offer valuable lessons for optimizing your own Airbnb operations in Żabbar.
Dive Deeper: Advanced Żabbar STR Market Data (2026)
Ready to unlock more insights? AirROI provides access to advanced metrics and comprehensive Airbnb data for Żabbar. Explore detailed analytics beyond this report to refine your investment strategy, optimize pricing, and maximize your vacation rental profits.
Explore Advanced MetricsŻabbar Short-Term Rental Market Composition (2026): Property & Room Types
Room Type Distribution
Property Type Distribution
Market Composition Insights for Żabbar
- The Żabbar Airbnb market composition is heavily skewed towards Entire Home/Apt listings, which make up 75.9% of the 29 active rentals. This indicates strong guest preference for privacy and space.
- Looking at the property type distribution in Żabbar, Apartment/Condo properties are the most common (69%), reflecting the local real estate landscape.
- Houses represent a significant 31% portion, catering likely to families or larger groups.
Żabbar Airbnb Room Capacity Analysis (2026): Bedroom Distribution
Distribution of Listings by Number of Bedrooms
Room Capacity Insights for Żabbar
- The dominant room capacity in Żabbar is 3 bedrooms listings, making up 34.5% of the market. This suggests a strong demand for properties suitable for families or small groups.
- Together, 3 bedrooms and 1 bedroom properties represent 62.1% of the active Airbnb listings in Żabbar, indicating a high concentration in these sizes.
- A significant 41.3% of listings offer 3+ bedrooms, catering to larger groups and families seeking more space in Żabbar.
Żabbar Vacation Rental Guest Capacity Trends (2026)
Distribution of Listings by Guest Capacity
Guest Capacity Insights for Żabbar
- The most common guest capacity trend in Żabbar vacation rentals is listings accommodating 2 guests (20.7%). This suggests the primary traveler segment is likely couples or solo travelers.
- Properties designed for 2 guests and 6 guests dominate the Żabbar STR market, accounting for 37.9% of listings.
- 27.5% of properties accommodate 6+ guests, serving the market segment for larger families or group travel in Żabbar.
- On average, properties in Żabbar are equipped to host 3.7 guests.
Żabbar Airbnb Booking Patterns (2026): Available vs. Booked Days
Available Days Distribution
Booked Days Distribution
Booking Pattern Insights for Żabbar
- The most common availability pattern in Żabbar falls within the 181-270 days range, representing 48.3% of listings. This suggests many properties have significant open periods on their calendars.
- Approximately 79.3% of listings show high availability (181+ days open annually), indicating potential for increased bookings or specific owner usage patterns.
- For booked days, the 91-180 days range is most frequent in Żabbar (37.9%), reflecting common guest stay durations or potential owner blocking patterns.
- A notable 31.0% of properties secure long booking periods (181+ days booked per year), highlighting successful long-term rental strategies or significant owner usage.
Żabbar Airbnb Minimum Stay Requirements Analysis
Distribution of Listings by Minimum Night Requirement
1 Night
2 listings
6.9% of total
2 Nights
4 listings
13.8% of total
3 Nights
10 listings
34.5% of total
4-6 Nights
2 listings
6.9% of total
7-29 Nights
2 listings
6.9% of total
30+ Nights
9 listings
31% of total
Key Insights
- The most prevalent minimum stay requirement in Żabbar is 3 Nights, adopted by 34.5% of listings. This highlights the market's preference for longer commitments.
- A significant segment (31%) caters to monthly stays (30+ nights) in Żabbar, pointing to opportunities in the extended-stay market.
Recommendations
- Align with the market by considering a 3 Nights minimum stay, as 34.5% of Żabbar hosts use this setting.
- If feasible, allowing 1-night stays, especially midweek or during low season, could capture last-minute bookings, as only 6.9% currently do.
- Explore offering discounts for stays of 30+ nights to attract the 31% of the market seeking extended stays.
- Adjust minimum nights based on seasonality – potentially shorter during low season and longer during peak demand periods in Żabbar.
Żabbar Airbnb Cancellation Policy Trends Analysis (2026)
Limited
2 listings
6.9% of total
Flexible
7 listings
24.1% of total
Moderate
8 listings
27.6% of total
Firm
9 listings
31% of total
Strict
3 listings
10.3% of total
Cancellation Policy Insights for Żabbar
- The prevailing Airbnb cancellation policy trend in Żabbar is Firm, used by 31% of listings.
- There's a relatively balanced mix between guest-friendly (51.7%) and stricter (41.3%) policies, offering choices for different guest needs.
Recommendations for Hosts
- Consider adopting a Firm policy to align with the 31% market standard in Żabbar.
- Using a Strict policy might deter some guests, as only 10.3% of listings use it. Evaluate if potential revenue protection outweighs possible lower booking rates.
- Regularly review your cancellation policy against competitors and market demand shifts in Żabbar.
Żabbar STR Booking Lead Time Analysis (2026)
Average Booking Lead Time by Month
Booking Lead Time Insights for Żabbar
- The overall average booking lead time for vacation rentals in Żabbar is 63 days.
- Guests book furthest in advance for stays during September (average 106 days), likely coinciding with peak travel demand or local events.
- The shortest booking windows occur for stays in December (average 29 days), indicating more last-minute travel plans during this time.
- Seasonally, Fall (87 days avg.) sees the longest lead times, while Winter (41 days avg.) has the shortest, reflecting typical travel planning cycles.
Recommendations for Hosts
- Use the overall average lead time (63 days) as a baseline for your pricing and availability strategy in Żabbar.
- For September stays, consider implementing length-of-stay discounts or slightly higher rates for bookings made less than 106 days out to capitalize on advance planning.
- Target marketing efforts for the Fall season well in advance (at least 87 days) to capture early planners.
- Monitor your own booking lead times against these Żabbar averages to identify opportunities for dynamic pricing adjustments.
Popular & Essential Airbnb Amenities in Żabbar (2026)
Amenity Prevalence
Amenity Insights for Żabbar
- Essential amenities in Żabbar that guests expect include: Wifi. Lacking these (this) could significantly impact bookings.
- Popular amenities like Kitchen, Air conditioning, Hot water are common but not universal. Offering these can provide a competitive edge.
Recommendations for Hosts
- Ensure your listing includes all essential amenities for Żabbar: Wifi.
- Consider adding popular differentiators like Kitchen or Air conditioning to increase appeal.
- Highlight unique or less common amenities you offer (e.g., hot tub, dedicated workspace, EV charger) in your listing description and photos.
- Regularly check competitor amenities in Żabbar to stay competitive.
Żabbar Airbnb Guest Demographics & Profile Analysis (2026)
Guest Profile Summary for Żabbar
- The typical guest profile for Airbnb in Żabbar consists of predominantly international visitors (100%), with top international origins including United Kingdom, typically belonging to the Post-2000s (Gen Z/Alpha) group (50%), primarily speaking English or French.
- Domestic travelers account for 0.0% of guests.
- Key international markets include France (28.7%) and United Kingdom (27.5%).
- Top languages spoken are English (48.3%) followed by French (22.4%).
- A significant demographic segment is the Post-2000s (Gen Z/Alpha) group, representing 50% of guests.
Recommendations for Hosts
- Focus marketing internationally, particularly towards travelers from United Kingdom.
- Tailor amenities and listing descriptions to appeal to the dominant Post-2000s (Gen Z/Alpha) demographic (e.g., highlight fast WiFi, smart home features, local guides).
- Highlight unique local experiences or amenities relevant to the primary guest profile.
- Consider seasonal promotions aligned with peak travel times for key origin markets.
Nearby Short-Term Rental Market Comparison
How does the Żabbar Airbnb market stack up against its neighbors? Compare key performance metrics like average monthly revenue, ADR, and occupancy rates in surrounding areas to understand the broader regional STR landscape.
| Market | Active Properties | Monthly Revenue | Daily Rate | Avg. Occupancy |
|---|---|---|---|---|
| Mdina | 16 | $3,124 | $218.25 | 57% |
| Valletta | 604 | $2,598 | $187.70 | 53% |
| Mellieħa | 455 | $2,387 | $181.28 | 51% |
| Senglea | 106 | $2,216 | $142.33 | 60% |
| Żejtun | 44 | $2,210 | $189.49 | 45% |
| Birgu | 108 | $2,141 | $156.24 | 57% |
| Xgħajra | 14 | $2,132 | $162.45 | 46% |
| Żurrieq | 27 | $2,112 | $199.49 | 40% |
| Kalkara | 33 | $2,084 | $148.11 | 59% |
| Sliema | 1,326 | $2,070 | $170.23 | 51% |