Valletta Airbnb Market Analysis 2026: Short Term Rental Data & Vacation Rental Statistics in South Eastern Region, Malta
Is Airbnb profitable in Valletta in 2026? Explore comprehensive Airbnb analytics for Valletta, South Eastern Region, Malta to uncover income potential. This 2026 STR market report for Valletta, based on AirROI data from February 2025 to January 2026, reveals key trends in the market of 604 active listings.
Whether you're considering an Airbnb investment in Valletta, optimizing your existing vacation rental, or exploring rental arbitrage opportunities, understanding the Valletta Airbnb data is crucial. Leveraging the low regulation environment is key to maximizing your short term rental income potential. Let's dive into the specifics.
Key Valletta Airbnb Performance Metrics Overview
Monthly Airbnb Revenue Variations & Income Potential in Valletta (2026)
Understanding the monthly revenue variations for Airbnb listings in Valletta is key to maximizing your short term rental income potential. Seasonality significantly impacts earnings. Our analysis, based on data from the past 12 months, shows that the peak revenue month for STRs in Valletta is typically August, while January often presents the lowest earnings, highlighting opportunities for strategic pricing adjustments during shoulder and low seasons. Explore the typical Airbnb income in Valletta across different performance tiers:
- Best-in-class properties (Top 10%) achieve $6,031+ monthly, often utilizing dynamic pricing and superior guest experiences.
- Strong performing properties (Top 25%) earn $4,230 or more, indicating effective management and desirable locations/amenities.
- Typical properties (Median) generate around $2,817 per month, representing the average market performance.
- Entry-level properties (Bottom 25%) see earnings around $1,705, often with potential for optimization.
Average Monthly Airbnb Earnings Trend in Valletta
Valletta Airbnb Occupancy Rate Trends (2026)
Maximize your bookings by understanding the Valletta STR occupancy trends. Seasonal demand shifts significantly influence how often properties are booked. Typically, Augustsees the highest demand (peak season occupancy), while January experiences the lowest (low season). Effective strategies, like adjusting minimum stays or offering promotions, can boost occupancy during slower periods. Here's how different property tiers perform in Valletta:
- Best-in-class properties (Top 10%) achieve 89%+ occupancy, indicating high desirability and potentially optimized availability.
- Strong performing properties (Top 25%) maintain 80% or higher occupancy, suggesting good market fit and guest satisfaction.
- Typical properties (Median) have an occupancy rate around 65%.
- Entry-level properties (Bottom 25%) average 40% occupancy, potentially facing higher vacancy.
Average Monthly Occupancy Rate Trend in Valletta
Average Daily Rate (ADR) Airbnb Trends in Valletta (2026)
Effective short term rental pricing strategy in Valletta involves understanding monthly ADR fluctuations. The Average Daily Rate (ADR) for Airbnb in Valletta typically peaks in August and dips lowest during February. Leveraging Airbnb dynamic pricing tools or strategies based on this seasonality can significantly boost revenue. Here's a look at the typical nightly rates achieved:
- Best-in-class properties (Top 10%) command rates of $302+ per night, often due to premium features or locations.
- Strong performing properties (Top 25%) achieve nightly rates of $215 or more.
- Typical properties (Median) charge around $156 per night.
- Entry-level properties (Bottom 25%) earn around $121 per night.
Average Daily Rate (ADR) Trend by Month in Valletta
Get Live Valletta Market Intelligence 👇

Explore Real-time Analytics
Airbnb Seasonality Analysis & Trends in Valletta (2026)
Peak Season (August, September, October)
- Revenue averages $4,462 per month
- Occupancy rates average 68.6%
- Daily rates average $209
Shoulder Season
- Revenue averages $3,504 per month
- Occupancy maintains around 61.9%
- Daily rates hold near $189
Low Season (January, February, December)
- Revenue drops to average $2,062 per month
- Occupancy decreases to average 41.1%
- Daily rates adjust to average $175
Seasonality Insights for Valletta
- The Airbnb seasonality in Valletta shows highly seasonal trends requiring careful strategy. While the sections above show seasonal averages, it's also insightful to look at the extremes:
- During the high season, the absolute peak month showcases Valletta's highest earning potential, with monthly revenues capable of climbing to $4,654, occupancy reaching a high of 70.3%, and ADRs peaking at $213.
- Conversely, the slowest single month of the year, typically falling within the low season, marks the market's lowest point. In this month, revenue might dip to $1,766, occupancy could drop to 32.5%, and ADRs may adjust down to $154.
- Understanding both the seasonal averages and these monthly peaks and troughs in revenue, occupancy, and ADR is crucial for maximizing your Airbnb profit potential in Valletta.
Seasonal Strategies for Maximizing Profit
- Peak Season: Maximize revenue through premium pricing and potentially longer minimum stays. Ensure high availability.
- Low Season: Offer competitive pricing, special promotions (e.g., extended stay discounts), and flexible cancellation policies. Target off-season travelers like remote workers or budget-conscious guests.
- Shoulder Seasons: Implement dynamic pricing that balances peak and low rates. Target weekend travelers or specific events. Offer slightly more flexible terms than peak season.
- Regularly analyze your own performance against these Valletta seasonality benchmarks and adjust your pricing and availability strategy accordingly.
Best Areas for Airbnb Investment in Valletta (2026)
Exploring the top neighborhoods for short-term rentals in Valletta? This section highlights key areas, outlining why they are attractive for hosts and guests, along with notable local attractions. Consider these locations based on your target guest profile and investment strategy.
| Neighborhood / Area | Why Host Here? (Target Guests & Appeal) | Key Attractions & Landmarks |
|---|---|---|
| Valletta Waterfront | A vibrant area filled with restaurants, cafes, and stunning views of the Grand Harbour. Ideal for tourists who want to enjoy dining and leisure activities. | Upper Barracca Gardens, National Museum of Archaeology, Fort St. Elmo, Barracca Lift, Valletta Market |
| St. John's Co-Cathedral | This area is home to an iconic Baroque cathedral and is a cultural hotspot, attracting history and art lovers. | St. John's Co-Cathedral, Malta 5D, National Museum of Fine Arts, Casa Rocca Piccola, The Strait Street |
| Lower Barracca Gardens | A peaceful garden area with beautiful views, perfect for visitors looking for relaxation amidst the city's historical sites. | Lower Barracca Gardens, The Siege Bell War Memorial, Malta Maritime Museum, Popeye Village, Valletta Exhibition |
| Merchant's Street | A bustling street featuring a variety of shops, eateries, and local markets, suitable for those wanting to experience the local culture. | Valletta Market, Shopping District, Food Market, St. Francis Church, Historical Buildings |
| Republic Street | The main pedestrian thoroughfare of Valletta lined with shops, cafes, and historical landmarks, ideal for tourists and locals alike. | Parliament House, Teatru Manoel, The National Library of Malta, Lascaris War Rooms, Paceville |
| Fort St. Elmo | This historic fort provides a unique view of the city and is rich in military history, attracting history enthusiasts. | Fort St. Elmo, National War Museum, The Mediterranean Conference Centre, Valletta Views, Dingli Cliffs |
| Auberge de Castille | The Auberge is an architectural marvel and a key administrative building, appealing to those interested in history and architecture. | Auberge de Castille, President's Palace, Republic Square, The City Gate, The Royal Opera House |
| The Three Cities | Though just outside Valletta, this area offers a glimpse into Malta's history, with ancient architecture and scenic harbor views, making it a great extension for visitors. | Birgu, Senglea, Cospicua, Fort St. Angelo, Maritime Museum |
Understanding Airbnb License Requirements & STR Laws in Valletta (2026)
While Valletta, South Eastern Region, Malta currently shows low STR regulations, specific Airbnb license requirements might still exist or change. Always verify the latest short term rental regulations and Airbnb license requirements directly with local government authorities for Valletta to ensure full compliance before hosting.
(Source: AirROI data, 2026, based on 0% licensed listings)
Top Performing Airbnb Properties in Valletta (2026)
Benchmark your potential! Explore examples of top-performing Airbnb properties in Vallettabased on Trailing Twelve Month (TTM) revenue. Analyze their characteristics, revenue, occupancy rate, and ADR to understand what drives success in this market.

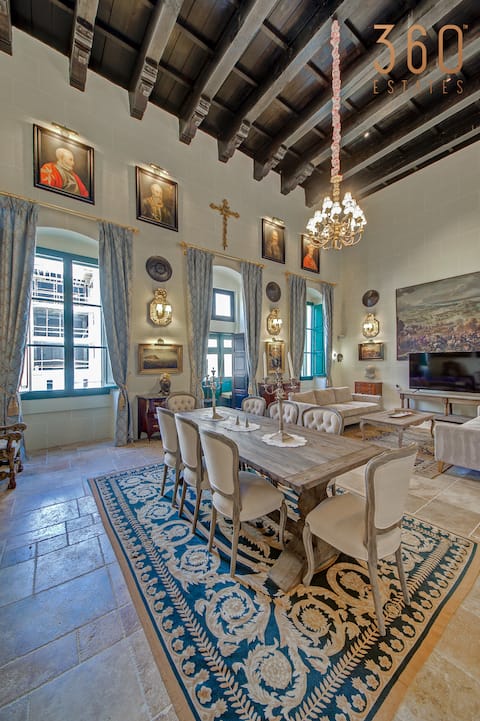
The Iconic Terrace in Valletta
Entire Place • 3 bedrooms
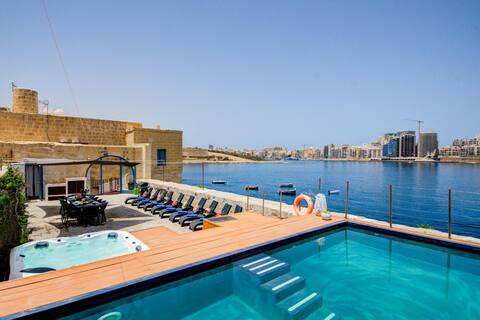
A luxurious Palazzo in Valetta with private Pool
Entire Place • 6 bedrooms

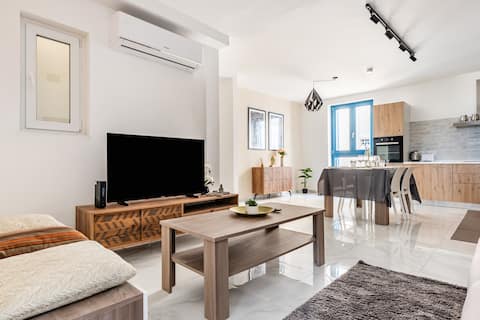
Penthouse with Jacuzzi & Panoramic Views Valletta
Entire Place • 2 bedrooms
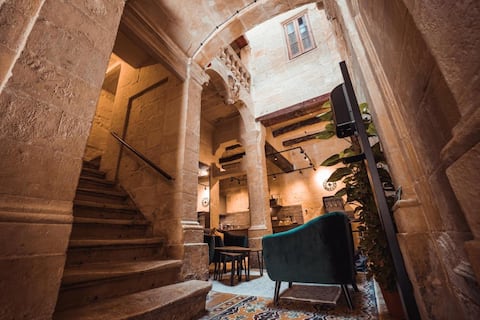
Enchanting Stone Villa with Pool and Jacuzzi
Entire Place • 4 bedrooms
Sea View Luxury Apartment Brand New in Valletta
Entire Place • 2 bedrooms
Palazzino Valentina – Your 1500s Palazzo + Jacuzzi
Entire Place • 4 bedrooms
Note: Performance varies based on location, size, amenities, seasonality, and management quality. Data reflects the past 12 months.
Top Performing Airbnb Hosts in Valletta (2026)
Learn from the best! This table showcases top-performing Airbnb hosts in Valletta based on the number of properties managed and estimated total revenue over the past year. Analyze their scale and performance metrics.
| Host Name | Properties | Grossing Revenue | Stay Reviews | Avg Rating |
|---|---|---|---|---|
| Matthew | 17 | $886,002 | 427 | 4.24/5.0 |
| Gwennoline | 19 | $709,663 | 775 | 4.60/5.0 |
| Shortletsmalta | 6 | $613,369 | 164 | 4.58/5.0 |
| Valletta Vintage | 10 | $554,674 | 1688 | 4.89/5.0 |
| Buena Vista Holidays Malta | 10 | $439,726 | 310 | 4.67/5.0 |
| Samuel Justin | 16 | $433,189 | 1415 | 4.78/5.0 |
| Oren | 3 | $430,130 | 17 | 5.00/5.0 |
| Christiano | 9 | $415,341 | 828 | 4.69/5.0 |
| Joseph Charles | 10 | $365,203 | 407 | 4.46/5.0 |
| Valletta | 13 | $352,184 | 505 | 4.47/5.0 |
Analyzing the strategies of top hosts, such as their property selection, pricing, and guest communication, can offer valuable lessons for optimizing your own Airbnb operations in Valletta.
Dive Deeper: Advanced Valletta STR Market Data (2026)
Ready to unlock more insights? AirROI provides access to advanced metrics and comprehensive Airbnb data for Valletta. Explore detailed analytics beyond this report to refine your investment strategy, optimize pricing, and maximize your vacation rental profits.
Explore Advanced MetricsValletta Short-Term Rental Market Composition (2026): Property & Room Types
Room Type Distribution
Property Type Distribution
Market Composition Insights for Valletta
- The Valletta Airbnb market composition is heavily skewed towards Entire Home/Apt listings, which make up 91.1% of the 604 active rentals. This indicates strong guest preference for privacy and space.
- Looking at the property type distribution in Valletta, Apartment/Condo properties are the most common (77.8%), reflecting the local real estate landscape.
- Houses represent a significant 15.9% portion, catering likely to families or larger groups.
- The presence of 5.5% Hotel/Boutique listings indicates integration with traditional hospitality.
- Smaller segments like others, unique stays (combined 0.9%) offer potential for unique stay experiences.
Valletta Airbnb Room Capacity Analysis (2026): Bedroom Distribution
Distribution of Listings by Number of Bedrooms
Room Capacity Insights for Valletta
- The dominant room capacity in Valletta is 1 bedroom listings, making up 62.7% of the market. This suggests a strong demand for properties suitable for couples or solo travelers.
- Together, 1 bedroom and 2 bedrooms properties represent 86.0% of the active Airbnb listings in Valletta, indicating a high concentration in these sizes.
- With over half the market (62.7%) consisting of studios or 1-bedroom units, Valletta is particularly well-suited for individuals or couples.
- Listings with 3+ bedrooms (7.1%) represent a smaller niche, potentially indicating an underserved market for larger group accommodations in Valletta.
Valletta Vacation Rental Guest Capacity Trends (2026)
Distribution of Listings by Guest Capacity
Guest Capacity Insights for Valletta
- The most common guest capacity trend in Valletta vacation rentals is listings accommodating 2 guests (44.4%). This suggests the primary traveler segment is likely couples or solo travelers.
- Properties designed for 2 guests and 4 guests dominate the Valletta STR market, accounting for 76.2% of listings.
- A significant 44.9% of listings cater specifically to 1-2 guests, highlighting strong demand from couples and solo travelers in Valletta.
- 10.9% of properties accommodate 6+ guests, serving the market segment for larger families or group travel in Valletta.
- On average, properties in Valletta are equipped to host 3.2 guests.
Valletta Airbnb Booking Patterns (2026): Available vs. Booked Days
Available Days Distribution
Booked Days Distribution
Booking Pattern Insights for Valletta
- The most common availability pattern in Valletta falls within the 271-366 days range, representing 31.6% of listings. This suggests many properties have significant open periods on their calendars.
- Approximately 52.3% of listings show high availability (181+ days open annually), indicating potential for increased bookings or specific owner usage patterns.
- For booked days, the 181-270 days range is most frequent in Valletta (29.8%), reflecting common guest stay durations or potential owner blocking patterns.
- A notable 48.8% of properties secure long booking periods (181+ days booked per year), highlighting successful long-term rental strategies or significant owner usage.
Valletta Airbnb Minimum Stay Requirements Analysis
Distribution of Listings by Minimum Night Requirement
1 Night
102 listings
16.9% of total
2 Nights
152 listings
25.2% of total
3 Nights
51 listings
8.4% of total
4-6 Nights
47 listings
7.8% of total
7-29 Nights
2 listings
0.3% of total
30+ Nights
250 listings
41.4% of total
Key Insights
- The most prevalent minimum stay requirement in Valletta is 30+ Nights, adopted by 41.4% of listings. This highlights the market's preference for longer commitments.
- A significant segment (41.4%) caters to monthly stays (30+ nights) in Valletta, pointing to opportunities in the extended-stay market.
Recommendations
- Align with the market by considering a 30+ Nights minimum stay, as 41.4% of Valletta hosts use this setting.
- If feasible, allowing 1-night stays, especially midweek or during low season, could capture last-minute bookings, as only 16.9% currently do.
- Explore offering discounts for stays of 30+ nights to attract the 41.4% of the market seeking extended stays.
- Adjust minimum nights based on seasonality – potentially shorter during low season and longer during peak demand periods in Valletta.
Valletta Airbnb Cancellation Policy Trends Analysis (2026)
Limited
46 listings
7.7% of total
Super Strict 30 Days
5 listings
0.8% of total
Super Strict 60 Days
10 listings
1.7% of total
Flexible
119 listings
19.8% of total
Moderate
101 listings
16.8% of total
Firm
244 listings
40.6% of total
Strict
76 listings
12.6% of total
Cancellation Policy Insights for Valletta
- The prevailing Airbnb cancellation policy trend in Valletta is Firm, used by 40.6% of listings.
- A majority (53.2%) of hosts in Valletta utilize Firm or Strict policies, indicating a market where hosts prioritize booking security.
Recommendations for Hosts
- Consider adopting a Firm policy to align with the 40.6% market standard in Valletta.
- Using a Strict policy might deter some guests, as only 12.6% of listings use it. Evaluate if potential revenue protection outweighs possible lower booking rates.
- Regularly review your cancellation policy against competitors and market demand shifts in Valletta.
Valletta STR Booking Lead Time Analysis (2026)
Average Booking Lead Time by Month
Booking Lead Time Insights for Valletta
- The overall average booking lead time for vacation rentals in Valletta is 66 days.
- Guests book furthest in advance for stays during September (average 92 days), likely coinciding with peak travel demand or local events.
- The shortest booking windows occur for stays in February (average 47 days), indicating more last-minute travel plans during this time.
- Seasonally, Fall (77 days avg.) sees the longest lead times, while Winter (54 days avg.) has the shortest, reflecting typical travel planning cycles.
Recommendations for Hosts
- Use the overall average lead time (66 days) as a baseline for your pricing and availability strategy in Valletta.
- For September stays, consider implementing length-of-stay discounts or slightly higher rates for bookings made less than 92 days out to capitalize on advance planning.
- Target marketing efforts for the Fall season well in advance (at least 77 days) to capture early planners.
- Monitor your own booking lead times against these Valletta averages to identify opportunities for dynamic pricing adjustments.
Popular & Essential Airbnb Amenities in Valletta (2026)
Amenity Prevalence
Amenity Insights for Valletta
- Essential amenities in Valletta that guests expect include: Wifi. Lacking these (this) could significantly impact bookings.
- Popular amenities like Air conditioning, Kitchen, TV are common but not universal. Offering these can provide a competitive edge.
Recommendations for Hosts
- Ensure your listing includes all essential amenities for Valletta: Wifi.
- Prioritize adding missing essentials: Wifi.
- Consider adding popular differentiators like Air conditioning or Kitchen to increase appeal.
- Highlight unique or less common amenities you offer (e.g., hot tub, dedicated workspace, EV charger) in your listing description and photos.
- Regularly check competitor amenities in Valletta to stay competitive.
Valletta Airbnb Guest Demographics & Profile Analysis (2026)
Guest Profile Summary for Valletta
- The typical guest profile for Airbnb in Valletta consists of predominantly international visitors (100%), with top international origins including United States, typically belonging to the Post-2000s (Gen Z/Alpha) group (50%), primarily speaking English or French.
- Domestic travelers account for 0.3% of guests.
- Key international markets include United Kingdom (35.1%) and United States (15.6%).
- Top languages spoken are English (48.8%) followed by French (10.4%).
- A significant demographic segment is the Post-2000s (Gen Z/Alpha) group, representing 50% of guests.
Recommendations for Hosts
- Focus marketing internationally, particularly towards travelers from United States.
- Tailor amenities and listing descriptions to appeal to the dominant Post-2000s (Gen Z/Alpha) demographic (e.g., highlight fast WiFi, smart home features, local guides).
- Highlight unique local experiences or amenities relevant to the primary guest profile.
- Consider seasonal promotions aligned with peak travel times for key origin markets.
Nearby Short-Term Rental Market Comparison
How does the Valletta Airbnb market stack up against its neighbors? Compare key performance metrics like average monthly revenue, ADR, and occupancy rates in surrounding areas to understand the broader regional STR landscape.
| Market | Active Properties | Monthly Revenue | Daily Rate | Avg. Occupancy |
|---|---|---|---|---|
| Mdina | 16 | $3,124 | $218.25 | 57% |
| Mellieħa | 455 | $2,387 | $181.28 | 51% |
| Senglea | 106 | $2,216 | $142.33 | 60% |
| Żejtun | 44 | $2,210 | $189.49 | 45% |
| Birgu | 108 | $2,141 | $156.24 | 57% |
| Xgħajra | 14 | $2,132 | $162.45 | 46% |
| Żurrieq | 27 | $2,112 | $199.49 | 40% |
| Kalkara | 33 | $2,084 | $148.11 | 59% |
| Sliema | 1,326 | $2,070 | $170.23 | 51% |
| Floriana | 139 | $2,063 | $141.72 | 57% |