Paola Airbnb Market Analysis 2025: Short Term Rental Data & Vacation Rental Statistics in South Eastern Region, Malta
Is Airbnb profitable in Paola in 2025? Explore comprehensive Airbnb analytics for Paola, South Eastern Region, Malta to uncover income potential. This 2025 STR market report for Paola, based on AirROI data from September 2024 to August 2025, reveals key trends in the niche market of 21 active listings.
Whether you're considering an Airbnb investment in Paola, optimizing your existing vacation rental, or exploring rental arbitrage opportunities, understanding the Paola Airbnb data is crucial. Leveraging the low regulation environment is key to maximizing your short term rental income potential. Let's dive into the specifics.
Key Paola Airbnb Performance Metrics Overview
Monthly Airbnb Revenue Variations & Income Potential in Paola (2025)
Understanding the monthly revenue variations for Airbnb listings in Paola is key to maximizing your short term rental income potential. Seasonality significantly impacts earnings. Our analysis, based on data from the past 12 months, shows that the peak revenue month for STRs in Paola is typically July, while February often presents the lowest earnings, highlighting opportunities for strategic pricing adjustments during shoulder and low seasons. Explore the typical Airbnb income in Paola across different performance tiers:
- Best-in-class properties (Top 10%) achieve $3,293+ monthly, often utilizing dynamic pricing and superior guest experiences.
- Strong performing properties (Top 25%) earn $2,361 or more, indicating effective management and desirable locations/amenities.
- Typical properties (Median) generate around $1,431 per month, representing the average market performance.
- Entry-level properties (Bottom 25%) see earnings around $712, often with potential for optimization.
Average Monthly Airbnb Earnings Trend in Paola
Paola Airbnb Occupancy Rate Trends (2025)
Maximize your bookings by understanding the Paola STR occupancy trends. Seasonal demand shifts significantly influence how often properties are booked. Typically, Julysees the highest demand (peak season occupancy), while December experiences the lowest (low season). Effective strategies, like adjusting minimum stays or offering promotions, can boost occupancy during slower periods. Here's how different property tiers perform in Paola:
- Best-in-class properties (Top 10%) achieve 82%+ occupancy, indicating high desirability and potentially optimized availability.
- Strong performing properties (Top 25%) maintain 66% or higher occupancy, suggesting good market fit and guest satisfaction.
- Typical properties (Median) have an occupancy rate around 45%.
- Entry-level properties (Bottom 25%) average 22% occupancy, potentially facing higher vacancy.
Average Monthly Occupancy Rate Trend in Paola
Average Daily Rate (ADR) Airbnb Trends in Paola (2025)
Effective short term rental pricing strategy in Paola involves understanding monthly ADR fluctuations. The Average Daily Rate (ADR) for Airbnb in Paola typically peaks in August and dips lowest during February. Leveraging Airbnb dynamic pricing tools or strategies based on this seasonality can significantly boost revenue. Here's a look at the typical nightly rates achieved:
- Best-in-class properties (Top 10%) command rates of $186+ per night, often due to premium features or locations.
- Strong performing properties (Top 25%) achieve nightly rates of $113 or more.
- Typical properties (Median) charge around $85 per night.
- Entry-level properties (Bottom 25%) earn around $69 per night.
Average Daily Rate (ADR) Trend by Month in Paola
Get Live Paola Market Intelligence 👇

Explore Real-time Analytics
Airbnb Seasonality Analysis & Trends in Paola (2025)
Peak Season (July, June, May)
- Revenue averages $2,535 per month
- Occupancy rates average 59.9%
- Daily rates average $131
Shoulder Season
- Revenue averages $1,653 per month
- Occupancy maintains around 46.8%
- Daily rates hold near $102
Low Season (February, November, December)
- Revenue drops to average $885 per month
- Occupancy decreases to average 29.7%
- Daily rates adjust to average $90
Seasonality Insights for Paola
- The Airbnb seasonality in Paola shows highly seasonal trends requiring careful strategy. While the sections above show seasonal averages, it's also insightful to look at the extremes:
- During the high season, the absolute peak month showcases Paola's highest earning potential, with monthly revenues capable of climbing to $2,917, occupancy reaching a high of 65.9%, and ADRs peaking at $138.
- Conversely, the slowest single month of the year, typically falling within the low season, marks the market's lowest point. In this month, revenue might dip to $768, occupancy could drop to 27.4%, and ADRs may adjust down to $88.
- Understanding both the seasonal averages and these monthly peaks and troughs in revenue, occupancy, and ADR is crucial for maximizing your Airbnb profit potential in Paola.
Seasonal Strategies for Maximizing Profit
- Peak Season: Maximize revenue through premium pricing and potentially longer minimum stays. Ensure high availability.
- Low Season: Offer competitive pricing, special promotions (e.g., extended stay discounts), and flexible cancellation policies. Target off-season travelers like remote workers or budget-conscious guests.
- Shoulder Seasons: Implement dynamic pricing that balances peak and low rates. Target weekend travelers or specific events. Offer slightly more flexible terms than peak season.
- Regularly analyze your own performance against these Paola seasonality benchmarks and adjust your pricing and availability strategy accordingly.
Best Areas for Airbnb Investment in Paola (2025)
Exploring the top neighborhoods for short-term rentals in Paola? This section highlights key areas, outlining why they are attractive for hosts and guests, along with notable local attractions. Consider these locations based on your target guest profile and investment strategy.
| Neighborhood / Area | Why Host Here? (Target Guests & Appeal) | Key Attractions & Landmarks |
|---|---|---|
| Paola Town Centre | The heart of Paola, with numerous shops, restaurants, and local markets. It attracts visitors looking for cultural experiences and local cuisine. | Saint Ubaldesca Chapel, Paola Parish Church, Malta Maritime Museum, Kordin Temples, local markets |
| Wignacourt Tower Area | An area rich in history with significant landmarks, ideal for tourists interested in Malta's heritage. The beautiful tower offers stunning views and historical insights. | Wignacourt Tower, Discover Malta's past, beautiful coastal views, Nearby beaches, Historical parks |
| Bormla (Cospicua) | A neighboring town with charming streets and a rich maritime history, attracting both history buffs and those looking for a quiet, picturesque area. | Cospicua waterfront, Fortifications of Valletta, local seafood restaurants, Scenic harbor views, Traditional feasts |
| Birgu (Vittoriosa) | A historic city with rich heritage, popular among tourists and locals alike. Known for its beautiful architecture and vibrant atmosphere. | Fort St. Angelo, Birgu waterfront, Malta Maritime Museum, town festivals, Historic buildings |
| Kordin | A quiet residential area with access to historical sites and close proximity to the Grand Harbour, perfect for relaxing stays away from the noise of the tourist hotspots. | Hypogeum of Ħal-Saflieni, Grand Harbour views, Historical architecture, Local cafes, Scenic walks |
| Balluta Bay | Within reach of Paola, this bay area is known for its beautiful surroundings and amenities, attracting visitors for its relaxed atmosphere. | Balluta Bay beach, Water sports, Promenade walks, Local dining options, Coastal views |
| Zabbar | Rich in history and culture, Zabbar is increasingly popular for its local charm and proximity to Paola, offering a unique Maltese experience. | Zabbar Sanctuary, Beautiful churches, Local festivals, Traditional crafts, Welcoming community atmosphere |
| Tarxien | Famous for its prehistoric temples, Tarxien attracts tourists interested in archaeology and ancient history, providing unique lodging opportunities. | Tarxien Temples, Historical sites, Local artisan shops, Cultural events, Quiet residential areas |
Understanding Airbnb License Requirements & STR Laws in Paola (2025)
While Paola, South Eastern Region, Malta currently shows low STR regulations, specific Airbnb license requirements might still exist or change. Always verify the latest short term rental regulations and Airbnb license requirements directly with local government authorities for Paola to ensure full compliance before hosting.
(Source: AirROI data, 2025, based on 5% licensed listings)
Top Performing Airbnb Properties in Paola (2025)
Benchmark your potential! Explore examples of top-performing Airbnb properties in Paolabased on Trailing Twelve Month (TTM) revenue. Analyze their characteristics, revenue, occupancy rate, and ADR to understand what drives success in this market.
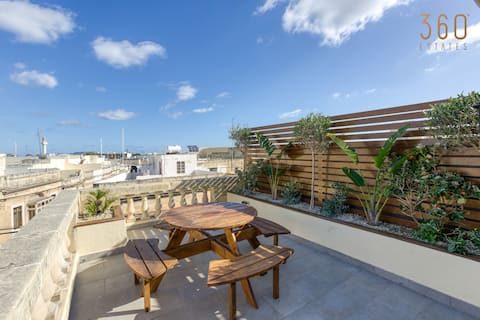
Stunning 3BR Townhouse with Private Rooftop Access
Entire Place • 3 bedrooms

Cosy Cupid's Hideout: Hot Tub - BBQ, 4km Airport
Entire Place • 1 bedroom
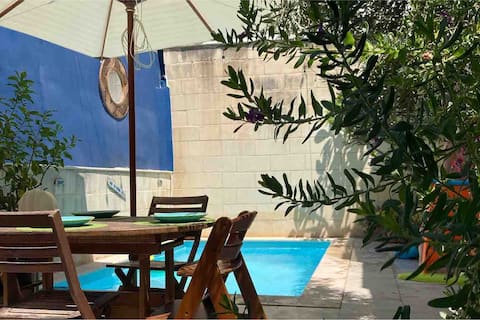
Charming House of Character with Heated Pool
Entire Place • 2 bedrooms
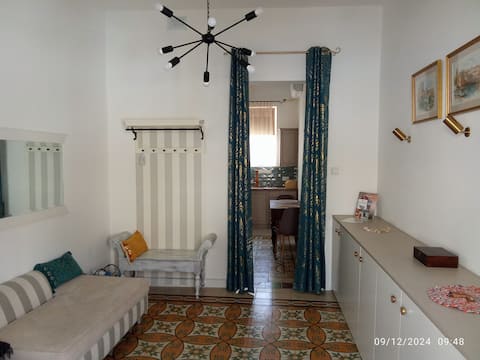
Townhouse in Paola
Entire Place • 2 bedrooms
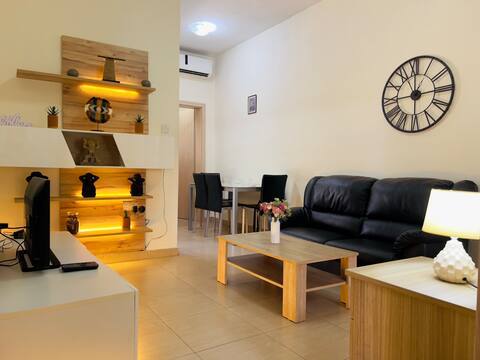
Cozy Apartment in South Part Malta
Entire Place • 3 bedrooms

2 Bedroom Maisonette in Paola
Entire Place • 2 bedrooms
Note: Performance varies based on location, size, amenities, seasonality, and management quality. Data reflects the past 12 months.
Top Performing Airbnb Hosts in Paola (2025)
Learn from the best! This table showcases top-performing Airbnb hosts in Paola based on the number of properties managed and estimated total revenue over the past year. Analyze their scale and performance metrics.
| Host Name | Properties | Grossing Revenue | Stay Reviews | Avg Rating |
|---|---|---|---|---|
| Matthew | 1 | $47,404 | 28 | 4.79/5.0 |
| Nicholas | 1 | $33,468 | 49 | 4.92/5.0 |
| Jean Paul | 1 | $32,248 | 130 | 4.89/5.0 |
| Carl & Eliza | 2 | $22,204 | 111 | 4.82/5.0 |
| Vilhelmina | 1 | $20,699 | 71 | 4.93/5.0 |
| Christian | 1 | $18,454 | 16 | 4.63/5.0 |
| Kurt | 1 | $16,975 | 15 | 4.67/5.0 |
| Conrad | 1 | $16,695 | 120 | 4.55/5.0 |
| Brandon | 2 | $8,760 | 189 | 4.77/5.0 |
| Host #12017466 | 2 | $8,551 | 74 | 4.98/5.0 |
Analyzing the strategies of top hosts, such as their property selection, pricing, and guest communication, can offer valuable lessons for optimizing your own Airbnb operations in Paola.
Dive Deeper: Advanced Paola STR Market Data (2025)
Ready to unlock more insights? AirROI provides access to advanced metrics and comprehensive Airbnb data for Paola. Explore detailed analytics beyond this report to refine your investment strategy, optimize pricing, and maximize your vacation rental profits.
Explore Advanced MetricsPaola Short-Term Rental Market Composition (2025): Property & Room Types
Room Type Distribution
Property Type Distribution
Market Composition Insights for Paola
- The Paola Airbnb market composition is heavily skewed towards Entire Home/Apt listings, which make up 85.7% of the 21 active rentals. This indicates strong guest preference for privacy and space.
- Looking at the property type distribution in Paola, Apartment/Condo properties are the most common (47.6%), reflecting the local real estate landscape.
- Houses represent a significant 47.6% portion, catering likely to families or larger groups.
- Smaller segments like others (combined 4.8%) offer potential for unique stay experiences.
Paola Airbnb Room Capacity Analysis (2025): Bedroom Distribution
Distribution of Listings by Number of Bedrooms
Room Capacity Insights for Paola
- The dominant room capacity in Paola is 1 bedroom listings, making up 52.4% of the market. This suggests a strong demand for properties suitable for couples or solo travelers.
- Together, 1 bedroom and 2 bedrooms properties represent 76.2% of the active Airbnb listings in Paola, indicating a high concentration in these sizes.
- With over half the market (52.4%) consisting of studios or 1-bedroom units, Paola is particularly well-suited for individuals or couples.
Paola Vacation Rental Guest Capacity Trends (2025)
Distribution of Listings by Guest Capacity
Guest Capacity Insights for Paola
- The most common guest capacity trend in Paola vacation rentals is listings accommodating 2 guests (33.3%). This suggests the primary traveler segment is likely couples or solo travelers.
- Properties designed for 2 guests and 3 guests dominate the Paola STR market, accounting for 52.3% of listings.
- 14.3% of properties accommodate 6+ guests, serving the market segment for larger families or group travel in Paola.
- On average, properties in Paola are equipped to host 3.3 guests.
Paola Airbnb Booking Patterns (2025): Available vs. Booked Days
Available Days Distribution
Booked Days Distribution
Booking Pattern Insights for Paola
- The most common availability pattern in Paola falls within the 271-366 days range, representing 61.9% of listings. This suggests many properties have significant open periods on their calendars.
- Approximately 80.9% of listings show high availability (181+ days open annually), indicating potential for increased bookings or specific owner usage patterns.
- For booked days, the 31-90 days range is most frequent in Paola (38.1%), reflecting common guest stay durations or potential owner blocking patterns.
- A notable 19.0% of properties secure long booking periods (181+ days booked per year), highlighting successful long-term rental strategies or significant owner usage.
Paola Airbnb Minimum Stay Requirements Analysis
Distribution of Listings by Minimum Night Requirement
1 Night
4 listings
20% of total
2 Nights
3 listings
15% of total
3 Nights
6 listings
30% of total
4-6 Nights
3 listings
15% of total
30+ Nights
4 listings
20% of total
Key Insights
- The most prevalent minimum stay requirement in Paola is 3 Nights, adopted by 30% of listings. This highlights the market's preference for longer commitments.
- A significant segment (20%) caters to monthly stays (30+ nights) in Paola, pointing to opportunities in the extended-stay market.
Recommendations
- Align with the market by considering a 3 Nights minimum stay, as 30% of Paola hosts use this setting.
- If feasible, allowing 1-night stays, especially midweek or during low season, could capture last-minute bookings, as only 20% currently do.
- Explore offering discounts for stays of 30+ nights to attract the 20% of the market seeking extended stays.
- Adjust minimum nights based on seasonality – potentially shorter during low season and longer during peak demand periods in Paola.
Paola Airbnb Cancellation Policy Trends Analysis (2025)
Flexible
8 listings
42.1% of total
Moderate
2 listings
10.5% of total
Firm
7 listings
36.8% of total
Strict
2 listings
10.5% of total
Cancellation Policy Insights for Paola
- The prevailing Airbnb cancellation policy trend in Paola is Flexible, used by 42.1% of listings.
- There's a relatively balanced mix between guest-friendly (52.6%) and stricter (47.3%) policies, offering choices for different guest needs.
Recommendations for Hosts
- Consider adopting a Flexible policy to align with the 42.1% market standard in Paola.
- Using a Strict policy might deter some guests, as only 10.5% of listings use it. Evaluate if potential revenue protection outweighs possible lower booking rates.
- Regularly review your cancellation policy against competitors and market demand shifts in Paola.
Paola STR Booking Lead Time Analysis (2025)
Average Booking Lead Time by Month
Booking Lead Time Insights for Paola
- The overall average booking lead time for vacation rentals in Paola is 67 days.
- Guests book furthest in advance for stays during August (average 111 days), likely coinciding with peak travel demand or local events.
- The shortest booking windows occur for stays in January (average 32 days), indicating more last-minute travel plans during this time.
- Seasonally, Summer (93 days avg.) sees the longest lead times, while Winter (46 days avg.) has the shortest, reflecting typical travel planning cycles.
Recommendations for Hosts
- Use the overall average lead time (67 days) as a baseline for your pricing and availability strategy in Paola.
- For August stays, consider implementing length-of-stay discounts or slightly higher rates for bookings made less than 111 days out to capitalize on advance planning.
- Target marketing efforts for the Summer season well in advance (at least 93 days) to capture early planners.
- Monitor your own booking lead times against these Paola averages to identify opportunities for dynamic pricing adjustments.
Popular & Essential Airbnb Amenities in Paola (2025)
Amenity Prevalence
Amenity Insights for Paola
- Essential amenities in Paola that guests expect include: Wifi, Air conditioning, Kitchen. Lacking these (any) could significantly impact bookings.
- Popular amenities like Hangers, Washer, Heating are common but not universal. Offering these can provide a competitive edge.
Recommendations for Hosts
- Ensure your listing includes all essential amenities for Paola: Wifi, Air conditioning, Kitchen.
- Prioritize adding missing essentials: Kitchen.
- Consider adding popular differentiators like Hangers or Washer to increase appeal.
- Highlight unique or less common amenities you offer (e.g., hot tub, dedicated workspace, EV charger) in your listing description and photos.
- Regularly check competitor amenities in Paola to stay competitive.
Paola Airbnb Guest Demographics & Profile Analysis (2025)
Guest Profile Summary for Paola
- The typical guest profile for Airbnb in Paola consists of predominantly international visitors (98%), with top international origins including United Kingdom, typically belonging to the Post-2000s (Gen Z/Alpha) group (50%), primarily speaking English or French.
- Domestic travelers account for 2.4% of guests.
- Key international markets include France (26.8%) and United Kingdom (13.4%).
- Top languages spoken are English (41.4%) followed by French (14.8%).
- A significant demographic segment is the Post-2000s (Gen Z/Alpha) group, representing 50% of guests.
Recommendations for Hosts
- Focus marketing internationally, particularly towards travelers from United Kingdom.
- Tailor amenities and listing descriptions to appeal to the dominant Post-2000s (Gen Z/Alpha) demographic (e.g., highlight fast WiFi, smart home features, local guides).
- Highlight unique local experiences or amenities relevant to the primary guest profile.
- Consider seasonal promotions aligned with peak travel times for key origin markets.
Nearby Short-Term Rental Market Comparison
How does the Paola Airbnb market stack up against its neighbors? Compare key performance metrics like average monthly revenue, ADR, and occupancy rates in surrounding areas to understand the broader regional STR landscape.
| Market | Active Properties | Monthly Revenue | Daily Rate | Avg. Occupancy |
|---|---|---|---|---|
| Mdina | 16 | $3,111 | $199.54 | 54% |
| Valletta | 593 | $2,325 | $177.73 | 52% |
| Attard | 15 | $2,180 | $348.84 | 49% |
| Mellieħa | 422 | $2,088 | $173.81 | 48% |
| Żejtun | 41 | $2,010 | $194.16 | 42% |
| Senglea | 101 | $1,982 | $132.50 | 57% |
| Sliema | 1,140 | $1,968 | $162.07 | 51% |
| Kalkara | 34 | $1,957 | $140.92 | 57% |
| Għasri | 63 | $1,923 | $225.04 | 36% |
| Birgu | 104 | $1,860 | $148.19 | 54% |