Kalkara Airbnb Market Analysis 2026: Short Term Rental Data & Vacation Rental Statistics in South Eastern Region, Malta
Is Airbnb profitable in Kalkara in 2026? Explore comprehensive Airbnb analytics for Kalkara, South Eastern Region, Malta to uncover income potential. This 2026 STR market report for Kalkara, based on AirROI data from February 2025 to January 2026, reveals key trends in the niche market of 33 active listings.
Whether you're considering an Airbnb investment in Kalkara, optimizing your existing vacation rental, or exploring rental arbitrage opportunities, understanding the Kalkara Airbnb data is crucial. Leveraging the low regulation environment is key to maximizing your short term rental income potential. Let's dive into the specifics.
Key Kalkara Airbnb Performance Metrics Overview
Monthly Airbnb Revenue Variations & Income Potential in Kalkara (2026)
Understanding the monthly revenue variations for Airbnb listings in Kalkara is key to maximizing your short term rental income potential. Seasonality significantly impacts earnings. Our analysis, based on data from the past 12 months, shows that the peak revenue month for STRs in Kalkara is typically August, while January often presents the lowest earnings, highlighting opportunities for strategic pricing adjustments during shoulder and low seasons. Explore the typical Airbnb income in Kalkara across different performance tiers:
- Best-in-class properties (Top 10%) achieve $5,268+ monthly, often utilizing dynamic pricing and superior guest experiences.
- Strong performing properties (Top 25%) earn $3,882 or more, indicating effective management and desirable locations/amenities.
- Typical properties (Median) generate around $2,552 per month, representing the average market performance.
- Entry-level properties (Bottom 25%) see earnings around $1,661, often with potential for optimization.
Average Monthly Airbnb Earnings Trend in Kalkara
Kalkara Airbnb Occupancy Rate Trends (2026)
Maximize your bookings by understanding the Kalkara STR occupancy trends. Seasonal demand shifts significantly influence how often properties are booked. Typically, Augustsees the highest demand (peak season occupancy), while January experiences the lowest (low season). Effective strategies, like adjusting minimum stays or offering promotions, can boost occupancy during slower periods. Here's how different property tiers perform in Kalkara:
- Best-in-class properties (Top 10%) achieve 90%+ occupancy, indicating high desirability and potentially optimized availability.
- Strong performing properties (Top 25%) maintain 79% or higher occupancy, suggesting good market fit and guest satisfaction.
- Typical properties (Median) have an occupancy rate around 63%.
- Entry-level properties (Bottom 25%) average 45% occupancy, potentially facing higher vacancy.
Average Monthly Occupancy Rate Trend in Kalkara
Average Daily Rate (ADR) Airbnb Trends in Kalkara (2026)
Effective short term rental pricing strategy in Kalkara involves understanding monthly ADR fluctuations. The Average Daily Rate (ADR) for Airbnb in Kalkara typically peaks in August and dips lowest during March. Leveraging Airbnb dynamic pricing tools or strategies based on this seasonality can significantly boost revenue. Here's a look at the typical nightly rates achieved:
- Best-in-class properties (Top 10%) command rates of $220+ per night, often due to premium features or locations.
- Strong performing properties (Top 25%) achieve nightly rates of $175 or more.
- Typical properties (Median) charge around $128 per night.
- Entry-level properties (Bottom 25%) earn around $91 per night.
Average Daily Rate (ADR) Trend by Month in Kalkara
Get Live Kalkara Market Intelligence 👇

Explore Real-time Analytics
Airbnb Seasonality Analysis & Trends in Kalkara (2026)
Peak Season (August, July, September)
- Revenue averages $4,245 per month
- Occupancy rates average 74.0%
- Daily rates average $165
Shoulder Season
- Revenue averages $2,844 per month
- Occupancy maintains around 63.2%
- Daily rates hold near $132
Low Season (January, February, December)
- Revenue drops to average $1,555 per month
- Occupancy decreases to average 40.8%
- Daily rates adjust to average $132
Seasonality Insights for Kalkara
- The Airbnb seasonality in Kalkara shows highly seasonal trends requiring careful strategy. While the sections above show seasonal averages, it's also insightful to look at the extremes:
- During the high season, the absolute peak month showcases Kalkara's highest earning potential, with monthly revenues capable of climbing to $4,641, occupancy reaching a high of 76.9%, and ADRs peaking at $167.
- Conversely, the slowest single month of the year, typically falling within the low season, marks the market's lowest point. In this month, revenue might dip to $1,323, occupancy could drop to 29.0%, and ADRs may adjust down to $109.
- Understanding both the seasonal averages and these monthly peaks and troughs in revenue, occupancy, and ADR is crucial for maximizing your Airbnb profit potential in Kalkara.
Seasonal Strategies for Maximizing Profit
- Peak Season: Maximize revenue through premium pricing and potentially longer minimum stays. Ensure high availability.
- Low Season: Offer competitive pricing, special promotions (e.g., extended stay discounts), and flexible cancellation policies. Target off-season travelers like remote workers or budget-conscious guests.
- Shoulder Seasons: Implement dynamic pricing that balances peak and low rates. Target weekend travelers or specific events. Offer slightly more flexible terms than peak season.
- Regularly analyze your own performance against these Kalkara seasonality benchmarks and adjust your pricing and availability strategy accordingly.
Best Areas for Airbnb Investment in Kalkara (2026)
Exploring the top neighborhoods for short-term rentals in Kalkara? This section highlights key areas, outlining why they are attractive for hosts and guests, along with notable local attractions. Consider these locations based on your target guest profile and investment strategy.
| Neighborhood / Area | Why Host Here? (Target Guests & Appeal) | Key Attractions & Landmarks |
|---|---|---|
| Kalkara Waterfront | Beautiful scenic area ideal for tourists wanting to enjoy the sea, with picturesque views and walking paths along the coast. | Fort Rinella, Kalkara Bay, Batteria ta' San Ġużepp, Kalkara Marina, St. Thomas Bay |
| Kalkara Village | Charming village atmosphere with local restaurants and cafes, perfect for tourists wanting a taste of local culture and history. | Kalkara parish church, Chapel of St. Joseph, Town square, Local artisan shops, Historical architecture |
| Fort Rinella | Historic site featuring the world's largest cannon, attracting history enthusiasts and educational tourists. | Fort Rinella Museum, Guided tours, Historical reenactments, Views over the Grand Harbour |
| St. Thomas Bay | Popular beach destination for both locals and tourists, great for family-friendly vacations and water sports. | St. Thomas Bay Beach, Water sports facilities, Beach restaurants, Scenic coastal views |
| Zejtun | Nearby town with rich history, traditional Maltese culture, and vibrant local markets, attracting those interested in local lifestyle. | Zejtun parish church, Historical chapels, Local market, Traditional Maltese cuisine |
| Birgu (Vittoriosa) | Historic city nearby with a rich history and heritage, excellent for tourists interested in the Knights of St. John. | Inquisitor's Palace, Birgu waterfront, National Maritime Museum, Fort St. Angelo |
| Senglea (Isla) | Adjacent to Kalkara, Senglea offers stunning views of Valletta and is great for history and sightseeing. | Gardjola Gardens, Senglea waterfront, Fortifications, Historical architecture |
| Cottonera | The Cottonera area consists of multiple historical fortified cities, rich in Maltese culture and heritage, ideal for history buffs. | Fortifications of Cottonera, Cafes and restaurants, Cultural events, Local workshops |
Understanding Airbnb License Requirements & STR Laws in Kalkara (2026)
While Kalkara, South Eastern Region, Malta currently shows low STR regulations, specific Airbnb license requirements might still exist or change. Always verify the latest short term rental regulations and Airbnb license requirements directly with local government authorities for Kalkara to ensure full compliance before hosting.
(Source: AirROI data, 2026, finding no licensed listings among those analyzed)
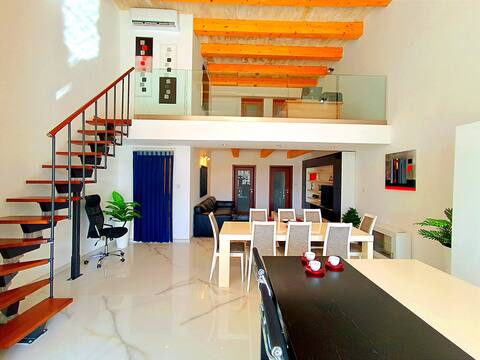
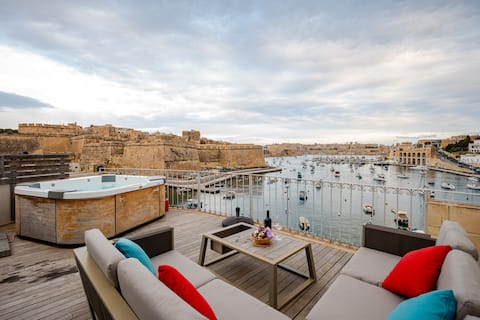
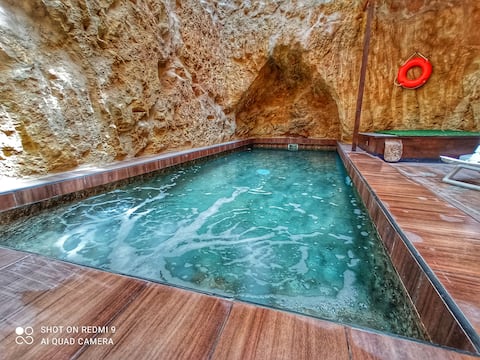
Top Performing Airbnb Properties in Kalkara (2026)
Benchmark your potential! Explore examples of top-performing Airbnb properties in Kalkarabased on Trailing Twelve Month (TTM) revenue. Analyze their characteristics, revenue, occupancy rate, and ADR to understand what drives success in this market.

Valletta&Grand Harbour Lookout Seaview Hot tub BBQ
Entire Place • 3 bedrooms

Driftwood - Seafront House of Character
Entire Place • 3 bedrooms
Beautiful Duplex large Sea Front Loft
Entire Place • 2 bedrooms
Seafront Penthouse Studio with private Jacuzzi
Entire Place • 1 bedroom
Town House with Private Pool in Village Centre
Entire Place • 3 bedrooms

Sea view enchanting home with Rooftop Terrace
Entire Place • 2 bedrooms
Note: Performance varies based on location, size, amenities, seasonality, and management quality. Data reflects the past 12 months.
Top Performing Airbnb Hosts in Kalkara (2026)
Learn from the best! This table showcases top-performing Airbnb hosts in Kalkara based on the number of properties managed and estimated total revenue over the past year. Analyze their scale and performance metrics.
| Host Name | Properties | Grossing Revenue | Stay Reviews | Avg Rating |
|---|---|---|---|---|
| Nicholas | 3 | $140,213 | 398 | 4.77/5.0 |
| Alberto | 2 | $75,252 | 121 | 4.79/5.0 |
| Ivan | 4 | $65,351 | 130 | 4.91/5.0 |
| William | 3 | $61,833 | 28 | 4.73/5.0 |
| Wendy | 1 | $58,287 | 241 | 4.86/5.0 |
| Andrew | 1 | $49,836 | 23 | 4.83/5.0 |
| Mariella | 1 | $48,121 | 198 | 4.98/5.0 |
| Angel | 1 | $43,088 | 68 | 4.63/5.0 |
| Mickael | 2 | $36,479 | 8 | 4.83/5.0 |
| Bruno | 1 | $34,965 | 24 | 4.83/5.0 |
Analyzing the strategies of top hosts, such as their property selection, pricing, and guest communication, can offer valuable lessons for optimizing your own Airbnb operations in Kalkara.
Dive Deeper: Advanced Kalkara STR Market Data (2026)
Ready to unlock more insights? AirROI provides access to advanced metrics and comprehensive Airbnb data for Kalkara. Explore detailed analytics beyond this report to refine your investment strategy, optimize pricing, and maximize your vacation rental profits.
Explore Advanced MetricsKalkara Short-Term Rental Market Composition (2026): Property & Room Types
Room Type Distribution
Property Type Distribution
Market Composition Insights for Kalkara
- The Kalkara Airbnb market composition is heavily skewed towards Entire Home/Apt listings, which make up 97% of the 33 active rentals. This indicates strong guest preference for privacy and space.
- Looking at the property type distribution in Kalkara, Apartment/Condo properties are the most common (60.6%), reflecting the local real estate landscape.
- Houses represent a significant 36.4% portion, catering likely to families or larger groups.
- Smaller segments like others (combined 3.0%) offer potential for unique stay experiences.
Kalkara Airbnb Room Capacity Analysis (2026): Bedroom Distribution
Distribution of Listings by Number of Bedrooms
Room Capacity Insights for Kalkara
- The dominant room capacity in Kalkara is 2 bedrooms listings, making up 45.5% of the market. This suggests a strong demand for properties suitable for couples or solo travelers.
- Together, 2 bedrooms and 1 bedroom properties represent 81.9% of the active Airbnb listings in Kalkara, indicating a high concentration in these sizes.
Kalkara Vacation Rental Guest Capacity Trends (2026)
Distribution of Listings by Guest Capacity
Guest Capacity Insights for Kalkara
- The most common guest capacity trend in Kalkara vacation rentals is listings accommodating 4 guests (24.2%). This suggests the primary traveler segment is likely small families or groups.
- Properties designed for 4 guests and 2 guests dominate the Kalkara STR market, accounting for 45.4% of listings.
- 30.3% of properties accommodate 6+ guests, serving the market segment for larger families or group travel in Kalkara.
- On average, properties in Kalkara are equipped to host 4.2 guests.
Kalkara Airbnb Booking Patterns (2026): Available vs. Booked Days
Available Days Distribution
Booked Days Distribution
Booking Pattern Insights for Kalkara
- The most common availability pattern in Kalkara falls within the 181-270 days range, representing 36.4% of listings. This suggests many properties have significant open periods on their calendars.
- Approximately 57.6% of listings show high availability (181+ days open annually), indicating potential for increased bookings or specific owner usage patterns.
- For booked days, the 91-180 days range is most frequent in Kalkara (33.3%), reflecting common guest stay durations or potential owner blocking patterns.
- A notable 48.5% of properties secure long booking periods (181+ days booked per year), highlighting successful long-term rental strategies or significant owner usage.
Kalkara Airbnb Minimum Stay Requirements Analysis
Distribution of Listings by Minimum Night Requirement
1 Night
6 listings
18.2% of total
2 Nights
5 listings
15.2% of total
3 Nights
8 listings
24.2% of total
4-6 Nights
2 listings
6.1% of total
30+ Nights
12 listings
36.4% of total
Key Insights
- The most prevalent minimum stay requirement in Kalkara is 30+ Nights, adopted by 36.4% of listings. This highlights the market's preference for longer commitments.
- A significant segment (36.4%) caters to monthly stays (30+ nights) in Kalkara, pointing to opportunities in the extended-stay market.
Recommendations
- Align with the market by considering a 30+ Nights minimum stay, as 36.4% of Kalkara hosts use this setting.
- If feasible, allowing 1-night stays, especially midweek or during low season, could capture last-minute bookings, as only 18.2% currently do.
- Explore offering discounts for stays of 30+ nights to attract the 36.4% of the market seeking extended stays.
- Adjust minimum nights based on seasonality – potentially shorter during low season and longer during peak demand periods in Kalkara.
Kalkara Airbnb Cancellation Policy Trends Analysis (2026)
Limited
2 listings
6.1% of total
Flexible
5 listings
15.2% of total
Moderate
7 listings
21.2% of total
Firm
14 listings
42.4% of total
Strict
5 listings
15.2% of total
Cancellation Policy Insights for Kalkara
- The prevailing Airbnb cancellation policy trend in Kalkara is Firm, used by 42.4% of listings.
- A majority (57.6%) of hosts in Kalkara utilize Firm or Strict policies, indicating a market where hosts prioritize booking security.
Recommendations for Hosts
- Consider adopting a Firm policy to align with the 42.4% market standard in Kalkara.
- Regularly review your cancellation policy against competitors and market demand shifts in Kalkara.
Kalkara STR Booking Lead Time Analysis (2026)
Average Booking Lead Time by Month
Booking Lead Time Insights for Kalkara
- The overall average booking lead time for vacation rentals in Kalkara is 69 days.
- Guests book furthest in advance for stays during October (average 96 days), likely coinciding with peak travel demand or local events.
- The shortest booking windows occur for stays in March (average 40 days), indicating more last-minute travel plans during this time.
- Seasonally, Fall (85 days avg.) sees the longest lead times, while Winter (58 days avg.) has the shortest, reflecting typical travel planning cycles.
Recommendations for Hosts
- Use the overall average lead time (69 days) as a baseline for your pricing and availability strategy in Kalkara.
- For October stays, consider implementing length-of-stay discounts or slightly higher rates for bookings made less than 96 days out to capitalize on advance planning.
- Target marketing efforts for the Fall season well in advance (at least 85 days) to capture early planners.
- Monitor your own booking lead times against these Kalkara averages to identify opportunities for dynamic pricing adjustments.
Popular & Essential Airbnb Amenities in Kalkara (2026)
Amenity Prevalence
Amenity Insights for Kalkara
- Essential amenities in Kalkara that guests expect include: TV, Kitchen, Air conditioning, Wifi. Lacking these (any) could significantly impact bookings.
- Popular amenities like Dishes and silverware, Hot water, Hangers are common but not universal. Offering these can provide a competitive edge.
Recommendations for Hosts
- Ensure your listing includes all essential amenities for Kalkara: TV, Kitchen, Air conditioning, Wifi.
- Prioritize adding missing essentials: TV, Kitchen, Air conditioning, Wifi.
- Consider adding popular differentiators like Dishes and silverware or Hot water to increase appeal.
- Highlight unique or less common amenities you offer (e.g., hot tub, dedicated workspace, EV charger) in your listing description and photos.
- Regularly check competitor amenities in Kalkara to stay competitive.
Kalkara Airbnb Guest Demographics & Profile Analysis (2026)
Guest Profile Summary for Kalkara
- The typical guest profile for Airbnb in Kalkara consists of predominantly international visitors (99%), with top international origins including France, typically belonging to the Post-2000s (Gen Z/Alpha) group (50%), primarily speaking English or Spanish.
- Domestic travelers account for 1.3% of guests.
- Key international markets include United Kingdom (34.2%) and France (12.1%).
- Top languages spoken are English (48%) followed by Spanish (11%).
- A significant demographic segment is the Post-2000s (Gen Z/Alpha) group, representing 50% of guests.
Recommendations for Hosts
- Focus marketing internationally, particularly towards travelers from France.
- Tailor amenities and listing descriptions to appeal to the dominant Post-2000s (Gen Z/Alpha) demographic (e.g., highlight fast WiFi, smart home features, local guides).
- Highlight unique local experiences or amenities relevant to the primary guest profile.
- Consider seasonal promotions aligned with peak travel times for key origin markets.
Nearby Short-Term Rental Market Comparison
How does the Kalkara Airbnb market stack up against its neighbors? Compare key performance metrics like average monthly revenue, ADR, and occupancy rates in surrounding areas to understand the broader regional STR landscape.
| Market | Active Properties | Monthly Revenue | Daily Rate | Avg. Occupancy |
|---|---|---|---|---|
| Mdina | 16 | $3,124 | $218.25 | 57% |
| Valletta | 604 | $2,598 | $187.70 | 53% |
| Mellieħa | 455 | $2,387 | $181.28 | 51% |
| Senglea | 106 | $2,216 | $142.33 | 60% |
| Żejtun | 44 | $2,210 | $189.49 | 45% |
| Birgu | 108 | $2,141 | $156.24 | 57% |
| Xgħajra | 14 | $2,132 | $162.45 | 46% |
| Żurrieq | 27 | $2,112 | $199.49 | 40% |
| Sliema | 1,326 | $2,070 | $170.23 | 51% |
| Floriana | 139 | $2,063 | $141.72 | 57% |