Swieqi Airbnb Market Analysis 2026: Short Term Rental Data & Vacation Rental Statistics in Northern Region, Malta
Is Airbnb profitable in Swieqi in 2026? Explore comprehensive Airbnb analytics for Swieqi, Northern Region, Malta to uncover income potential. This 2026 STR market report for Swieqi, based on AirROI data from February 2025 to January 2026, reveals key trends in the market of 458 active listings.
Whether you're considering an Airbnb investment in Swieqi, optimizing your existing vacation rental, or exploring rental arbitrage opportunities, understanding the Swieqi Airbnb data is crucial. Leveraging the low regulation environment is key to maximizing your short term rental income potential. Let's dive into the specifics.
Key Swieqi Airbnb Performance Metrics Overview
Monthly Airbnb Revenue Variations & Income Potential in Swieqi (2026)
Understanding the monthly revenue variations for Airbnb listings in Swieqi is key to maximizing your short term rental income potential. Seasonality significantly impacts earnings. Our analysis, based on data from the past 12 months, shows that the peak revenue month for STRs in Swieqi is typically August, while January often presents the lowest earnings, highlighting opportunities for strategic pricing adjustments during shoulder and low seasons. Explore the typical Airbnb income in Swieqi across different performance tiers:
- Best-in-class properties (Top 10%) achieve $5,220+ monthly, often utilizing dynamic pricing and superior guest experiences.
- Strong performing properties (Top 25%) earn $3,130 or more, indicating effective management and desirable locations/amenities.
- Typical properties (Median) generate around $1,613 per month, representing the average market performance.
- Entry-level properties (Bottom 25%) see earnings around $712, often with potential for optimization.
Average Monthly Airbnb Earnings Trend in Swieqi
Swieqi Airbnb Occupancy Rate Trends (2026)
Maximize your bookings by understanding the Swieqi STR occupancy trends. Seasonal demand shifts significantly influence how often properties are booked. Typically, Augustsees the highest demand (peak season occupancy), while January experiences the lowest (low season). Effective strategies, like adjusting minimum stays or offering promotions, can boost occupancy during slower periods. Here's how different property tiers perform in Swieqi:
- Best-in-class properties (Top 10%) achieve 84%+ occupancy, indicating high desirability and potentially optimized availability.
- Strong performing properties (Top 25%) maintain 69% or higher occupancy, suggesting good market fit and guest satisfaction.
- Typical properties (Median) have an occupancy rate around 48%.
- Entry-level properties (Bottom 25%) average 24% occupancy, potentially facing higher vacancy.
Average Monthly Occupancy Rate Trend in Swieqi
Average Daily Rate (ADR) Airbnb Trends in Swieqi (2026)
Effective short term rental pricing strategy in Swieqi involves understanding monthly ADR fluctuations. The Average Daily Rate (ADR) for Airbnb in Swieqi typically peaks in August and dips lowest during February. Leveraging Airbnb dynamic pricing tools or strategies based on this seasonality can significantly boost revenue. Here's a look at the typical nightly rates achieved:
- Best-in-class properties (Top 10%) command rates of $301+ per night, often due to premium features or locations.
- Strong performing properties (Top 25%) achieve nightly rates of $201 or more.
- Typical properties (Median) charge around $123 per night.
- Entry-level properties (Bottom 25%) earn around $60 per night.
Average Daily Rate (ADR) Trend by Month in Swieqi
Get Live Swieqi Market Intelligence 👇

Explore Real-time Analytics
Airbnb Seasonality Analysis & Trends in Swieqi (2026)
Peak Season (August, July, June)
- Revenue averages $4,049 per month
- Occupancy rates average 59.2%
- Daily rates average $187
Shoulder Season
- Revenue averages $2,304 per month
- Occupancy maintains around 48.4%
- Daily rates hold near $152
Low Season (January, February, December)
- Revenue drops to average $1,139 per month
- Occupancy decreases to average 34.0%
- Daily rates adjust to average $141
Seasonality Insights for Swieqi
- The Airbnb seasonality in Swieqi shows highly seasonal trends requiring careful strategy. While the sections above show seasonal averages, it's also insightful to look at the extremes:
- During the high season, the absolute peak month showcases Swieqi's highest earning potential, with monthly revenues capable of climbing to $4,450, occupancy reaching a high of 64.0%, and ADRs peaking at $193.
- Conversely, the slowest single month of the year, typically falling within the low season, marks the market's lowest point. In this month, revenue might dip to $906, occupancy could drop to 25.3%, and ADRs may adjust down to $131.
- Understanding both the seasonal averages and these monthly peaks and troughs in revenue, occupancy, and ADR is crucial for maximizing your Airbnb profit potential in Swieqi.
Seasonal Strategies for Maximizing Profit
- Peak Season: Maximize revenue through premium pricing and potentially longer minimum stays. Ensure high availability.
- Low Season: Offer competitive pricing, special promotions (e.g., extended stay discounts), and flexible cancellation policies. Target off-season travelers like remote workers or budget-conscious guests.
- Shoulder Seasons: Implement dynamic pricing that balances peak and low rates. Target weekend travelers or specific events. Offer slightly more flexible terms than peak season.
- Regularly analyze your own performance against these Swieqi seasonality benchmarks and adjust your pricing and availability strategy accordingly.
Best Areas for Airbnb Investment in Swieqi (2026)
Exploring the top neighborhoods for short-term rentals in Swieqi? This section highlights key areas, outlining why they are attractive for hosts and guests, along with notable local attractions. Consider these locations based on your target guest profile and investment strategy.
| Neighborhood / Area | Why Host Here? (Target Guests & Appeal) | Key Attractions & Landmarks |
|---|---|---|
| Swieqi Central | Swieqi Central is a bustling area with easy access to public transport and local amenities. Its proximity to St. Julian's, a tourist hotspot, makes it an ideal location for attracting vacationers. | St. George's Bay, Paceville nightlife, Spinola Bay, Balluta Bay, Bay Street Shopping Complex |
| Madliena | Madliena offers a more tranquil and upscale resident experience with beautiful views and luxurious villas. This area appeals to guests looking for a quieter stay away from the busy areas but close enough to easily access them. | Madliena Chapel, St. John's Tower, Cappuccini Heights, Mellieha Bay, Misterbianco Restaurant |
| Ijfawra | Ijfawra is a residential neighborhood known for its hiking trails and countryside views. It's a great option for those interested in a more nature-centric Airbnb experience, appealing to adventurous travelers. | Hiking trails, Natural Parks, Local farms, Countryside vistas |
| Tigne Point | Tigne Point is a modern development featuring shopping, dining, and luxury apartments with stunning sea views. It is very attractive to tourists for its waterfront activities. | Tigne Point Shopping Mall, Sliema Promenade, Fort Tigne, beach clubs, water sports activities |
| Balluta | Balluta is well-known for its picturesque seafront and charming promenade. It's a favorite spot for tourists looking for seaside accommodations near vibrant cafes and restaurants. | Balluta Bay, The Exiles Beach, Balluta Church, Local cafes, Water taxi access |
| St. Julian's South | St. Julian's South lies adjacent to vibrant nightlife areas and cultural sites, making it perfect for young travelers or partygoers looking to enjoy the local nightlife. | Paceville, St. Julian's restaurants, Casino di Venezia, Spinola Bay, Nightclubs |
| High Ridge | High Ridge is a quieter residential area with stunning views of the coastline. Its peaceful atmosphere is perfect for families and individuals looking to relax while still being close to tourist attractions. | High Ridge lookout, Local parks, Family-friendly restaurants, Seaside walks |
| Sliema | Sliema, although slightly outside Swieqi, is very close and a prime tourist destination with its shopping districts and seafront promenade. It's ideal for investors looking to maximize their Airbnb reach in a popular location. | Sliema Beach, The Point Shopping Mall, Fort Tigne, Local markets, Diverse dining options |
Understanding Airbnb License Requirements & STR Laws in Swieqi (2026)
While Swieqi, Northern Region, Malta currently shows low STR regulations, specific Airbnb license requirements might still exist or change. Always verify the latest short term rental regulations and Airbnb license requirements directly with local government authorities for Swieqi to ensure full compliance before hosting.
(Source: AirROI data, 2026, based on 1% licensed listings)
Top Performing Airbnb Properties in Swieqi (2026)
Benchmark your potential! Explore examples of top-performing Airbnb properties in Swieqibased on Trailing Twelve Month (TTM) revenue. Analyze their characteristics, revenue, occupancy rate, and ADR to understand what drives success in this market.

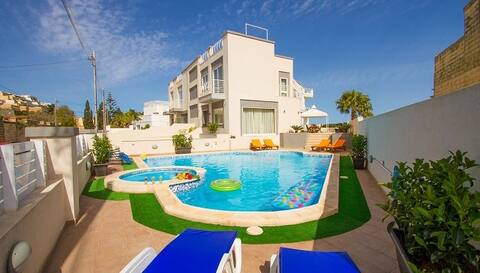
Stunning Villa •Pool •Tennis •Breath taking Views
Entire Place • 6 bedrooms
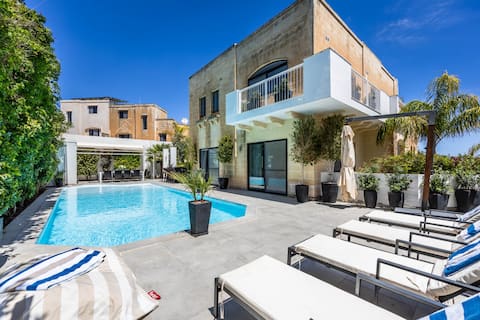
Modern Villa with Sea Views next to St Julian's
Entire Place • 6 bedrooms
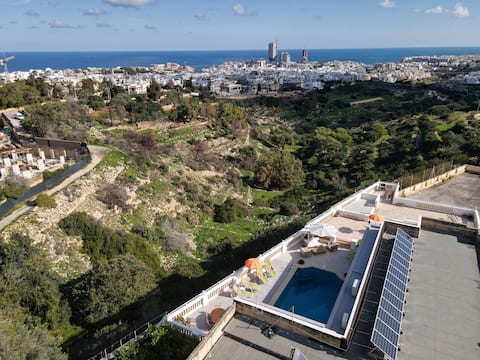
Beautiful Villa with Breathtaking Views in Swieqi
Entire Place • 5 bedrooms
Luxurious Villa 5 BR, Pool, 3min from St Julian's
Entire Place • 5 bedrooms
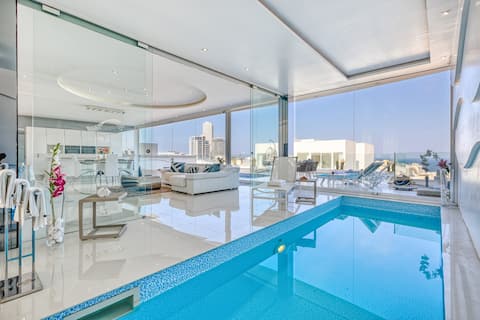
Luxury Penthouse in Swieqi | w/ In & Outdoor Pool
Entire Place • 3 bedrooms

Basecamp - Private Villa with Pool & 8 Bedrooms!
Entire Place • 10 bedrooms
Note: Performance varies based on location, size, amenities, seasonality, and management quality. Data reflects the past 12 months.
Top Performing Airbnb Hosts in Swieqi (2026)
Learn from the best! This table showcases top-performing Airbnb hosts in Swieqi based on the number of properties managed and estimated total revenue over the past year. Analyze their scale and performance metrics.
| Host Name | Properties | Grossing Revenue | Stay Reviews | Avg Rating |
|---|---|---|---|---|
| Matthew | 32 | $820,401 | 447 | 4.25/5.0 |
| Fares | 10 | $725,203 | 166 | 4.86/5.0 |
| Jane | 28 | $539,578 | 185 | 3.89/5.0 |
| Francesco | 11 | $352,098 | 124 | 4.94/5.0 |
| Paola | 14 | $245,268 | 374 | 4.69/5.0 |
| Irina | 1 | $214,014 | 31 | 4.55/5.0 |
| Mz | 7 | $148,620 | 91 | 4.88/5.0 |
| Pierre | 6 | $147,851 | 41 | 4.76/5.0 |
| F.T. | 6 | $140,363 | 68 | 4.78/5.0 |
| Alexander | 4 | $130,692 | 89 | 4.62/5.0 |
Analyzing the strategies of top hosts, such as their property selection, pricing, and guest communication, can offer valuable lessons for optimizing your own Airbnb operations in Swieqi.
Dive Deeper: Advanced Swieqi STR Market Data (2026)
Ready to unlock more insights? AirROI provides access to advanced metrics and comprehensive Airbnb data for Swieqi. Explore detailed analytics beyond this report to refine your investment strategy, optimize pricing, and maximize your vacation rental profits.
Explore Advanced MetricsSwieqi Short-Term Rental Market Composition (2026): Property & Room Types
Room Type Distribution
Property Type Distribution
Market Composition Insights for Swieqi
- The Swieqi Airbnb market composition is heavily skewed towards Entire Home/Apt listings, which make up 65.9% of the 458 active rentals. This indicates strong guest preference for privacy and space.
- However, a notable 27.5% share for Private Rooms suggests opportunities for budget-conscious travelers or hosts renting out spare rooms.
- Looking at the property type distribution in Swieqi, Apartment/Condo properties are the most common (77.9%), reflecting the local real estate landscape.
- Houses represent a significant 18.8% portion, catering likely to families or larger groups.
- Smaller segments like hotel/boutique, others (combined 3.3%) offer potential for unique stay experiences.
Swieqi Airbnb Room Capacity Analysis (2026): Bedroom Distribution
Distribution of Listings by Number of Bedrooms
Room Capacity Insights for Swieqi
- The dominant room capacity in Swieqi is 3 bedrooms listings, making up 21.6% of the market. This suggests a strong demand for properties suitable for families or small groups.
- Together, 3 bedrooms and 2 bedrooms properties represent 42.6% of the active Airbnb listings in Swieqi, indicating a high concentration in these sizes.
- A significant 28.8% of listings offer 3+ bedrooms, catering to larger groups and families seeking more space in Swieqi.
Swieqi Vacation Rental Guest Capacity Trends (2026)
Distribution of Listings by Guest Capacity
Guest Capacity Insights for Swieqi
- The most common guest capacity trend in Swieqi vacation rentals is listings accommodating 8+ guests (18.1%). This suggests the primary traveler segment is likely larger groups.
- Properties designed for 8+ guests and 4 guests dominate the Swieqi STR market, accounting for 33.8% of listings.
- 35.0% of properties accommodate 6+ guests, serving the market segment for larger families or group travel in Swieqi.
- On average, properties in Swieqi are equipped to host 3.7 guests.
Swieqi Airbnb Booking Patterns (2026): Available vs. Booked Days
Available Days Distribution
Booked Days Distribution
Booking Pattern Insights for Swieqi
- The most common availability pattern in Swieqi falls within the 271-366 days range, representing 51.3% of listings. This suggests many properties have significant open periods on their calendars.
- Approximately 82.5% of listings show high availability (181+ days open annually), indicating potential for increased bookings or specific owner usage patterns.
- For booked days, the 91-180 days range is most frequent in Swieqi (32.1%), reflecting common guest stay durations or potential owner blocking patterns.
- A notable 18.4% of properties secure long booking periods (181+ days booked per year), highlighting successful long-term rental strategies or significant owner usage.
Swieqi Airbnb Minimum Stay Requirements Analysis
Distribution of Listings by Minimum Night Requirement
1 Night
55 listings
12% of total
2 Nights
65 listings
14.2% of total
3 Nights
66 listings
14.4% of total
4-6 Nights
37 listings
8.1% of total
7-29 Nights
26 listings
5.7% of total
30+ Nights
209 listings
45.6% of total
Key Insights
- The most prevalent minimum stay requirement in Swieqi is 30+ Nights, adopted by 45.6% of listings. This highlights the market's preference for longer commitments.
- A significant segment (45.6%) caters to monthly stays (30+ nights) in Swieqi, pointing to opportunities in the extended-stay market.
Recommendations
- Align with the market by considering a 30+ Nights minimum stay, as 45.6% of Swieqi hosts use this setting.
- If feasible, allowing 1-night stays, especially midweek or during low season, could capture last-minute bookings, as only 12% currently do.
- Explore offering discounts for stays of 30+ nights to attract the 45.6% of the market seeking extended stays.
- Adjust minimum nights based on seasonality – potentially shorter during low season and longer during peak demand periods in Swieqi.
Swieqi Airbnb Cancellation Policy Trends Analysis (2026)
Super Strict 60 Days
5 listings
1.1% of total
Super Strict 30 Days
4 listings
0.9% of total
Limited
25 listings
5.5% of total
Flexible
72 listings
15.9% of total
Moderate
52 listings
11.5% of total
Firm
218 listings
48% of total
Strict
78 listings
17.2% of total
Cancellation Policy Insights for Swieqi
- The prevailing Airbnb cancellation policy trend in Swieqi is Firm, used by 48% of listings.
- A majority (65.2%) of hosts in Swieqi utilize Firm or Strict policies, indicating a market where hosts prioritize booking security.
Recommendations for Hosts
- Consider adopting a Firm policy to align with the 48% market standard in Swieqi.
- Regularly review your cancellation policy against competitors and market demand shifts in Swieqi.
Swieqi STR Booking Lead Time Analysis (2026)
Average Booking Lead Time by Month
Booking Lead Time Insights for Swieqi
- The overall average booking lead time for vacation rentals in Swieqi is 50 days.
- Guests book furthest in advance for stays during August (average 74 days), likely coinciding with peak travel demand or local events.
- The shortest booking windows occur for stays in February (average 32 days), indicating more last-minute travel plans during this time.
- Seasonally, Summer (64 days avg.) sees the longest lead times, while Winter (38 days avg.) has the shortest, reflecting typical travel planning cycles.
Recommendations for Hosts
- Use the overall average lead time (50 days) as a baseline for your pricing and availability strategy in Swieqi.
- For August stays, consider implementing length-of-stay discounts or slightly higher rates for bookings made less than 74 days out to capitalize on advance planning.
- Target marketing efforts for the Summer season well in advance (at least 64 days) to capture early planners.
- Monitor your own booking lead times against these Swieqi averages to identify opportunities for dynamic pricing adjustments.
Popular & Essential Airbnb Amenities in Swieqi (2026)
Amenity Prevalence
Amenity Insights for Swieqi
- Essential amenities in Swieqi that guests expect include: Wifi, Kitchen. Lacking these (any) could significantly impact bookings.
- Popular amenities like Washer, TV, Air conditioning are common but not universal. Offering these can provide a competitive edge.
Recommendations for Hosts
- Ensure your listing includes all essential amenities for Swieqi: Wifi, Kitchen.
- Prioritize adding missing essentials: Wifi, Kitchen.
- Consider adding popular differentiators like Washer or TV to increase appeal.
- Highlight unique or less common amenities you offer (e.g., hot tub, dedicated workspace, EV charger) in your listing description and photos.
- Regularly check competitor amenities in Swieqi to stay competitive.
Swieqi Airbnb Guest Demographics & Profile Analysis (2026)
Guest Profile Summary for Swieqi
- The typical guest profile for Airbnb in Swieqi consists of predominantly international visitors (99%), with top international origins including United Kingdom, typically belonging to the Post-2000s (Gen Z/Alpha) group (50%), primarily speaking English or French.
- Domestic travelers account for 1.5% of guests.
- Key international markets include France (23.4%) and United Kingdom (15.1%).
- Top languages spoken are English (40.9%) followed by French (15.3%).
- A significant demographic segment is the Post-2000s (Gen Z/Alpha) group, representing 50% of guests.
Recommendations for Hosts
- Focus marketing internationally, particularly towards travelers from United Kingdom.
- Tailor amenities and listing descriptions to appeal to the dominant Post-2000s (Gen Z/Alpha) demographic (e.g., highlight fast WiFi, smart home features, local guides).
- Highlight unique local experiences or amenities relevant to the primary guest profile.
- Consider seasonal promotions aligned with peak travel times for key origin markets.
Nearby Short-Term Rental Market Comparison
How does the Swieqi Airbnb market stack up against its neighbors? Compare key performance metrics like average monthly revenue, ADR, and occupancy rates in surrounding areas to understand the broader regional STR landscape.
| Market | Active Properties | Monthly Revenue | Daily Rate | Avg. Occupancy |
|---|---|---|---|---|
| Mdina | 16 | $3,124 | $218.25 | 57% |
| Valletta | 604 | $2,598 | $187.70 | 53% |
| Mellieħa | 455 | $2,387 | $181.28 | 51% |
| Senglea | 106 | $2,216 | $142.33 | 60% |
| Żejtun | 44 | $2,210 | $189.49 | 45% |
| Birgu | 108 | $2,141 | $156.24 | 57% |
| Xgħajra | 14 | $2,132 | $162.45 | 46% |
| Żurrieq | 27 | $2,112 | $199.49 | 40% |
| Kalkara | 33 | $2,084 | $148.11 | 59% |
| Sliema | 1,326 | $2,070 | $170.23 | 51% |