Rabat Airbnb Market Analysis 2026: Short Term Rental Data & Vacation Rental Statistics in Northern Region, Malta
Is Airbnb profitable in Rabat in 2026? Explore comprehensive Airbnb analytics for Rabat, Northern Region, Malta to uncover income potential. This 2026 STR market report for Rabat, based on AirROI data from February 2025 to January 2026, reveals key trends in the niche market of 101 active listings.
Whether you're considering an Airbnb investment in Rabat, optimizing your existing vacation rental, or exploring rental arbitrage opportunities, understanding the Rabat Airbnb data is crucial. Leveraging the low regulation environment is key to maximizing your short term rental income potential. Let's dive into the specifics.
Key Rabat Airbnb Performance Metrics Overview
Monthly Airbnb Revenue Variations & Income Potential in Rabat (2026)
Understanding the monthly revenue variations for Airbnb listings in Rabat is key to maximizing your short term rental income potential. Seasonality significantly impacts earnings. Our analysis, based on data from the past 12 months, shows that the peak revenue month for STRs in Rabat is typically August, while January often presents the lowest earnings, highlighting opportunities for strategic pricing adjustments during shoulder and low seasons. Explore the typical Airbnb income in Rabat across different performance tiers:
- Best-in-class properties (Top 10%) achieve $3,417+ monthly, often utilizing dynamic pricing and superior guest experiences.
- Strong performing properties (Top 25%) earn $2,395 or more, indicating effective management and desirable locations/amenities.
- Typical properties (Median) generate around $1,391 per month, representing the average market performance.
- Entry-level properties (Bottom 25%) see earnings around $679, often with potential for optimization.
Average Monthly Airbnb Earnings Trend in Rabat
Rabat Airbnb Occupancy Rate Trends (2026)
Maximize your bookings by understanding the Rabat STR occupancy trends. Seasonal demand shifts significantly influence how often properties are booked. Typically, Augustsees the highest demand (peak season occupancy), while January experiences the lowest (low season). Effective strategies, like adjusting minimum stays or offering promotions, can boost occupancy during slower periods. Here's how different property tiers perform in Rabat:
- Best-in-class properties (Top 10%) achieve 82%+ occupancy, indicating high desirability and potentially optimized availability.
- Strong performing properties (Top 25%) maintain 66% or higher occupancy, suggesting good market fit and guest satisfaction.
- Typical properties (Median) have an occupancy rate around 44%.
- Entry-level properties (Bottom 25%) average 21% occupancy, potentially facing higher vacancy.
Average Monthly Occupancy Rate Trend in Rabat
Average Daily Rate (ADR) Airbnb Trends in Rabat (2026)
Effective short term rental pricing strategy in Rabat involves understanding monthly ADR fluctuations. The Average Daily Rate (ADR) for Airbnb in Rabat typically peaks in August and dips lowest during February. Leveraging Airbnb dynamic pricing tools or strategies based on this seasonality can significantly boost revenue. Here's a look at the typical nightly rates achieved:
- Best-in-class properties (Top 10%) command rates of $216+ per night, often due to premium features or locations.
- Strong performing properties (Top 25%) achieve nightly rates of $151 or more.
- Typical properties (Median) charge around $108 per night.
- Entry-level properties (Bottom 25%) earn around $82 per night.
Average Daily Rate (ADR) Trend by Month in Rabat
Get Live Rabat Market Intelligence 👇

Explore Real-time Analytics
Airbnb Seasonality Analysis & Trends in Rabat (2026)
Peak Season (August, July, September)
- Revenue averages $2,648 per month
- Occupancy rates average 56.3%
- Daily rates average $152
Shoulder Season
- Revenue averages $1,755 per month
- Occupancy maintains around 44.5%
- Daily rates hold near $134
Low Season (January, February, March)
- Revenue drops to average $1,125 per month
- Occupancy decreases to average 35.3%
- Daily rates adjust to average $120
Seasonality Insights for Rabat
- The Airbnb seasonality in Rabat shows highly seasonal trends requiring careful strategy. While the sections above show seasonal averages, it's also insightful to look at the extremes:
- During the high season, the absolute peak month showcases Rabat's highest earning potential, with monthly revenues capable of climbing to $2,911, occupancy reaching a high of 57.8%, and ADRs peaking at $157.
- Conversely, the slowest single month of the year, typically falling within the low season, marks the market's lowest point. In this month, revenue might dip to $1,004, occupancy could drop to 26.0%, and ADRs may adjust down to $116.
- Understanding both the seasonal averages and these monthly peaks and troughs in revenue, occupancy, and ADR is crucial for maximizing your Airbnb profit potential in Rabat.
Seasonal Strategies for Maximizing Profit
- Peak Season: Maximize revenue through premium pricing and potentially longer minimum stays. Ensure high availability.
- Low Season: Offer competitive pricing, special promotions (e.g., extended stay discounts), and flexible cancellation policies. Target off-season travelers like remote workers or budget-conscious guests.
- Shoulder Seasons: Implement dynamic pricing that balances peak and low rates. Target weekend travelers or specific events. Offer slightly more flexible terms than peak season.
- Regularly analyze your own performance against these Rabat seasonality benchmarks and adjust your pricing and availability strategy accordingly.
Best Areas for Airbnb Investment in Rabat (2026)
Exploring the top neighborhoods for short-term rentals in Rabat? This section highlights key areas, outlining why they are attractive for hosts and guests, along with notable local attractions. Consider these locations based on your target guest profile and investment strategy.
| Neighborhood / Area | Why Host Here? (Target Guests & Appeal) | Key Attractions & Landmarks |
|---|---|---|
| Valletta | The capital city of Malta, steeped in history and culture. Attracts tourists with its stunning architecture, museums, and vibrant local life. | St. John's Co-Cathedral, Upper Barracca Gardens, National Museum of Archaeology, Fort St. Elmo, Merchants Street |
| Sliema | A popular seaside resort town known for its shopping, restaurants, and nightlife. Ideal for beach lovers and those looking for a vibrant urban experience. | Sliema Promenade, Tigne Point, Fort Tigne, Balluta Bay, The Point Shopping Mall |
| St. Julian's | Famous for its nightlife and entertainment options, making it a favorite for young tourists. Offers beautiful beaches and numerous restaurants and bars. | Paceville, Spinola Bay, St. George's Bay, Portomaso Marina, Eden Cinemas |
| Mdina | The ancient capital of Malta, known for its medieval architecture and romantic atmosphere. Attracts history enthusiasts and couples looking for a quiet retreat. | St. Paul's Cathedral, Ditch of Mdina, Mdina Glass, The Mdina Experience, Villegaignon Gardens |
| Gozo Island | Known for its natural beauty and tranquil environment. Attract tourists seeking relaxation, hiking, and cultural experiences. | Azure Window, Dwejra Bay, The Citadel, Ramla Bay, Victoria |
| Marsaxlokk | A fishing village known for its colorful boats and local seafood market. Ideal for tourists looking for an authentic Maltese experience. | Marsaxlokk Harbour, Sunday Fish Market, St. Lucian Parish Church, Delimara Point, Fort Delimara |
| Birgu (Vittoriosa) | One of the Three Cities, it has a rich history and beautiful waterfront. Perfect for tourists interested in Malta's maritime heritage. | Fort St. Angelo, National Maritime Museum, Inquisitor's Palace, Birgu Waterfront, Bormla's Promenade |
| Naxxar | A quiet residential area with beautiful gardens and historic architecture. A great location for families and those seeking a peaceful getaway. | Palazzo Parisio, Naxxar Parish Church, Violet Gardens, Pine Hill, San Paolo Band Club |
Understanding Airbnb License Requirements & STR Laws in Rabat (2026)
While Rabat, Northern Region, Malta currently shows low STR regulations, specific Airbnb license requirements might still exist or change. Always verify the latest short term rental regulations and Airbnb license requirements directly with local government authorities for Rabat to ensure full compliance before hosting.
(Source: AirROI data, 2026, finding no licensed listings among those analyzed)
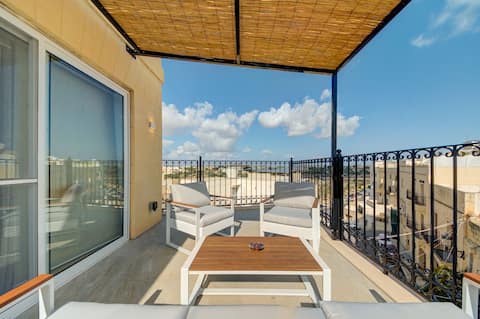
Top Performing Airbnb Properties in Rabat (2026)
Benchmark your potential! Explore examples of top-performing Airbnb properties in Rabatbased on Trailing Twelve Month (TTM) revenue. Analyze their characteristics, revenue, occupancy rate, and ADR to understand what drives success in this market.
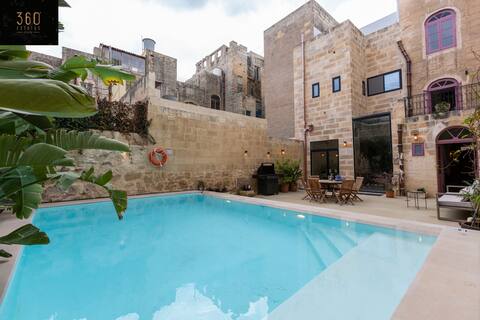
Ultimate luxury home experience in beautiful Rabat
Entire Place • 4 bedrooms
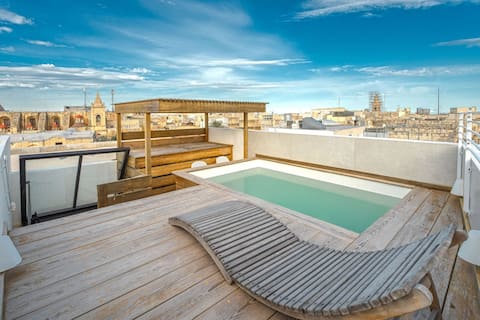
Modern Oasis Near Mdina with Rooftop Pool & View
Entire Place • 2 bedrooms
Luxury Stay in a Medieval Gem near Mdina, Sleeps 7
Entire Place • 3 bedrooms

Orchid Boutique Accommodation in Historic Townhouse
Entire Place • 1 bedroom
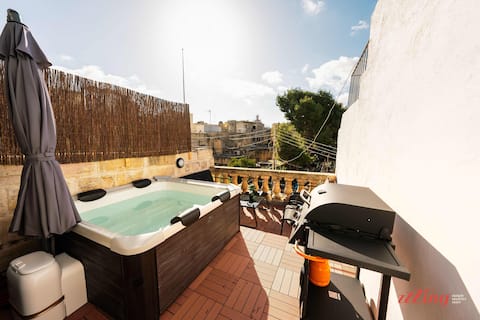
Charming Village Escape with Jacuzzi & Games Room
Entire Place • 2 bedrooms

500 year old house Labini str. Mdina, Rabat
Entire Place • 2 bedrooms
Note: Performance varies based on location, size, amenities, seasonality, and management quality. Data reflects the past 12 months.
Top Performing Airbnb Hosts in Rabat (2026)
Learn from the best! This table showcases top-performing Airbnb hosts in Rabat based on the number of properties managed and estimated total revenue over the past year. Analyze their scale and performance metrics.
| Host Name | Properties | Grossing Revenue | Stay Reviews | Avg Rating |
|---|---|---|---|---|
| Matthew | 4 | $214,617 | 107 | 4.63/5.0 |
| Ritienne | 5 | $86,352 | 737 | 4.82/5.0 |
| Jaime Miguel | 1 | $76,493 | 40 | 4.80/5.0 |
| Joanne | 4 | $71,713 | 43 | 5.00/5.0 |
| Full Of Character | 2 | $65,069 | 586 | 4.81/5.0 |
| TwoRoom | 2 | $52,448 | 123 | 4.88/5.0 |
| William | 4 | $49,447 | 23 | 4.63/5.0 |
| Ryan | 3 | $49,065 | 386 | 4.86/5.0 |
| Manuel And Mariosa | 7 | $43,275 | 98 | 4.62/5.0 |
| Maison Medina Malta | 4 | $42,282 | 9 | 4.83/5.0 |
Analyzing the strategies of top hosts, such as their property selection, pricing, and guest communication, can offer valuable lessons for optimizing your own Airbnb operations in Rabat.
Dive Deeper: Advanced Rabat STR Market Data (2026)
Ready to unlock more insights? AirROI provides access to advanced metrics and comprehensive Airbnb data for Rabat. Explore detailed analytics beyond this report to refine your investment strategy, optimize pricing, and maximize your vacation rental profits.
Explore Advanced MetricsRabat Short-Term Rental Market Composition (2026): Property & Room Types
Room Type Distribution
Property Type Distribution
Market Composition Insights for Rabat
- The Rabat Airbnb market composition is heavily skewed towards Entire Home/Apt listings, which make up 49.5% of the 101 active rentals. This indicates strong guest preference for privacy and space.
- However, a notable 41.6% share for Private Rooms suggests opportunities for budget-conscious travelers or hosts renting out spare rooms.
- Looking at the property type distribution in Rabat, House properties are the most common (43.6%), reflecting the local real estate landscape.
- Houses represent a significant 43.6% portion, catering likely to families or larger groups.
- The presence of 31.7% Hotel/Boutique listings indicates integration with traditional hospitality.
- Smaller segments like others, unique stays (combined 2.0%) offer potential for unique stay experiences.
Rabat Airbnb Room Capacity Analysis (2026): Bedroom Distribution
Distribution of Listings by Number of Bedrooms
Room Capacity Insights for Rabat
- The dominant room capacity in Rabat is 1 bedroom listings, making up 44.6% of the market. This suggests a strong demand for properties suitable for couples or solo travelers.
- Together, 1 bedroom and 3 bedrooms properties represent 63.4% of the active Airbnb listings in Rabat, indicating a high concentration in these sizes.
- A significant 21.8% of listings offer 3+ bedrooms, catering to larger groups and families seeking more space in Rabat.
Rabat Vacation Rental Guest Capacity Trends (2026)
Distribution of Listings by Guest Capacity
Guest Capacity Insights for Rabat
- The most common guest capacity trend in Rabat vacation rentals is listings accommodating 2 guests (28.7%). This suggests the primary traveler segment is likely couples or solo travelers.
- Properties designed for 2 guests and 4 guests dominate the Rabat STR market, accounting for 42.6% of listings.
- 19.8% of properties accommodate 6+ guests, serving the market segment for larger families or group travel in Rabat.
- On average, properties in Rabat are equipped to host 3.1 guests.
Rabat Airbnb Booking Patterns (2026): Available vs. Booked Days
Available Days Distribution
Booked Days Distribution
Booking Pattern Insights for Rabat
- The most common availability pattern in Rabat falls within the 271-366 days range, representing 45.5% of listings. This suggests many properties have significant open periods on their calendars.
- Approximately 75.2% of listings show high availability (181+ days open annually), indicating potential for increased bookings or specific owner usage patterns.
- For booked days, the 91-180 days range is most frequent in Rabat (32.7%), reflecting common guest stay durations or potential owner blocking patterns.
- A notable 24.7% of properties secure long booking periods (181+ days booked per year), highlighting successful long-term rental strategies or significant owner usage.
Rabat Airbnb Minimum Stay Requirements Analysis
Distribution of Listings by Minimum Night Requirement
1 Night
20 listings
19.8% of total
2 Nights
19 listings
18.8% of total
3 Nights
15 listings
14.9% of total
4-6 Nights
11 listings
10.9% of total
7-29 Nights
1 listings
1% of total
30+ Nights
35 listings
34.7% of total
Key Insights
- The most prevalent minimum stay requirement in Rabat is 30+ Nights, adopted by 34.7% of listings. This highlights the market's preference for longer commitments.
- A significant segment (34.7%) caters to monthly stays (30+ nights) in Rabat, pointing to opportunities in the extended-stay market.
Recommendations
- Align with the market by considering a 30+ Nights minimum stay, as 34.7% of Rabat hosts use this setting.
- If feasible, allowing 1-night stays, especially midweek or during low season, could capture last-minute bookings, as only 19.8% currently do.
- Explore offering discounts for stays of 30+ nights to attract the 34.7% of the market seeking extended stays.
- Adjust minimum nights based on seasonality – potentially shorter during low season and longer during peak demand periods in Rabat.
Rabat Airbnb Cancellation Policy Trends Analysis (2026)
Limited
5 listings
5% of total
Flexible
19 listings
19% of total
Moderate
42 listings
42% of total
Firm
24 listings
24% of total
Strict
10 listings
10% of total
Cancellation Policy Insights for Rabat
- The prevailing Airbnb cancellation policy trend in Rabat is Moderate, used by 42% of listings.
- There's a relatively balanced mix between guest-friendly (61.0%) and stricter (34.0%) policies, offering choices for different guest needs.
Recommendations for Hosts
- Consider adopting a Moderate policy to align with the 42% market standard in Rabat.
- Using a Strict policy might deter some guests, as only 10% of listings use it. Evaluate if potential revenue protection outweighs possible lower booking rates.
- Regularly review your cancellation policy against competitors and market demand shifts in Rabat.
Rabat STR Booking Lead Time Analysis (2026)
Average Booking Lead Time by Month
Booking Lead Time Insights for Rabat
- The overall average booking lead time for vacation rentals in Rabat is 67 days.
- Guests book furthest in advance for stays during August (average 99 days), likely coinciding with peak travel demand or local events.
- The shortest booking windows occur for stays in February (average 39 days), indicating more last-minute travel plans during this time.
- Seasonally, Fall (78 days avg.) sees the longest lead times, while Winter (51 days avg.) has the shortest, reflecting typical travel planning cycles.
Recommendations for Hosts
- Use the overall average lead time (67 days) as a baseline for your pricing and availability strategy in Rabat.
- For August stays, consider implementing length-of-stay discounts or slightly higher rates for bookings made less than 99 days out to capitalize on advance planning.
- Target marketing efforts for the Fall season well in advance (at least 78 days) to capture early planners.
- Monitor your own booking lead times against these Rabat averages to identify opportunities for dynamic pricing adjustments.
Popular & Essential Airbnb Amenities in Rabat (2026)
Amenity Prevalence
Amenity Insights for Rabat
- Essential amenities in Rabat that guests expect include: Wifi. Lacking these (this) could significantly impact bookings.
- Popular amenities like Air conditioning, Hangers, Hair dryer are common but not universal. Offering these can provide a competitive edge.
Recommendations for Hosts
- Ensure your listing includes all essential amenities for Rabat: Wifi.
- Consider adding popular differentiators like Air conditioning or Hangers to increase appeal.
- Highlight unique or less common amenities you offer (e.g., hot tub, dedicated workspace, EV charger) in your listing description and photos.
- Regularly check competitor amenities in Rabat to stay competitive.
Rabat Airbnb Guest Demographics & Profile Analysis (2026)
Guest Profile Summary for Rabat
- The typical guest profile for Airbnb in Rabat consists of predominantly international visitors (98%), with top international origins including France, typically belonging to the Post-2000s (Gen Z/Alpha) group (50%), primarily speaking English or French.
- Domestic travelers account for 1.7% of guests.
- Key international markets include United Kingdom (34.7%) and France (10.9%).
- Top languages spoken are English (47.9%) followed by French (12.6%).
- A significant demographic segment is the Post-2000s (Gen Z/Alpha) group, representing 50% of guests.
Recommendations for Hosts
- Focus marketing internationally, particularly towards travelers from France.
- Tailor amenities and listing descriptions to appeal to the dominant Post-2000s (Gen Z/Alpha) demographic (e.g., highlight fast WiFi, smart home features, local guides).
- Highlight unique local experiences or amenities relevant to the primary guest profile.
- Consider seasonal promotions aligned with peak travel times for key origin markets.
Nearby Short-Term Rental Market Comparison
How does the Rabat Airbnb market stack up against its neighbors? Compare key performance metrics like average monthly revenue, ADR, and occupancy rates in surrounding areas to understand the broader regional STR landscape.
| Market | Active Properties | Monthly Revenue | Daily Rate | Avg. Occupancy |
|---|---|---|---|---|
| Mdina | 16 | $3,124 | $218.25 | 57% |
| Valletta | 604 | $2,598 | $187.70 | 53% |
| Mellieħa | 455 | $2,387 | $181.28 | 51% |
| Senglea | 106 | $2,216 | $142.33 | 60% |
| Żejtun | 44 | $2,210 | $189.49 | 45% |
| Birgu | 108 | $2,141 | $156.24 | 57% |
| Xgħajra | 14 | $2,132 | $162.45 | 46% |
| Żurrieq | 27 | $2,112 | $199.49 | 40% |
| Kalkara | 33 | $2,084 | $148.11 | 59% |
| Sliema | 1,326 | $2,070 | $170.23 | 51% |