Saint Lawrence Airbnb Market Analysis 2026: Short Term Rental Data & Vacation Rental Statistics in Gozo Region, Malta
Is Airbnb profitable in Saint Lawrence in 2026? Explore comprehensive Airbnb analytics for Saint Lawrence, Gozo Region, Malta to uncover income potential. This 2026 STR market report for Saint Lawrence, based on AirROI data from February 2025 to January 2026, reveals key trends in the niche market of 28 active listings.
Whether you're considering an Airbnb investment in Saint Lawrence, optimizing your existing vacation rental, or exploring rental arbitrage opportunities, understanding the Saint Lawrence Airbnb data is crucial. Leveraging the low regulation environment is key to maximizing your short term rental income potential. Let's dive into the specifics.
Key Saint Lawrence Airbnb Performance Metrics Overview
Monthly Airbnb Revenue Variations & Income Potential in Saint Lawrence (2026)
Understanding the monthly revenue variations for Airbnb listings in Saint Lawrence is key to maximizing your short term rental income potential. Seasonality significantly impacts earnings. Our analysis, based on data from the past 12 months, shows that the peak revenue month for STRs in Saint Lawrence is typically August, while January often presents the lowest earnings, highlighting opportunities for strategic pricing adjustments during shoulder and low seasons. Explore the typical Airbnb income in Saint Lawrence across different performance tiers:
- Best-in-class properties (Top 10%) achieve $6,466+ monthly, often utilizing dynamic pricing and superior guest experiences.
- Strong performing properties (Top 25%) earn $4,956 or more, indicating effective management and desirable locations/amenities.
- Typical properties (Median) generate around $1,925 per month, representing the average market performance.
- Entry-level properties (Bottom 25%) see earnings around $647, often with potential for optimization.
Average Monthly Airbnb Earnings Trend in Saint Lawrence
Saint Lawrence Airbnb Occupancy Rate Trends (2026)
Maximize your bookings by understanding the Saint Lawrence STR occupancy trends. Seasonal demand shifts significantly influence how often properties are booked. Typically, Augustsees the highest demand (peak season occupancy), while January experiences the lowest (low season). Effective strategies, like adjusting minimum stays or offering promotions, can boost occupancy during slower periods. Here's how different property tiers perform in Saint Lawrence:
- Best-in-class properties (Top 10%) achieve 74%+ occupancy, indicating high desirability and potentially optimized availability.
- Strong performing properties (Top 25%) maintain 60% or higher occupancy, suggesting good market fit and guest satisfaction.
- Typical properties (Median) have an occupancy rate around 35%.
- Entry-level properties (Bottom 25%) average 17% occupancy, potentially facing higher vacancy.
Average Monthly Occupancy Rate Trend in Saint Lawrence
Average Daily Rate (ADR) Airbnb Trends in Saint Lawrence (2026)
Effective short term rental pricing strategy in Saint Lawrence involves understanding monthly ADR fluctuations. The Average Daily Rate (ADR) for Airbnb in Saint Lawrence typically peaks in September and dips lowest during February. Leveraging Airbnb dynamic pricing tools or strategies based on this seasonality can significantly boost revenue. Here's a look at the typical nightly rates achieved:
- Best-in-class properties (Top 10%) command rates of $430+ per night, often due to premium features or locations.
- Strong performing properties (Top 25%) achieve nightly rates of $307 or more.
- Typical properties (Median) charge around $161 per night.
- Entry-level properties (Bottom 25%) earn around $72 per night.
Average Daily Rate (ADR) Trend by Month in Saint Lawrence
Get Live Saint Lawrence Market Intelligence 👇

Explore Real-time Analytics
Airbnb Seasonality Analysis & Trends in Saint Lawrence (2026)
Peak Season (August, July, October)
- Revenue averages $4,353 per month
- Occupancy rates average 51.6%
- Daily rates average $244
Shoulder Season
- Revenue averages $2,888 per month
- Occupancy maintains around 39.9%
- Daily rates hold near $226
Low Season (January, February, March)
- Revenue drops to average $1,340 per month
- Occupancy decreases to average 23.4%
- Daily rates adjust to average $195
Seasonality Insights for Saint Lawrence
- The Airbnb seasonality in Saint Lawrence shows highly seasonal trends requiring careful strategy. While the sections above show seasonal averages, it's also insightful to look at the extremes:
- During the high season, the absolute peak month showcases Saint Lawrence's highest earning potential, with monthly revenues capable of climbing to $5,366, occupancy reaching a high of 58.3%, and ADRs peaking at $285.
- Conversely, the slowest single month of the year, typically falling within the low season, marks the market's lowest point. In this month, revenue might dip to $1,282, occupancy could drop to 20.7%, and ADRs may adjust down to $175.
- Understanding both the seasonal averages and these monthly peaks and troughs in revenue, occupancy, and ADR is crucial for maximizing your Airbnb profit potential in Saint Lawrence.
Seasonal Strategies for Maximizing Profit
- Peak Season: Maximize revenue through premium pricing and potentially longer minimum stays. Ensure high availability.
- Low Season: Offer competitive pricing, special promotions (e.g., extended stay discounts), and flexible cancellation policies. Target off-season travelers like remote workers or budget-conscious guests.
- Shoulder Seasons: Implement dynamic pricing that balances peak and low rates. Target weekend travelers or specific events. Offer slightly more flexible terms than peak season.
- Regularly analyze your own performance against these Saint Lawrence seasonality benchmarks and adjust your pricing and availability strategy accordingly.
Best Areas for Airbnb Investment in Saint Lawrence (2026)
Exploring the top neighborhoods for short-term rentals in Saint Lawrence? This section highlights key areas, outlining why they are attractive for hosts and guests, along with notable local attractions. Consider these locations based on your target guest profile and investment strategy.
| Neighborhood / Area | Why Host Here? (Target Guests & Appeal) | Key Attractions & Landmarks |
|---|---|---|
| Victoria (Rabat) | The capital city of Gozo, known for its rich history and beautiful architecture. A central location that attracts tourists visiting Gozo's historical sites. | Citadel, Gozo Museum of Archaeology, St. George's Basilica, The Old Prison, Villa Rundle Gardens |
| Marsalforn | A popular tourist resort known for its sandy beach and vibrant atmosphere. Ideal for beach lovers and families looking for a relaxed getaway. | Marsalforn Bay, Salt Pans, Wied il-Għasri, Gozo Diving, Restaurants along the bay |
| Xlendi | A picturesque fishing village and bay that is very popular among tourists. Known for its stunning views and diving spots. | Xlendi Bay, Xlendi Tower, Diving and snorkelling spots, Restaurants with sea views, Scenic cliff walks |
| Comino | A small island known for its stunning Blue Lagoon and untouched natural beauty. A unique destination for those seeking tranquility and nature. | Blue Lagoon, Comino Island hiking trails, Crystal Lagoon, St. Mary's Tower |
| Dwejra | Famous for its natural attractions and the Azure Window (now collapsed). A great spot for nature lovers and outdoor enthusiasts. | Dwejra Bay, Inland Sea, Dwejra Tower, Azure Window remains, Snorkelling |
| Nadur | A charming village known for its traditional Maltese architecture and local festivals. Offers a more authentic experience of Gozitan life. | Nadur Parish Church, The Old Windmill, Ta' Kenuna Tower, Local village festas, Rural scenery |
| Qala | A tranquil village located at the eastern tip of Gozo, known for its scenic views and coastline. Perfect for a quieter escape. | Qala Belvedere, Mġarr ix-Xini bay, Coastal walks, Local markets, Historical sites |
| Sannat | A traditional village with stunning views of the cliffs and inlets. Ideal for those who want to experience local culture and landscapes. | Ta' Cenc Cliffs, Sannat Parish Church, Historical sites, Craft shops, Natural reserves |
Understanding Airbnb License Requirements & STR Laws in Saint Lawrence (2026)
While Saint Lawrence, Gozo Region, Malta currently shows low STR regulations, specific Airbnb license requirements might still exist or change. Always verify the latest short term rental regulations and Airbnb license requirements directly with local government authorities for Saint Lawrence to ensure full compliance before hosting.
(Source: AirROI data, 2026, finding no licensed listings among those analyzed)
Top Performing Airbnb Properties in Saint Lawrence (2026)
Benchmark your potential! Explore examples of top-performing Airbnb properties in Saint Lawrencebased on Trailing Twelve Month (TTM) revenue. Analyze their characteristics, revenue, occupancy rate, and ADR to understand what drives success in this market.

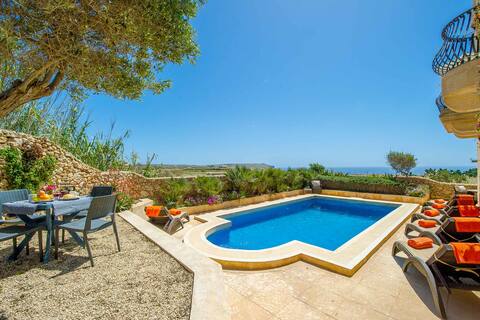
Traditional Farmhouse with Pool in Gozo, Malta
Entire Place • 4 bedrooms

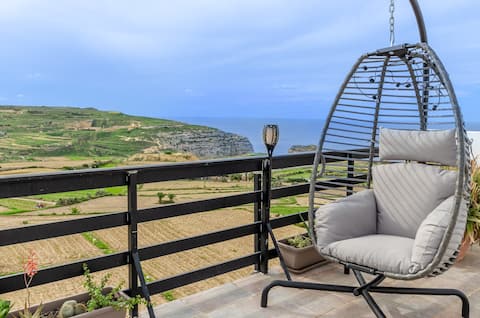
Ocean View House Getaway
Entire Place • 3 bedrooms
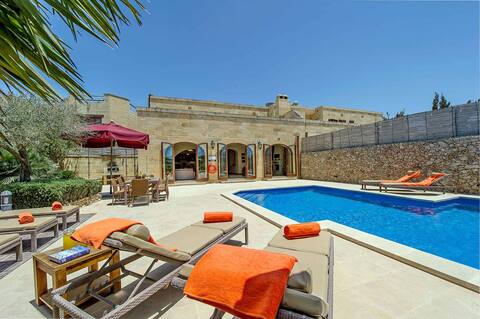
Dar Il-Bahar Holiday home
Entire Place • 3 bedrooms
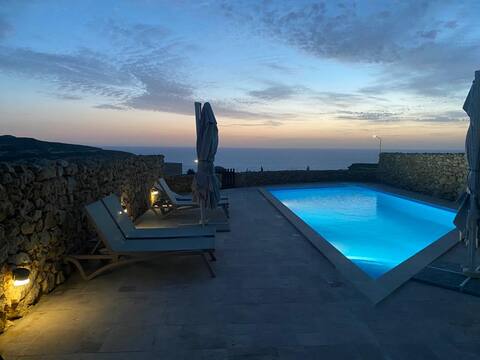
Hot Tub & Sea Views @ 3BR Apt w/Incredible Terrace
Entire Place • 3 bedrooms
The Olives Holiday Home
Entire Place • 4 bedrooms
Dwejra Peak House
Entire Place • 3 bedrooms
Note: Performance varies based on location, size, amenities, seasonality, and management quality. Data reflects the past 12 months.
Top Performing Airbnb Hosts in Saint Lawrence (2026)
Learn from the best! This table showcases top-performing Airbnb hosts in Saint Lawrence based on the number of properties managed and estimated total revenue over the past year. Analyze their scale and performance metrics.
| Host Name | Properties | Grossing Revenue | Stay Reviews | Avg Rating |
|---|---|---|---|---|
| Baron Holiday Homes | 3 | $110,507 | 41 | 4.71/5.0 |
| Zak | 2 | $108,929 | 39 | 4.71/5.0 |
| Gabriel | 1 | $81,018 | 111 | 4.93/5.0 |
| Kevin | 2 | $62,516 | 94 | 4.79/5.0 |
| Jay | 1 | $52,592 | 174 | 4.91/5.0 |
| Steve | 2 | $41,233 | 2 | Not Rated |
| Cordelia | 1 | $28,408 | 23 | 4.87/5.0 |
| Kevin | 1 | $24,460 | 10 | 4.90/5.0 |
| Manny | 1 | $18,095 | 50 | 4.70/5.0 |
| Gianluca | 1 | $16,936 | 94 | 4.85/5.0 |
Analyzing the strategies of top hosts, such as their property selection, pricing, and guest communication, can offer valuable lessons for optimizing your own Airbnb operations in Saint Lawrence.
Dive Deeper: Advanced Saint Lawrence STR Market Data (2026)
Ready to unlock more insights? AirROI provides access to advanced metrics and comprehensive Airbnb data for Saint Lawrence. Explore detailed analytics beyond this report to refine your investment strategy, optimize pricing, and maximize your vacation rental profits.
Explore Advanced MetricsSaint Lawrence Short-Term Rental Market Composition (2026): Property & Room Types
Room Type Distribution
Property Type Distribution
Market Composition Insights for Saint Lawrence
- The Saint Lawrence Airbnb market composition is heavily skewed towards Entire Home/Apt listings, which make up 78.6% of the 28 active rentals. This indicates strong guest preference for privacy and space.
- Looking at the property type distribution in Saint Lawrence, House properties are the most common (71.4%), reflecting the local real estate landscape.
- Houses represent a significant 71.4% portion, catering likely to families or larger groups.
- The presence of 7.1% Hotel/Boutique listings indicates integration with traditional hospitality.
Saint Lawrence Airbnb Room Capacity Analysis (2026): Bedroom Distribution
Distribution of Listings by Number of Bedrooms
Room Capacity Insights for Saint Lawrence
- The dominant room capacity in Saint Lawrence is 4 bedrooms listings, making up 28.6% of the market. This suggests a strong demand for properties suitable for families or small groups.
- Together, 4 bedrooms and 3 bedrooms properties represent 53.6% of the active Airbnb listings in Saint Lawrence, indicating a high concentration in these sizes.
- A significant 67.9% of listings offer 3+ bedrooms, catering to larger groups and families seeking more space in Saint Lawrence.
Saint Lawrence Vacation Rental Guest Capacity Trends (2026)
Distribution of Listings by Guest Capacity
Guest Capacity Insights for Saint Lawrence
- The most common guest capacity trend in Saint Lawrence vacation rentals is listings accommodating 8+ guests (50%). This suggests the primary traveler segment is likely larger groups.
- Properties designed for 8+ guests and 4 guests dominate the Saint Lawrence STR market, accounting for 64.3% of listings.
- 60.7% of properties accommodate 6+ guests, serving the market segment for larger families or group travel in Saint Lawrence.
- On average, properties in Saint Lawrence are equipped to host 5.4 guests.
Saint Lawrence Airbnb Booking Patterns (2026): Available vs. Booked Days
Available Days Distribution
Booked Days Distribution
Booking Pattern Insights for Saint Lawrence
- The most common availability pattern in Saint Lawrence falls within the 271-366 days range, representing 64.3% of listings. This suggests many properties have significant open periods on their calendars.
- Approximately 82.2% of listings show high availability (181+ days open annually), indicating potential for increased bookings or specific owner usage patterns.
- For booked days, the 31-90 days range is most frequent in Saint Lawrence (28.6%), reflecting common guest stay durations or potential owner blocking patterns.
- A notable 17.9% of properties secure long booking periods (181+ days booked per year), highlighting successful long-term rental strategies or significant owner usage.
Saint Lawrence Airbnb Minimum Stay Requirements Analysis
Distribution of Listings by Minimum Night Requirement
1 Night
6 listings
21.4% of total
2 Nights
2 listings
7.1% of total
3 Nights
1 listings
3.6% of total
4-6 Nights
3 listings
10.7% of total
7-29 Nights
2 listings
7.1% of total
30+ Nights
14 listings
50% of total
Key Insights
- The most prevalent minimum stay requirement in Saint Lawrence is 30+ Nights, adopted by 50% of listings. This highlights the market's preference for longer commitments.
- A significant segment (50%) caters to monthly stays (30+ nights) in Saint Lawrence, pointing to opportunities in the extended-stay market.
Recommendations
- Align with the market by considering a 30+ Nights minimum stay, as 50% of Saint Lawrence hosts use this setting.
- If feasible, allowing 1-night stays, especially midweek or during low season, could capture last-minute bookings, as only 21.4% currently do.
- Explore offering discounts for stays of 30+ nights to attract the 50% of the market seeking extended stays.
- Adjust minimum nights based on seasonality – potentially shorter during low season and longer during peak demand periods in Saint Lawrence.
Saint Lawrence Airbnb Cancellation Policy Trends Analysis (2026)
Super Strict 30 Days
3 listings
11.1% of total
Flexible
2 listings
7.4% of total
Moderate
5 listings
18.5% of total
Firm
15 listings
55.6% of total
Strict
2 listings
7.4% of total
Cancellation Policy Insights for Saint Lawrence
- The prevailing Airbnb cancellation policy trend in Saint Lawrence is Firm, used by 55.6% of listings.
- A majority (63.0%) of hosts in Saint Lawrence utilize Firm or Strict policies, indicating a market where hosts prioritize booking security.
- Strict cancellation policies are quite rare (7.4%), potentially making listings with this policy less competitive unless justified by high demand or property type.
Recommendations for Hosts
- Consider adopting a Firm policy to align with the 55.6% market standard in Saint Lawrence.
- Using a Strict policy might deter some guests, as only 7.4% of listings use it. Evaluate if potential revenue protection outweighs possible lower booking rates.
- Regularly review your cancellation policy against competitors and market demand shifts in Saint Lawrence.
Saint Lawrence STR Booking Lead Time Analysis (2026)
Average Booking Lead Time by Month
Booking Lead Time Insights for Saint Lawrence
- The overall average booking lead time for vacation rentals in Saint Lawrence is 86 days.
- Guests book furthest in advance for stays during October (average 131 days), likely coinciding with peak travel demand or local events.
- The shortest booking windows occur for stays in November (average 29 days), indicating more last-minute travel plans during this time.
- Seasonally, Fall (86 days avg.) sees the longest lead times, while Winter (68 days avg.) has the shortest, reflecting typical travel planning cycles.
Recommendations for Hosts
- Use the overall average lead time (86 days) as a baseline for your pricing and availability strategy in Saint Lawrence.
- For October stays, consider implementing length-of-stay discounts or slightly higher rates for bookings made less than 131 days out to capitalize on advance planning.
- Target marketing efforts for the Fall season well in advance (at least 86 days) to capture early planners.
- Monitor your own booking lead times against these Saint Lawrence averages to identify opportunities for dynamic pricing adjustments.
Popular & Essential Airbnb Amenities in Saint Lawrence (2026)
Amenity Prevalence
Amenity Insights for Saint Lawrence
- Essential amenities in Saint Lawrence that guests expect include: Wifi. Lacking these (this) could significantly impact bookings.
- Popular amenities like Heating, Iron, Essentials are common but not universal. Offering these can provide a competitive edge.
Recommendations for Hosts
- Ensure your listing includes all essential amenities for Saint Lawrence: Wifi.
- Consider adding popular differentiators like Heating or Iron to increase appeal.
- Highlight unique or less common amenities you offer (e.g., hot tub, dedicated workspace, EV charger) in your listing description and photos.
- Regularly check competitor amenities in Saint Lawrence to stay competitive.
Saint Lawrence Airbnb Guest Demographics & Profile Analysis (2026)
Guest Profile Summary for Saint Lawrence
- The typical guest profile for Airbnb in Saint Lawrence consists of predominantly international visitors (85%), with top international origins including Malta, typically belonging to the Post-2000s (Gen Z/Alpha) group (50%), primarily speaking English or French.
- Domestic travelers account for 15.5% of guests.
- Key international markets include United Kingdom (31%) and Malta (15.5%).
- Top languages spoken are English (35.8%) followed by French (12.3%).
- A significant demographic segment is the Post-2000s (Gen Z/Alpha) group, representing 50% of guests.
Recommendations for Hosts
- Focus marketing internationally, particularly towards travelers from Malta.
- Tailor amenities and listing descriptions to appeal to the dominant Post-2000s (Gen Z/Alpha) demographic (e.g., highlight fast WiFi, smart home features, local guides).
- Highlight unique local experiences or amenities relevant to the primary guest profile.
- Consider seasonal promotions aligned with peak travel times for key origin markets.
Nearby Short-Term Rental Market Comparison
How does the Saint Lawrence Airbnb market stack up against its neighbors? Compare key performance metrics like average monthly revenue, ADR, and occupancy rates in surrounding areas to understand the broader regional STR landscape.
| Market | Active Properties | Monthly Revenue | Daily Rate | Avg. Occupancy |
|---|---|---|---|---|
| Mdina | 16 | $3,124 | $218.25 | 57% |
| Taormina | 1,004 | $2,744 | $247.48 | 48% |
| Valletta | 604 | $2,598 | $187.70 | 53% |
| Mellieħa | 455 | $2,387 | $181.28 | 51% |
| Trecastagni | 57 | $2,356 | $307.87 | 34% |
| Senglea | 106 | $2,216 | $142.33 | 60% |
| Żejtun | 44 | $2,210 | $189.49 | 45% |
| Santa Venerina | 52 | $2,153 | $278.18 | 41% |
| Birgu | 108 | $2,141 | $156.24 | 57% |
| Graniti | 20 | $2,139 | $177.04 | 47% |